Pearson Edexcel · A-Level · Biology
Inheritance
Master Edexcel A-Level Inheritance (7.1) with this guide, covering everything from complex genetic crosses to the Chi-squared test. Secure top marks by understanding how examiners award credit for precise terminology and structured answers.
- 6 min read
- 3 worked examples
- 5 practice questions
- 6 key terms
Study Notes
Overview
Inheritance is a cornerstone of modern biology, exploring how genetic information is passed across generations. For Edexcel A-Level candidates, Topic 7.1 moves beyond simple Mendelian genetics into the complex and fascinating patterns that govern the real world. This topic demands a firm grasp of genetic diagrams, an understanding of how genes interact, and the ability to apply statistical analysis to biological data. Examiners frequently test this area through multi-part questions that require you to construct genetic crosses for dihybrid inheritance, autosomal linkage, sex-linkage, and epistasis, before using the Chi-squared test to evaluate your findings. A strong performance here is essential, as it demonstrates not only your knowledge (AO1) but also your ability to apply it to unfamiliar contexts (AO2) and analyse experimental results (AO3).
Key Concepts
Concept 1: Dihybrid Inheritance & Autosomal Linkage
Dihybrid inheritance involves tracking two different genes, located on different chromosomes. The classic dihybrid cross between two fully heterozygous parents (e.g., RrYy x RrYy) produces a 9:3:3:1 phenotypic ratio, a direct result of Mendel's Law of Independent Assortment. However, when two genes are on the same autosome (a non-sex chromosome), they are considered linked. These genes tend to be inherited together, disrupting independent assortment. This results in a much higher proportion of offspring with the parental phenotypes and a much lower proportion of recombinant phenotypes. Recombinants are only formed if a chiasma (point of crossing over) forms between the two gene loci during meiosis. The closer the loci, the lower the recombination frequency.
Example: In fruit flies, body colour (G/g) and wing shape (V/v) are linked. A cross between a heterozygous grey-bodied, normal-winged fly (GgVv) and a black-bodied, vestigial-winged fly (ggvv) does not yield the expected 1:1:1:1 ratio. Instead, you see a majority of grey-normal (parental) and black-vestigial (parental) offspring, with only a few grey-vestigial (recombinant) and black-normal (recombinant) flies.
Concept 2: Sex-Linkage
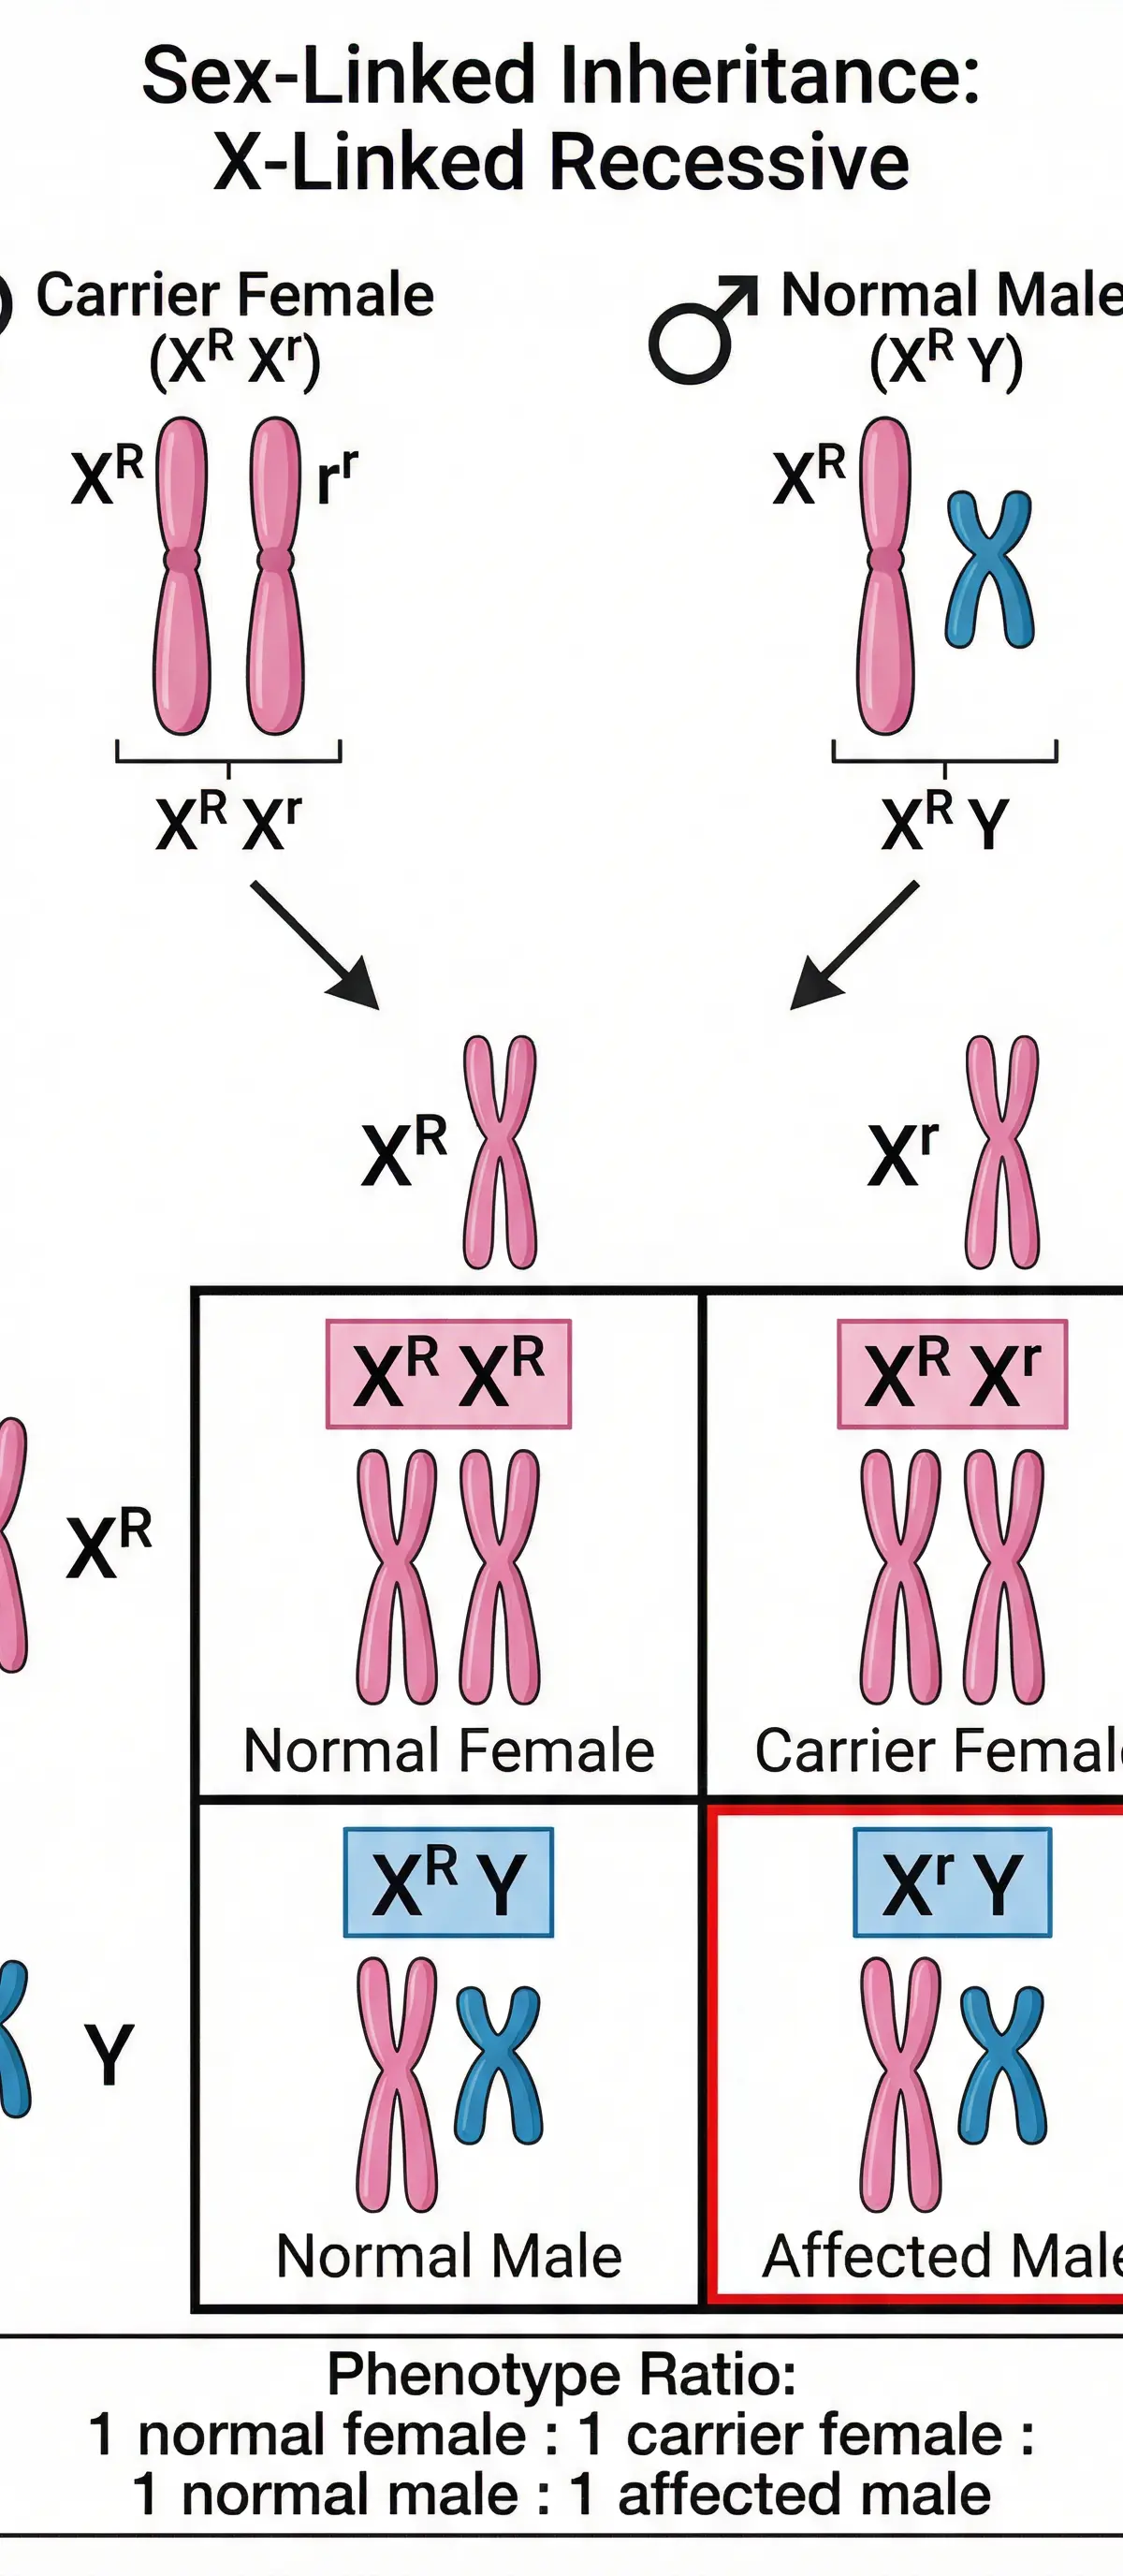
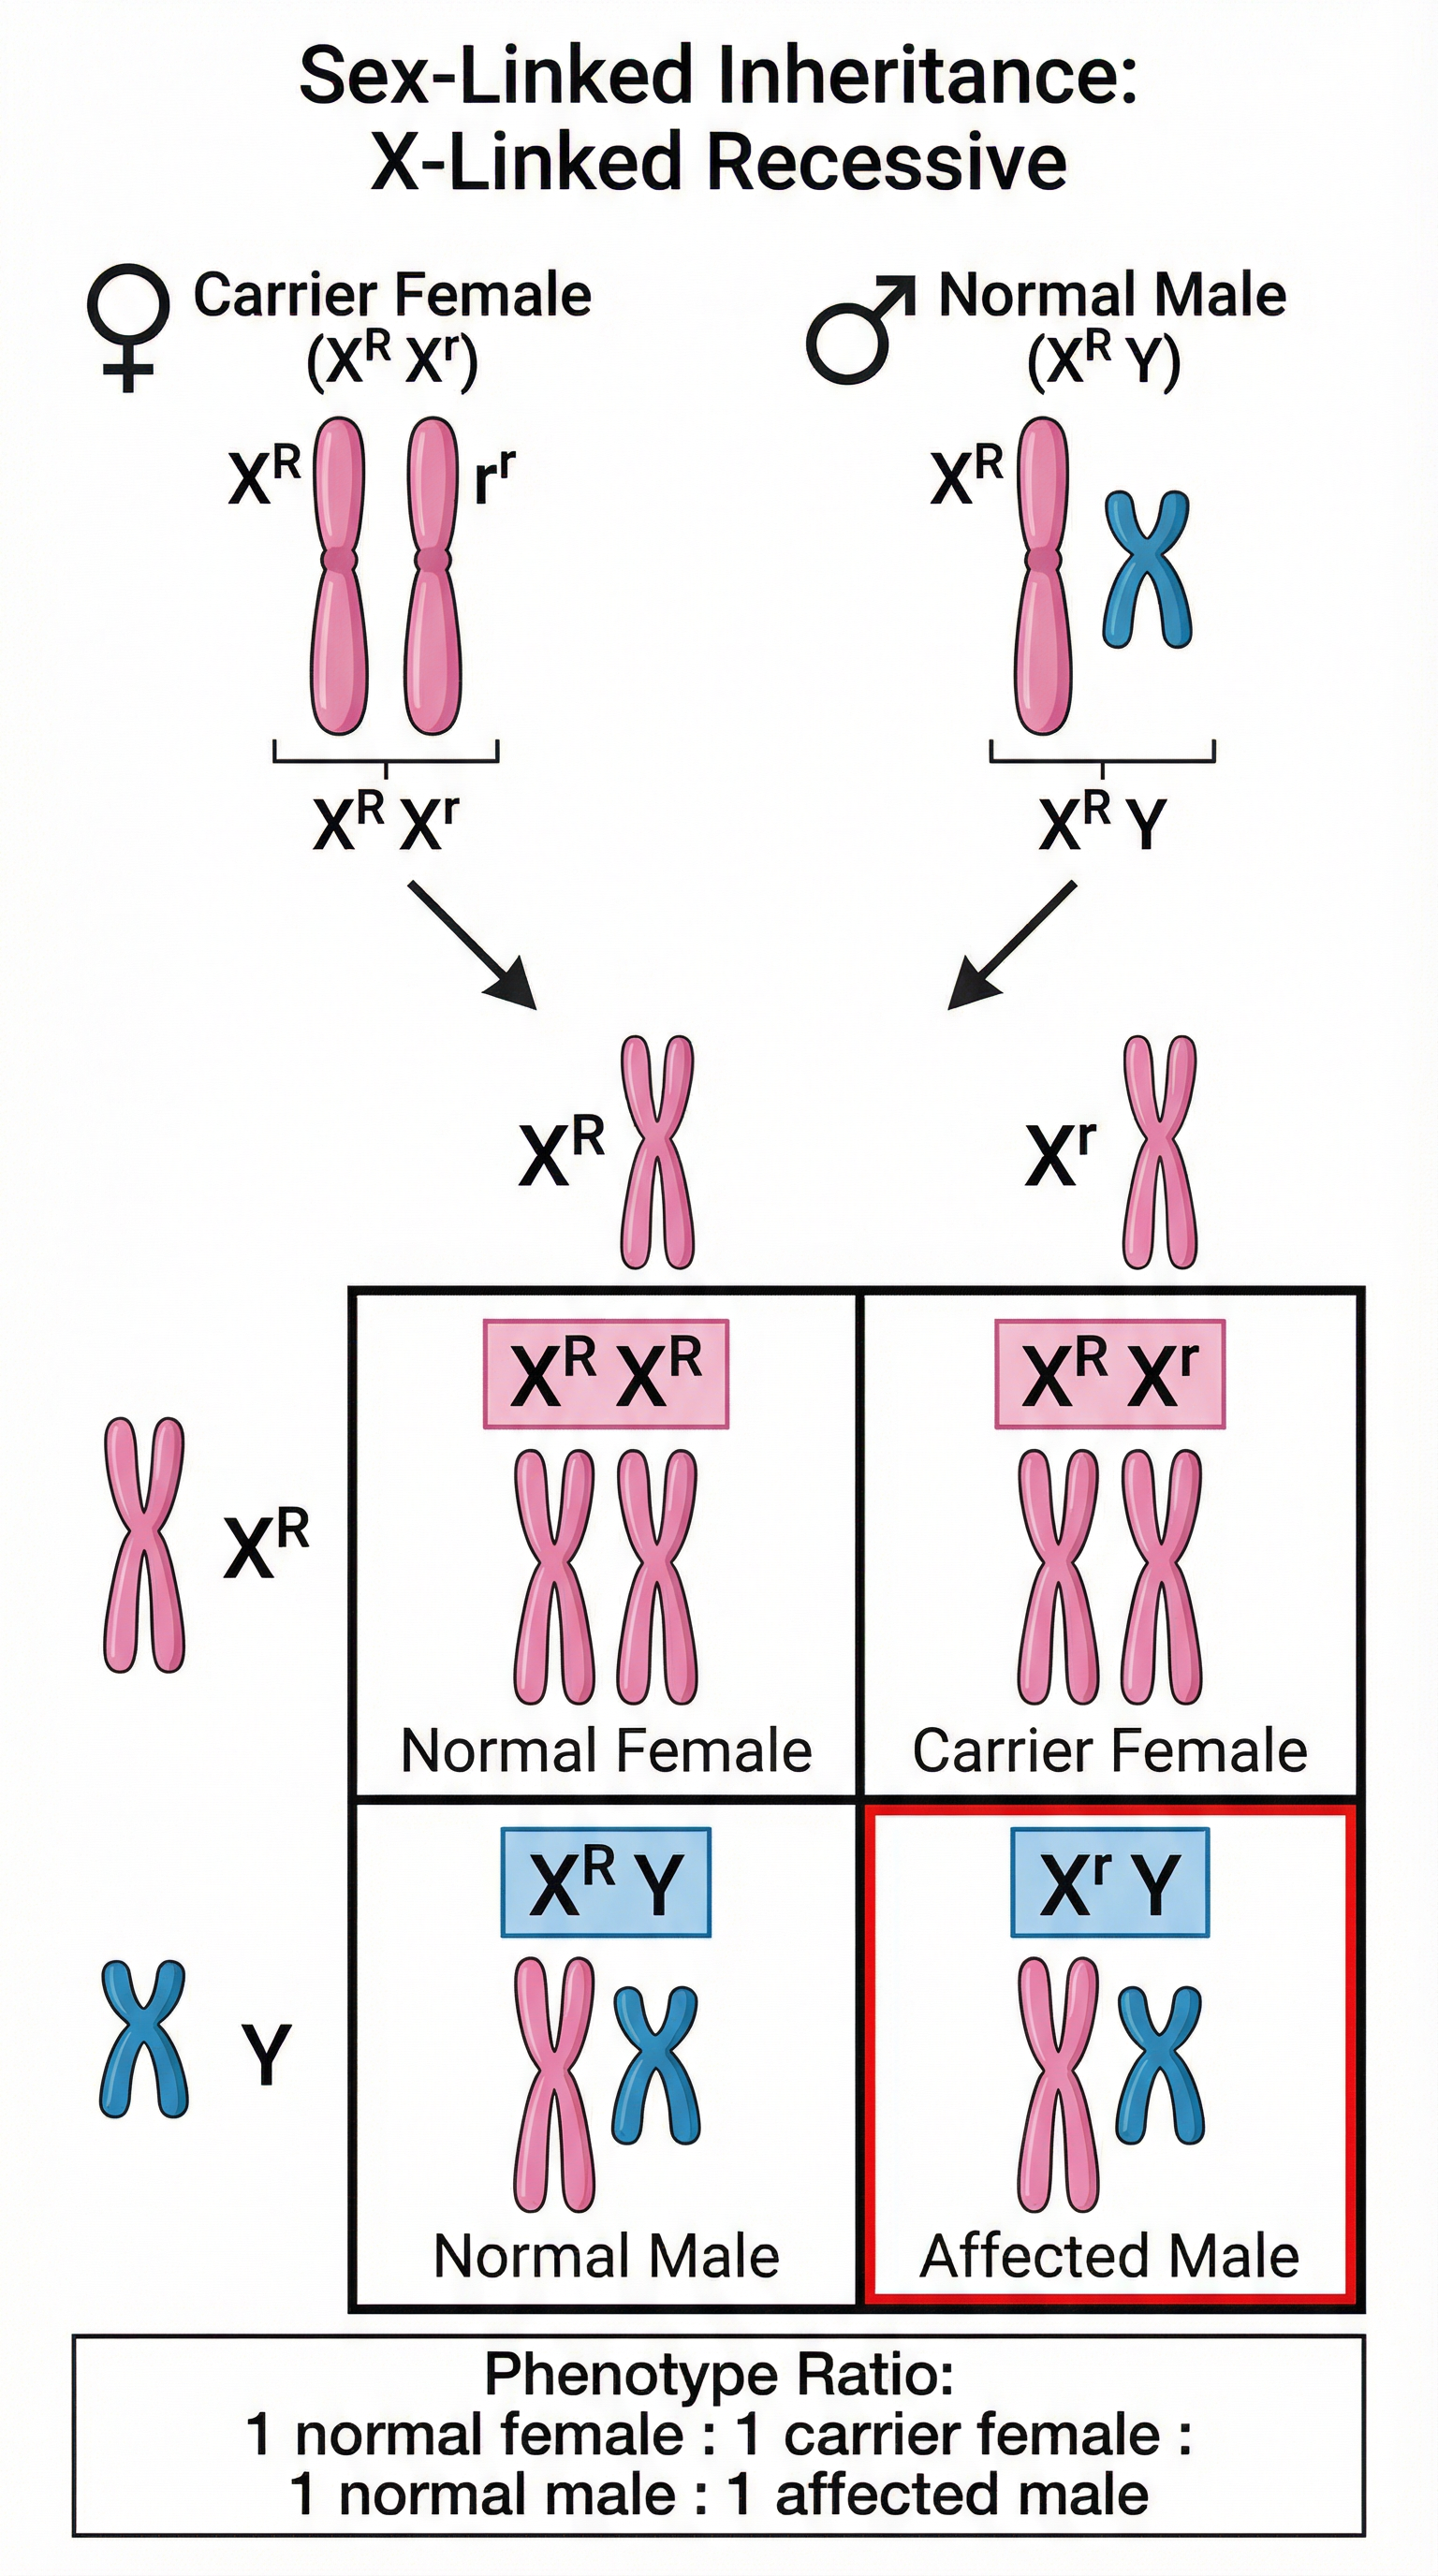
Sex-linked genes are located on one of the sex chromosomes (X or Y). In A-Level Biology, this almost always refers to genes on the X chromosome (X-linkage). Since males are hemizygous (XY), they only have one copy of any X-linked gene. This means a single recessive allele on their X chromosome will always be expressed in the phenotype. Females (XX) must have two copies of the recessive allele to show the trait. This leads to a key observation: X-linked recessive conditions are far more common in males. When constructing genetic diagrams for sex-linkage, it is critical to use superscript notation on the X chromosome (e.g., X^R, X^r) and to show the Y chromosome as having no corresponding allele. Credit is specifically awarded for this correct notation.
Concept 3: Epistasis
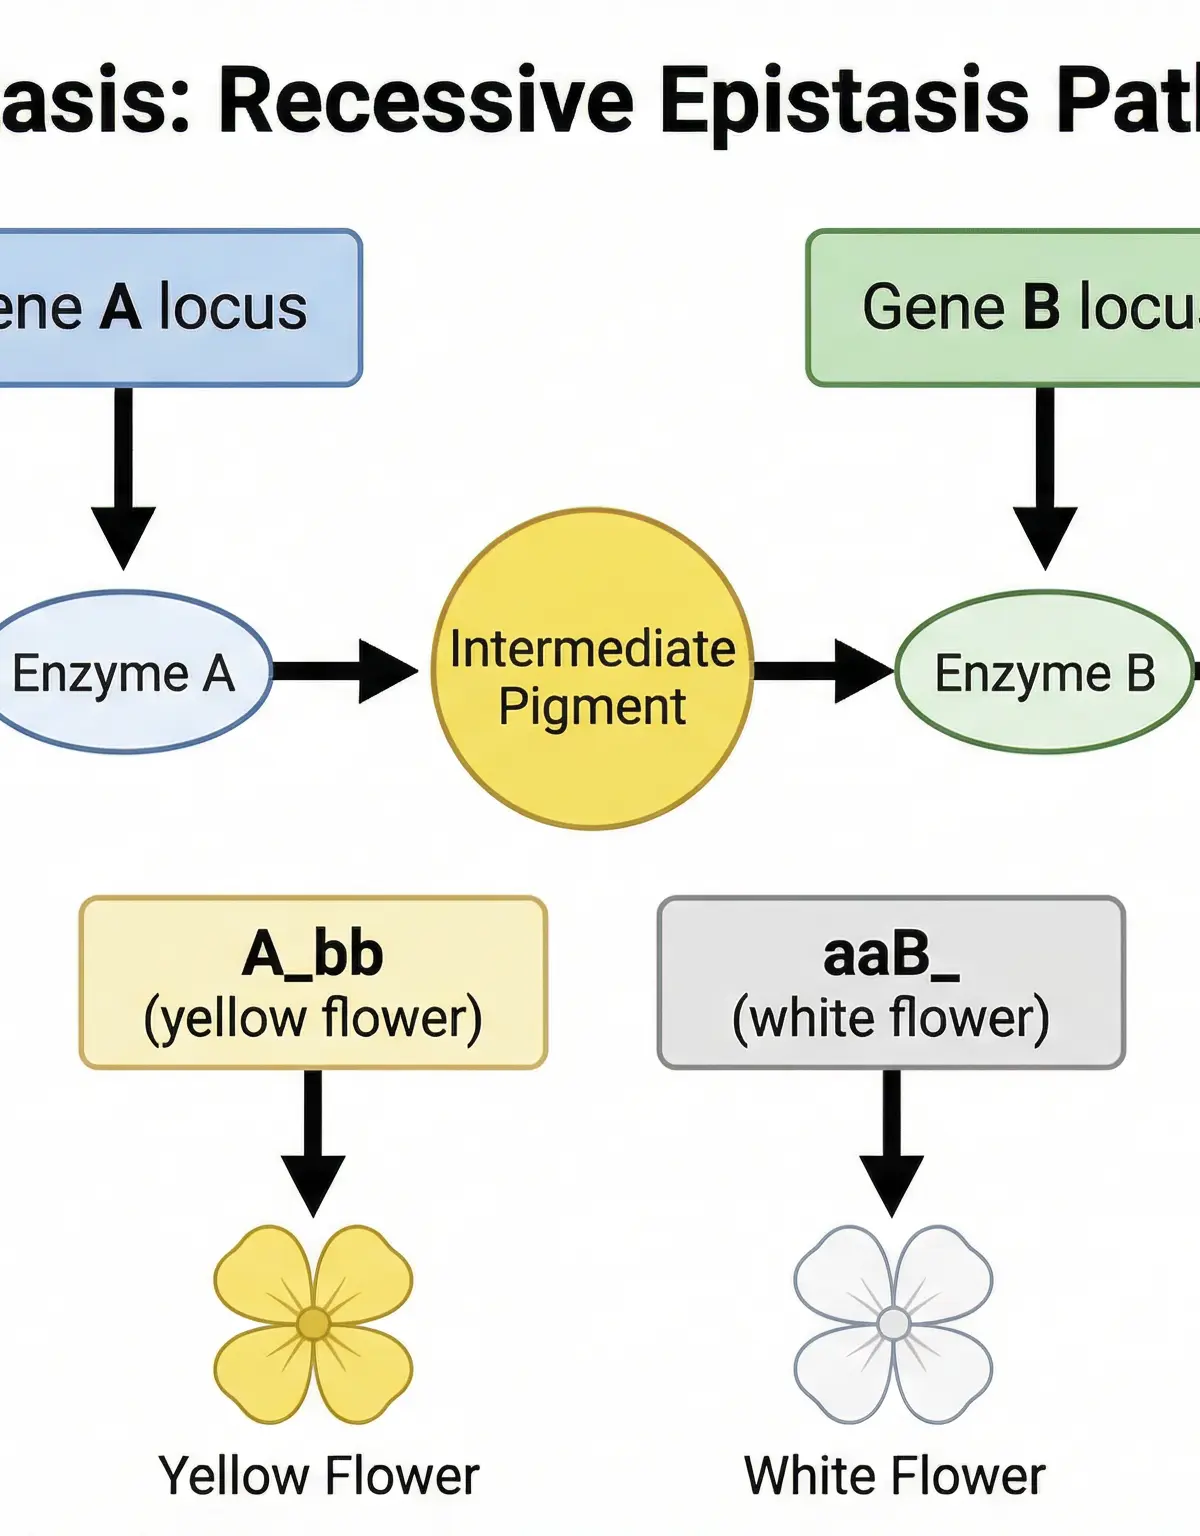
Epistasis is the interaction of genes at different loci, where one gene masks or suppresses the expression of another. This often occurs in metabolic pathways where the product of one gene acts as the substrate for the next. Recessive epistasis (ratio 9:3:4) occurs when the epistatic gene must be homozygous recessive (e.g., aa) to mask the other gene. Dominant epistasis (ratio 12:3:1) occurs when a single dominant allele at the epistatic locus is sufficient to cause the masking.
Example: In Labrador retrievers, coat colour is controlled by two genes. The B/b gene determines pigment (black or brown), but the E/e gene controls pigment deposition. If a dog is homozygous recessive for the deposition gene (ee), it will have a yellow coat regardless of the B/b alleles. The 'ee' genotype is epistatic to the B/b gene.
Mathematical/Scientific Relationships
The Chi-Squared (χ²) Test
This statistical test is used to determine if the difference between observed and expected results is statistically significant or simply due to chance. It is a cornerstone of genetics analysis questions.
- Formula: χ² = Σ [ (Observed - Expected)² / Expected ] (This formula is provided in the exam)
- Σ: Sum of
- O: Observed frequency for a category
- E: Expected frequency for a category
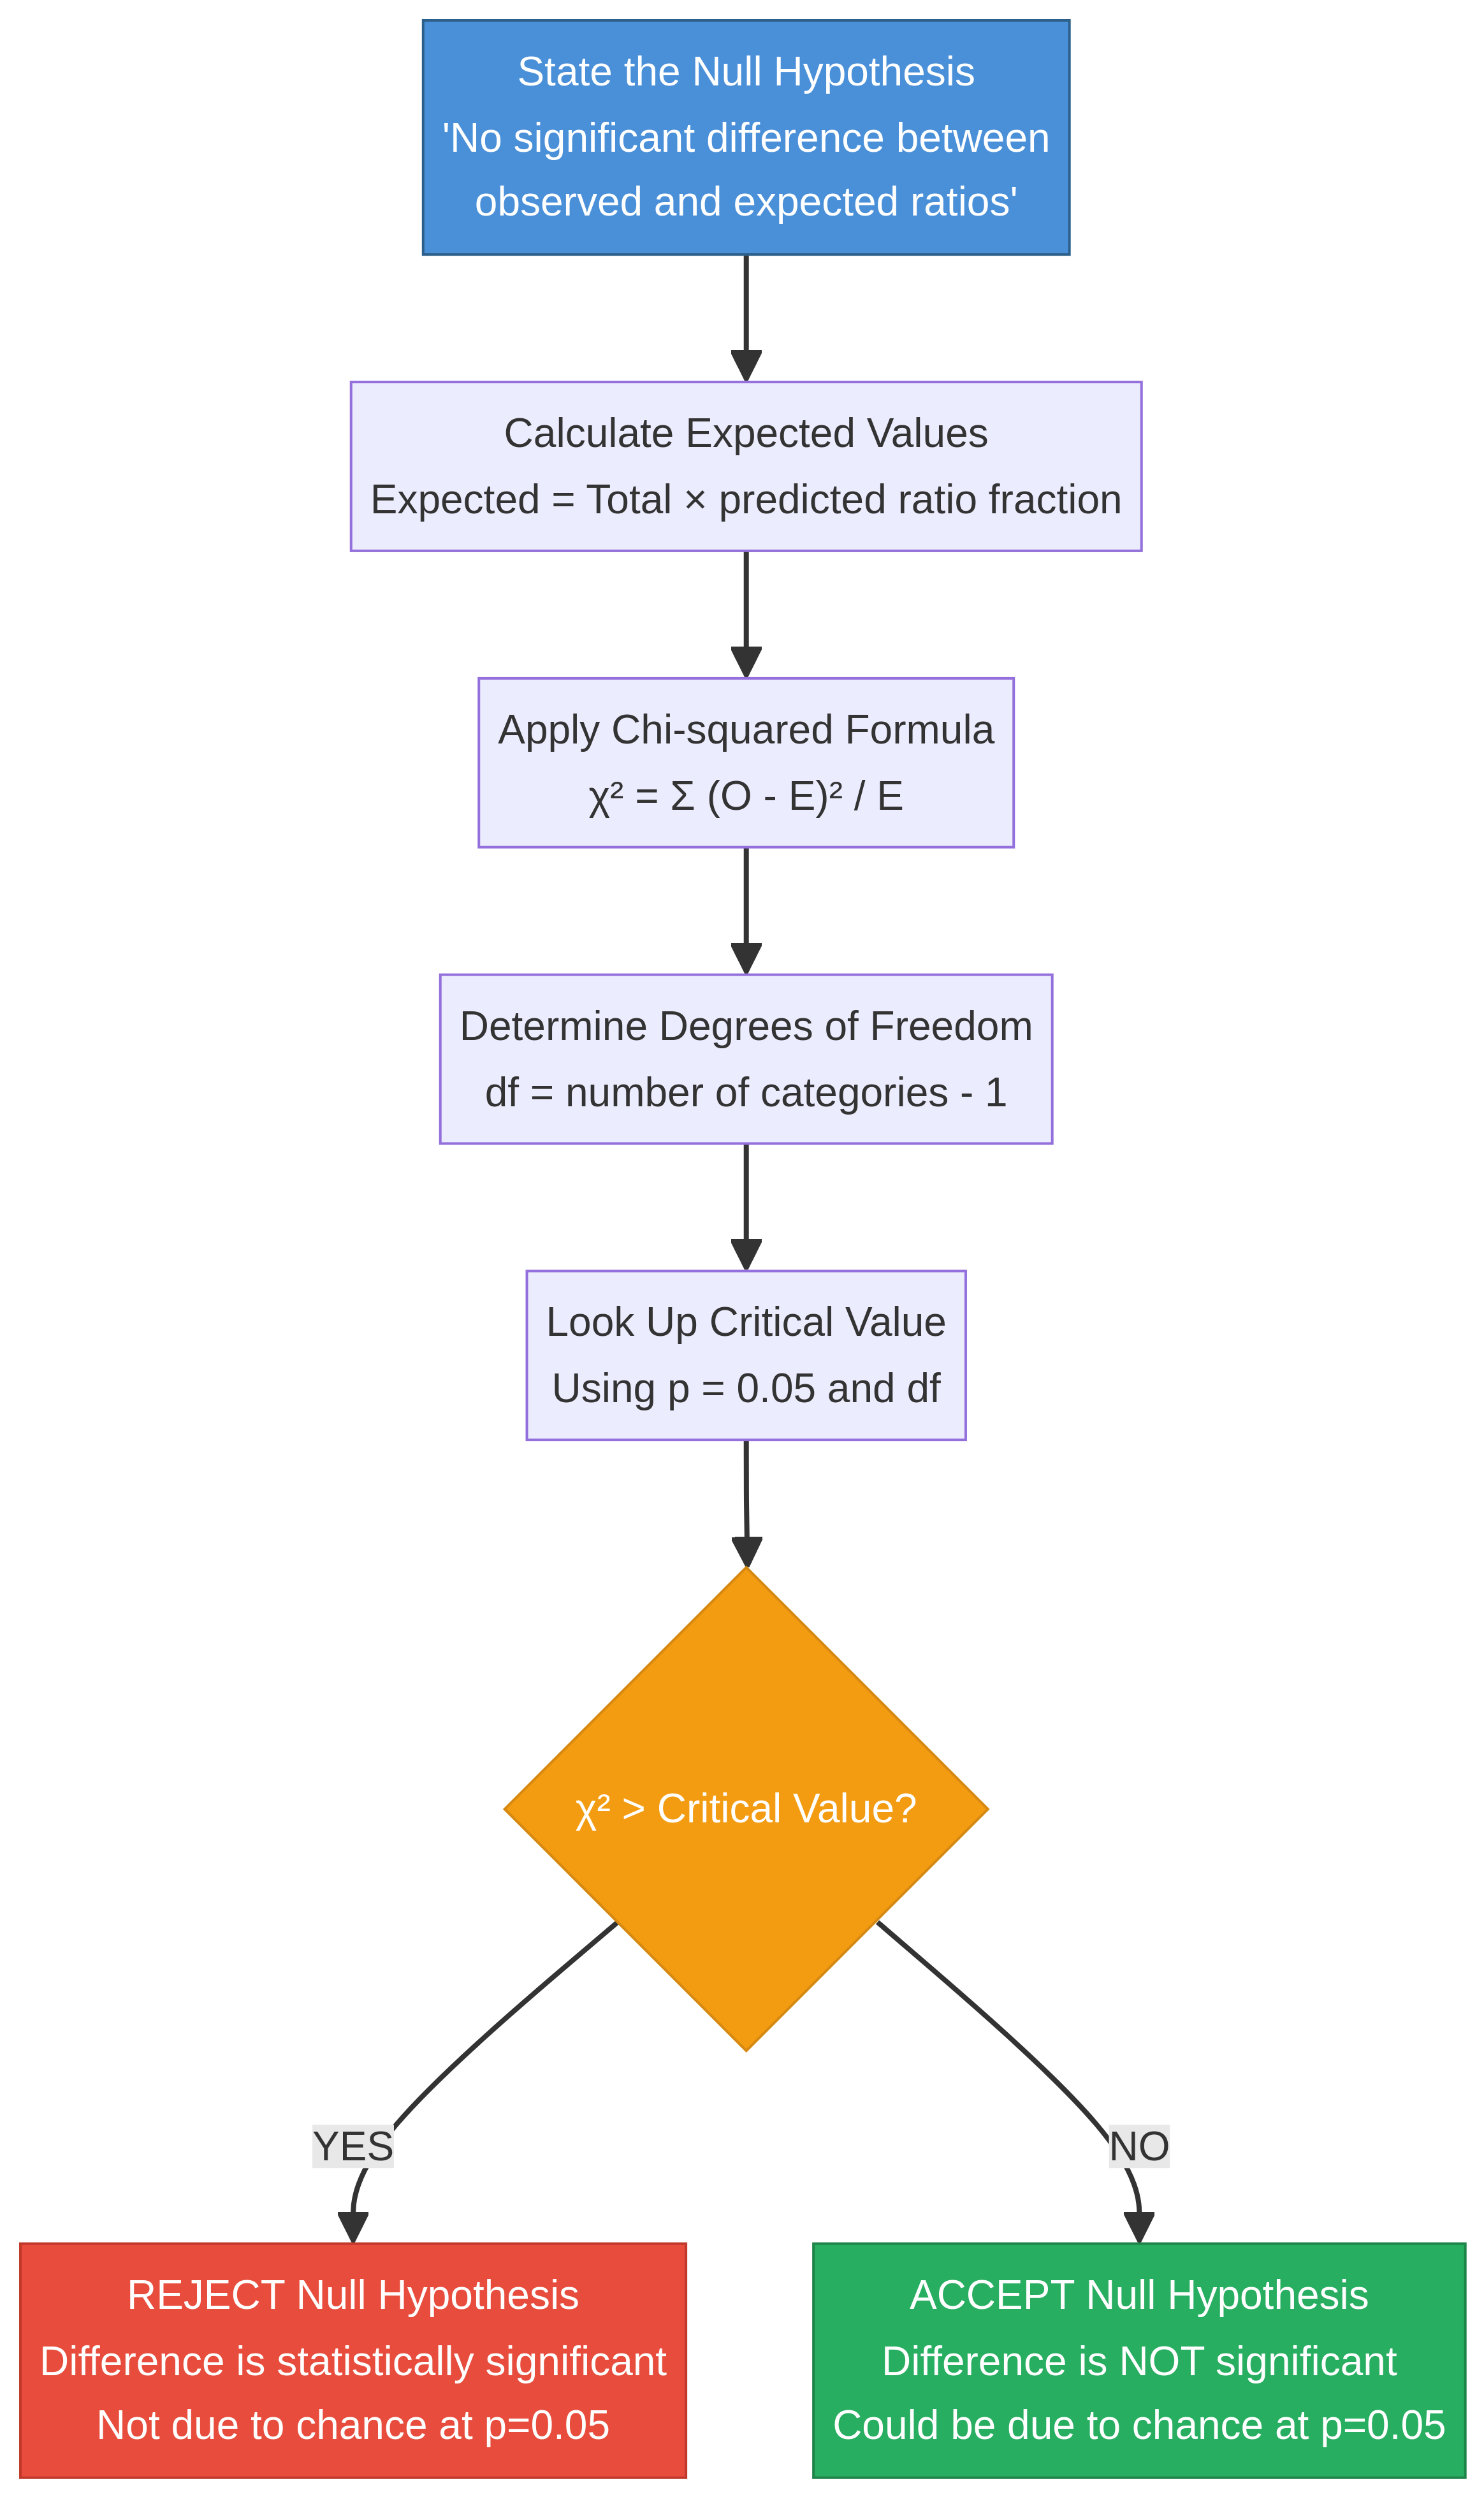
To use the test, you must first state a null hypothesis, which is always: 'There is no significant difference between the observed and expected results.' You then calculate the expected values based on a theoretical genetic ratio (e.g., 9:3:3:1). After calculating the χ² value, you compare it to a critical value from a table at a specific probability level (p=0.05) and with the correct degrees of freedom (df = number of categories - 1). If χ² > critical value, you reject the null hypothesis.
Practical Applications
Inheritance has profound practical applications, from genetic counselling to agriculture. Understanding the inheritance patterns of genetic disorders like cystic fibrosis (autosomal recessive) or Huntington's disease (autosomal dominant) allows genetic counsellors to advise prospective parents on the probability of their children being affected. In agriculture, breeders use knowledge of dihybrid inheritance and linkage to select for desirable traits in crops and livestock, such as high yield and disease resistance. The development of new varieties of wheat and rice through selective breeding has been a cornerstone of the Green Revolution, feeding billions worldwide.
Visual Resources
4 diagrams and illustrations
Interactive Diagrams
2 interactive diagrams to visualise key concepts
Conceptual Flow Outline
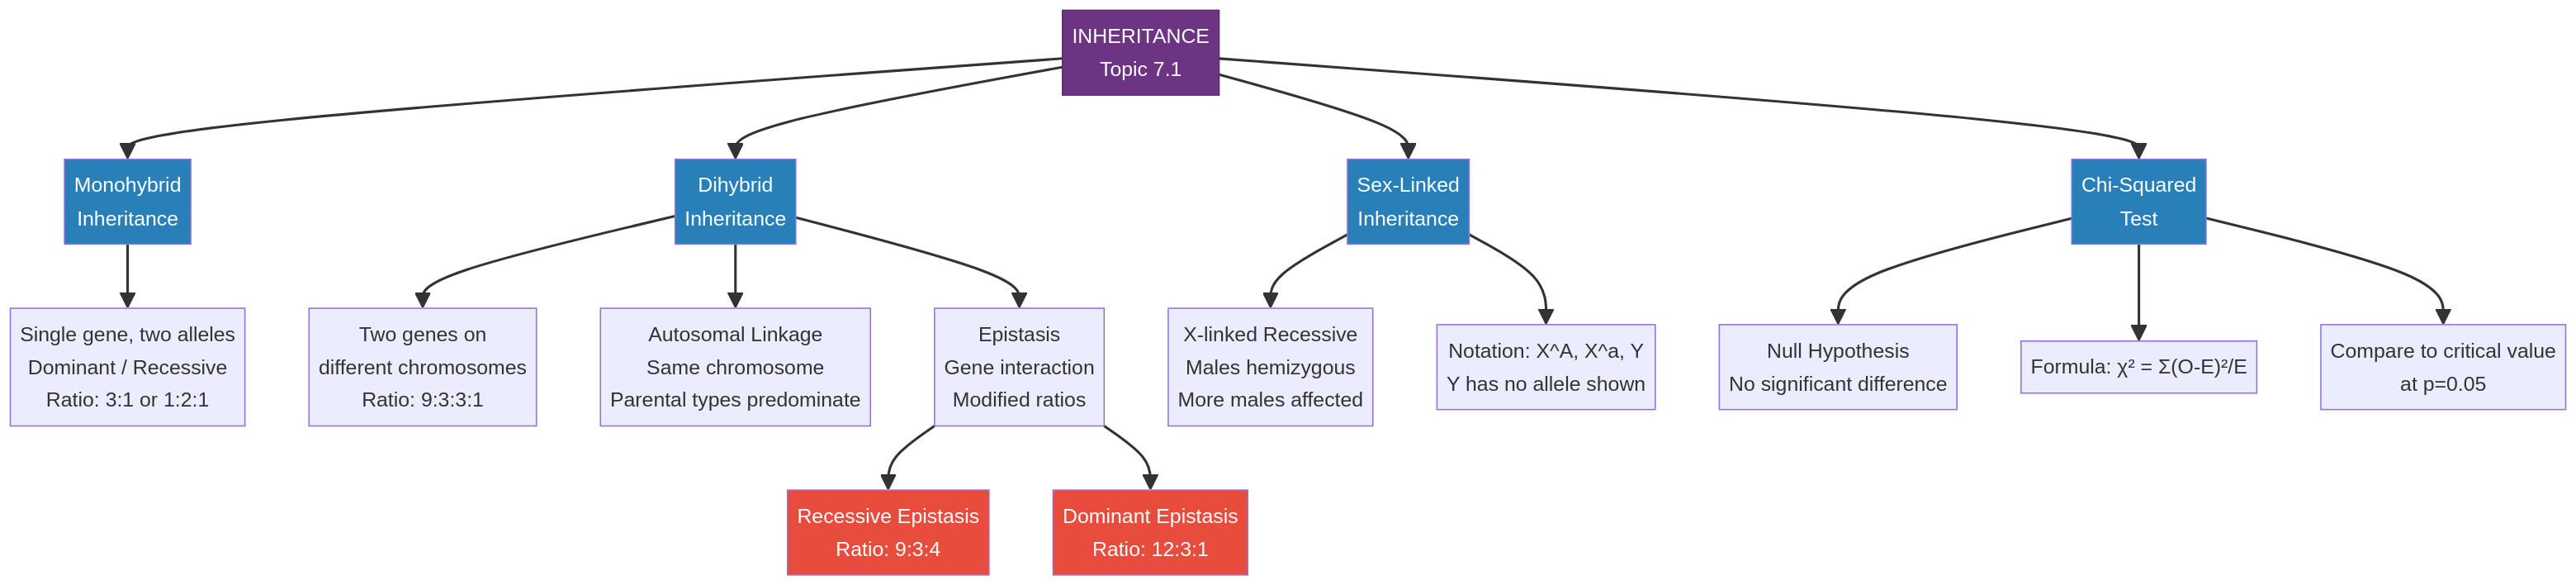
A concept map showing the key areas within the A-Level Inheritance topic and how they relate.
Conceptual Flow Outline
A flowchart detailing the step-by-step process for carrying out and interpreting a Chi-squared test.
Worked Examples
3 worked examples — open one to explore the question and available guidance.
Practice Questions
Test your understanding — click to reveal model answers
In cats, the gene for coat colour is sex-linked. The allele for ginger fur (X^G) and the allele for black fur (X^B) are codominant, resulting in a tortoiseshell phenotype (X^G X^B). A tortoiseshell female is crossed with a black male. What is the probability of them producing a tortoiseshell female kitten? (3 marks)
Hint: Remember to set up the parental genotypes correctly using the sex-linkage notation. The male will be X^B Y.
Explain why a man with an X-linked recessive condition cannot pass it on to his sons. (2 marks)
Hint: Think about which sex chromosome a father passes to his son.
In a species of plant, a dihybrid cross is expected to give a 9:3:3:1 ratio. A student performs the cross and observes the following offspring: 882 tall purple, 315 tall white, 298 short purple, 105 short white. The calculated Chi-squared value is 1.2. The critical value at p=0.05 for 3 degrees of freedom is 7.81. Analyse this result. (3 marks)
Hint: Follow the Chi-squared conclusion steps. Compare calculated to critical, state what you do with the null hypothesis, and explain what it means.
Distinguish between autosomal linkage and sex-linkage. (4 marks)
Hint: Use the word 'whereas' to structure your comparison. Think about chromosome location and inheritance patterns.
Explain how dominant epistasis results in a 12:3:1 phenotypic ratio. (3 marks)
Hint: Think about how a single dominant allele at one locus can mask the expression of another gene.