Data Collection — OCR GCSE Study Guide
Exam Board: OCR | Level: GCSE
Master the core of scientific practice by learning how to collect, record, and interpret biological data like a professional. This guide focuses on the essential 'Working Scientifically' skills that OCR examiners love to test, turning tricky data questions into guaranteed marks."

## Overview
Data collection is the bedrock of all biological investigation. It is not merely about measuring and recording; it is a systematic process governed by principles of accuracy, precision, and fairness to ensure that the conclusions we draw are valid and reliable. For your OCR GCSE Biology exam, this topic (specification reference 8.2) is not just a small section—it is the practical application of 'Working Scientifically' skills, which account for a substantial portion of your final grade (around 40% AO3 and 45% AO2). Examiners will test your ability to design experiments, construct flawless data tables, evaluate measurement techniques, and handle data with integrity. Questions on this topic can range from designing an investigation from scratch to critiquing a fictional student's method, so a firm grasp of these fundamentals is non-negotiable for achieving a top grade.
## Key Concepts
### Concept 1: Variables
In any scientific investigation, we study the relationship between different factors, or variables. It is crucial to distinguish between them.
- **Independent Variable (IV)**: This is the variable that you, the scientist, deliberately change or select to see what effect it has. It is independent of the other variables. In a graph, this always goes on the x-axis.
- **Dependent Variable (DV)**: This is the variable that you measure to see if it has been affected by the change in the IV. Its value *depends* on the independent variable. In a graph, this always goes on the y-axis.
- **Control Variables**: These are all the other factors that could potentially affect the dependent variable. You must keep them constant throughout the experiment to ensure a fair test. If they are not controlled, you cannot be sure that the change in the IV is what caused the change in the DV.
**Example**: Investigating the effect of light intensity on the rate of photosynthesis. The **Independent Variable** is the light intensity (which you change by moving a lamp closer or further away). The **Dependent Variable** is the rate of photosynthesis (which you measure by counting the number of oxygen bubbles produced per minute). **Control Variables** would include temperature, carbon dioxide concentration, and the species of pondweed used.
### Concept 2: Constructing Data Tables
A well-constructed table is essential for recording data clearly and is worth several marks in an exam. OCR has very specific rules.
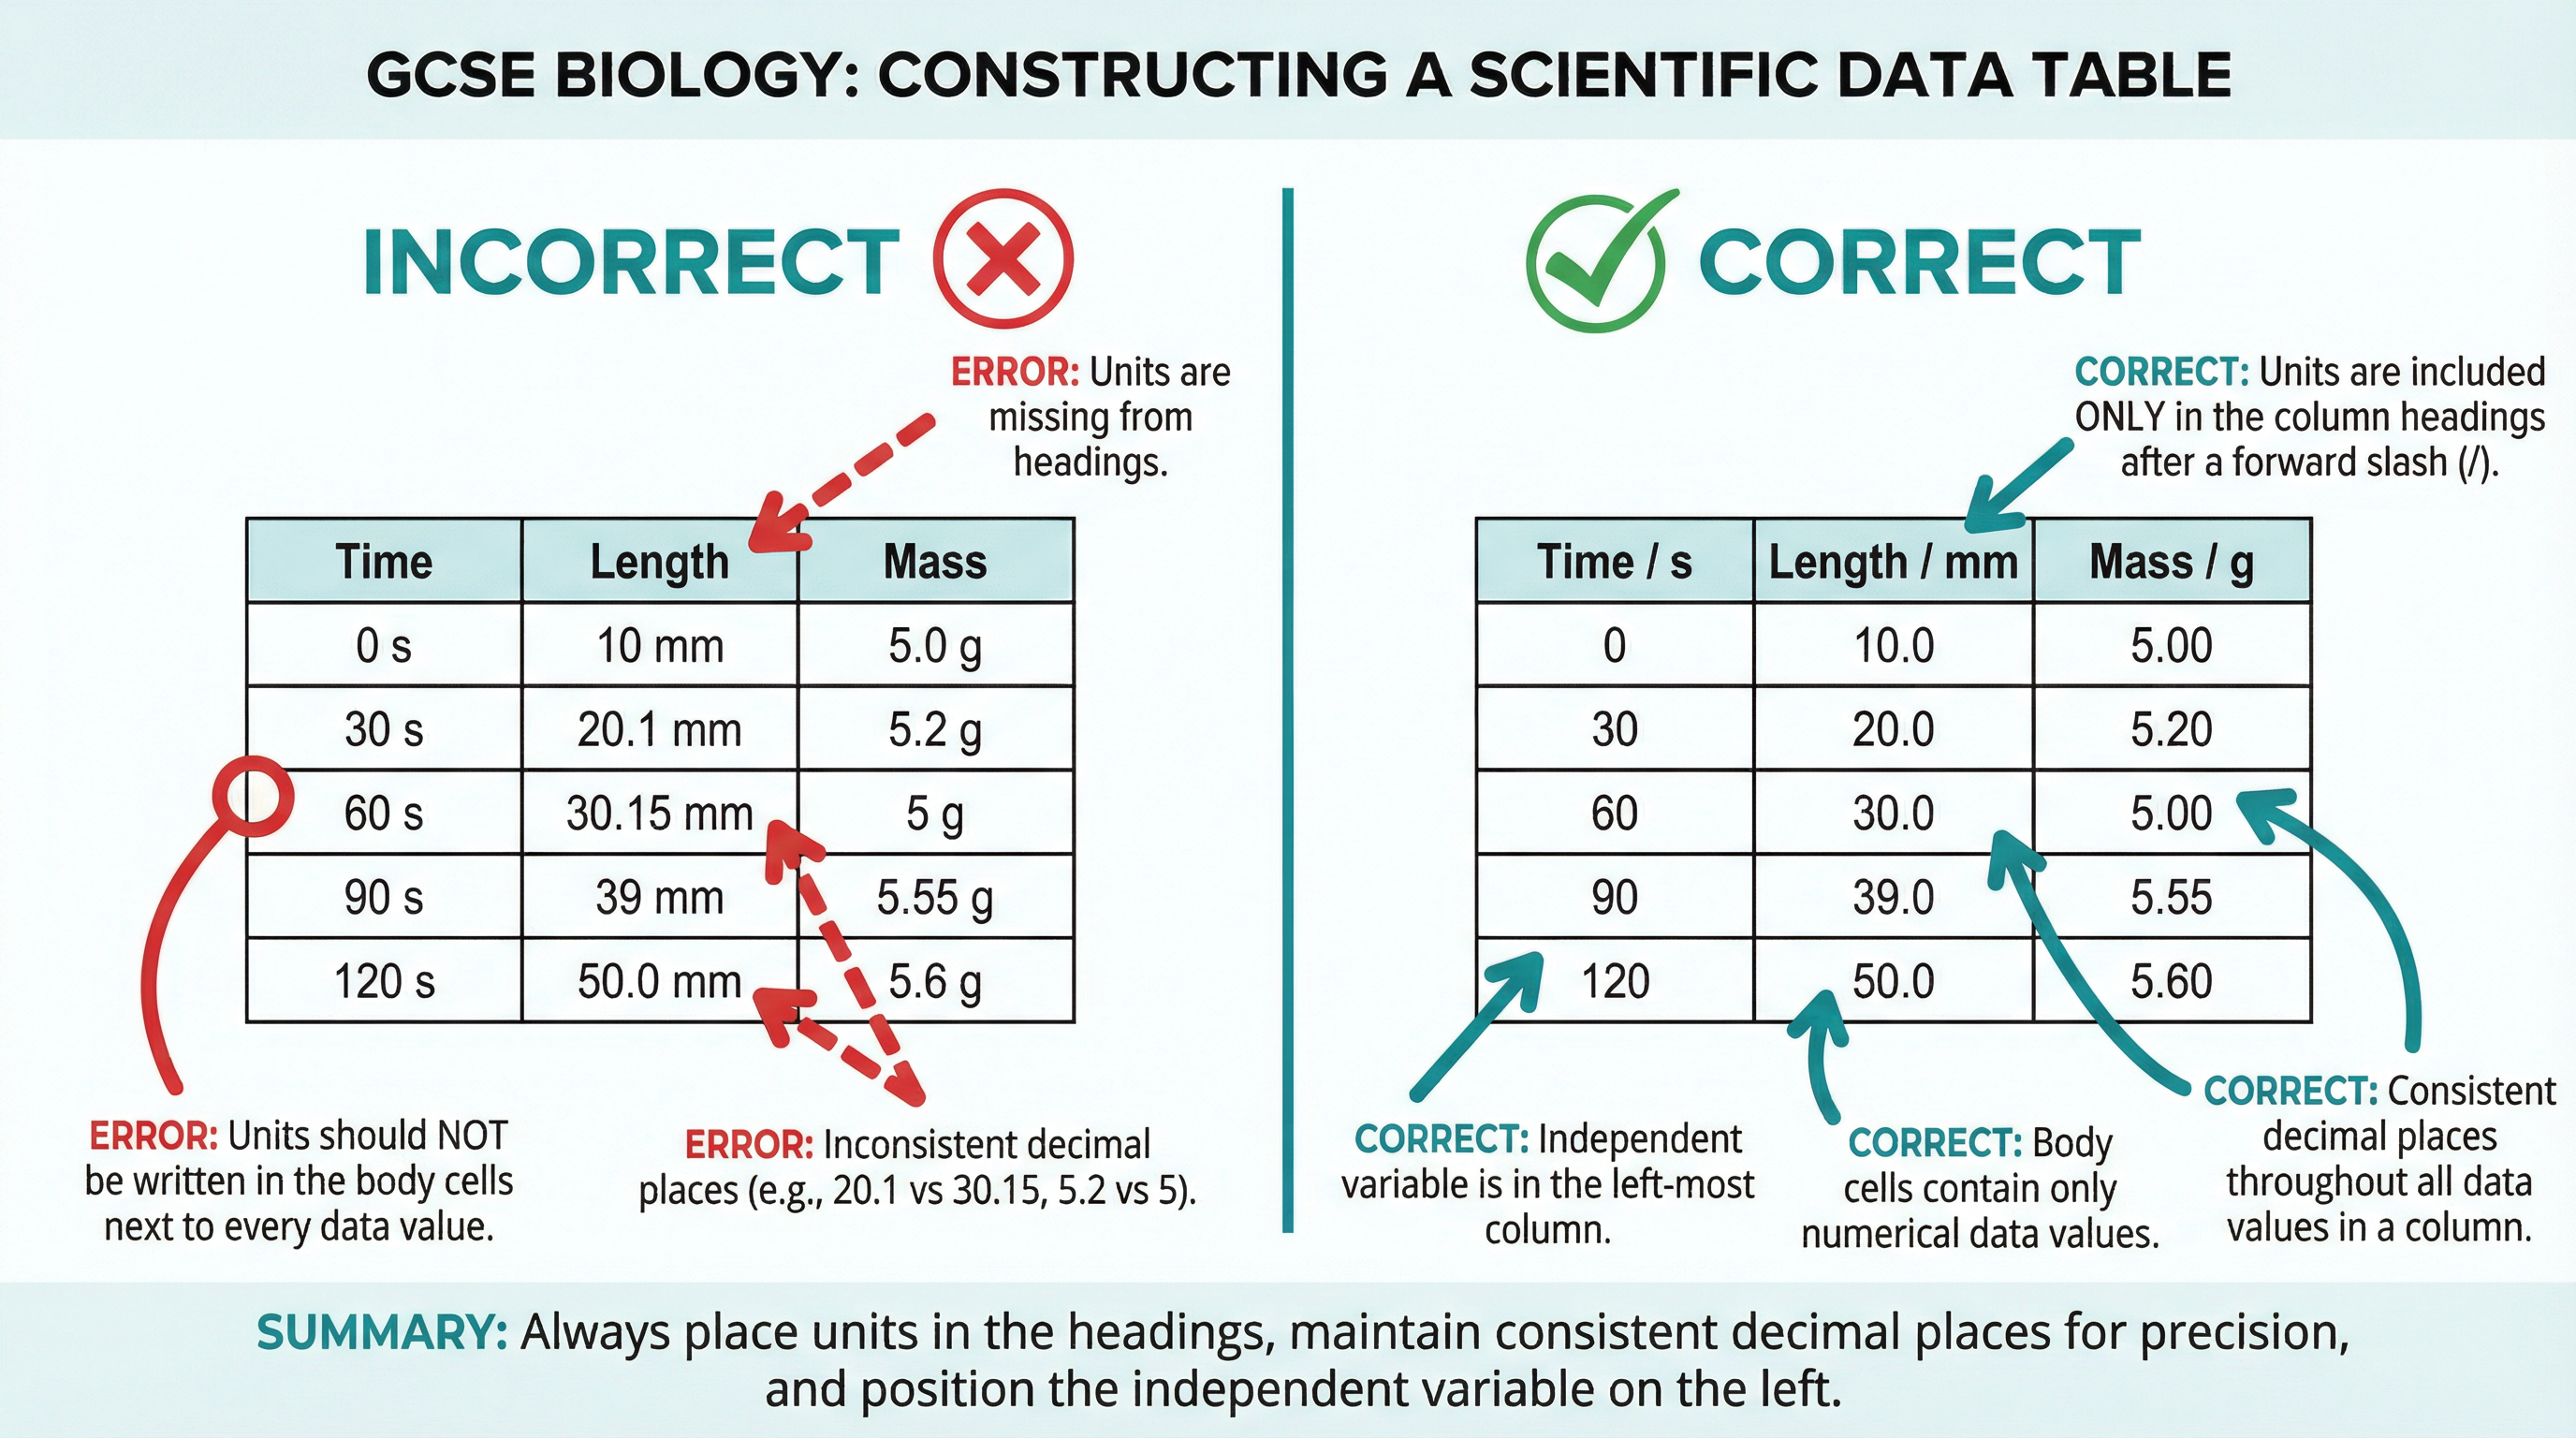
1. **Columns**: The independent variable goes in the first column on the left. The dependent variable(s) go in the columns to the right.
2. **Headings**: Every column must have a heading that includes both the quantity and the correct unit. These must be separated by a forward slash (e.g., `Time / s`) or have the unit in brackets (e.g., `Time (s)`). The forward slash is the preferred scientific convention.
3. **Units**: Units must *only* be in the column heading. Do not write units next to the numbers in the body of the table.
4. **Consistency**: All data in a single column must be recorded to the same number of decimal places, which should reflect the resolution of the measuring instrument.
### Concept 3: Accuracy, Precision, and Resolution
These terms are often confused, but they have distinct meanings in science.
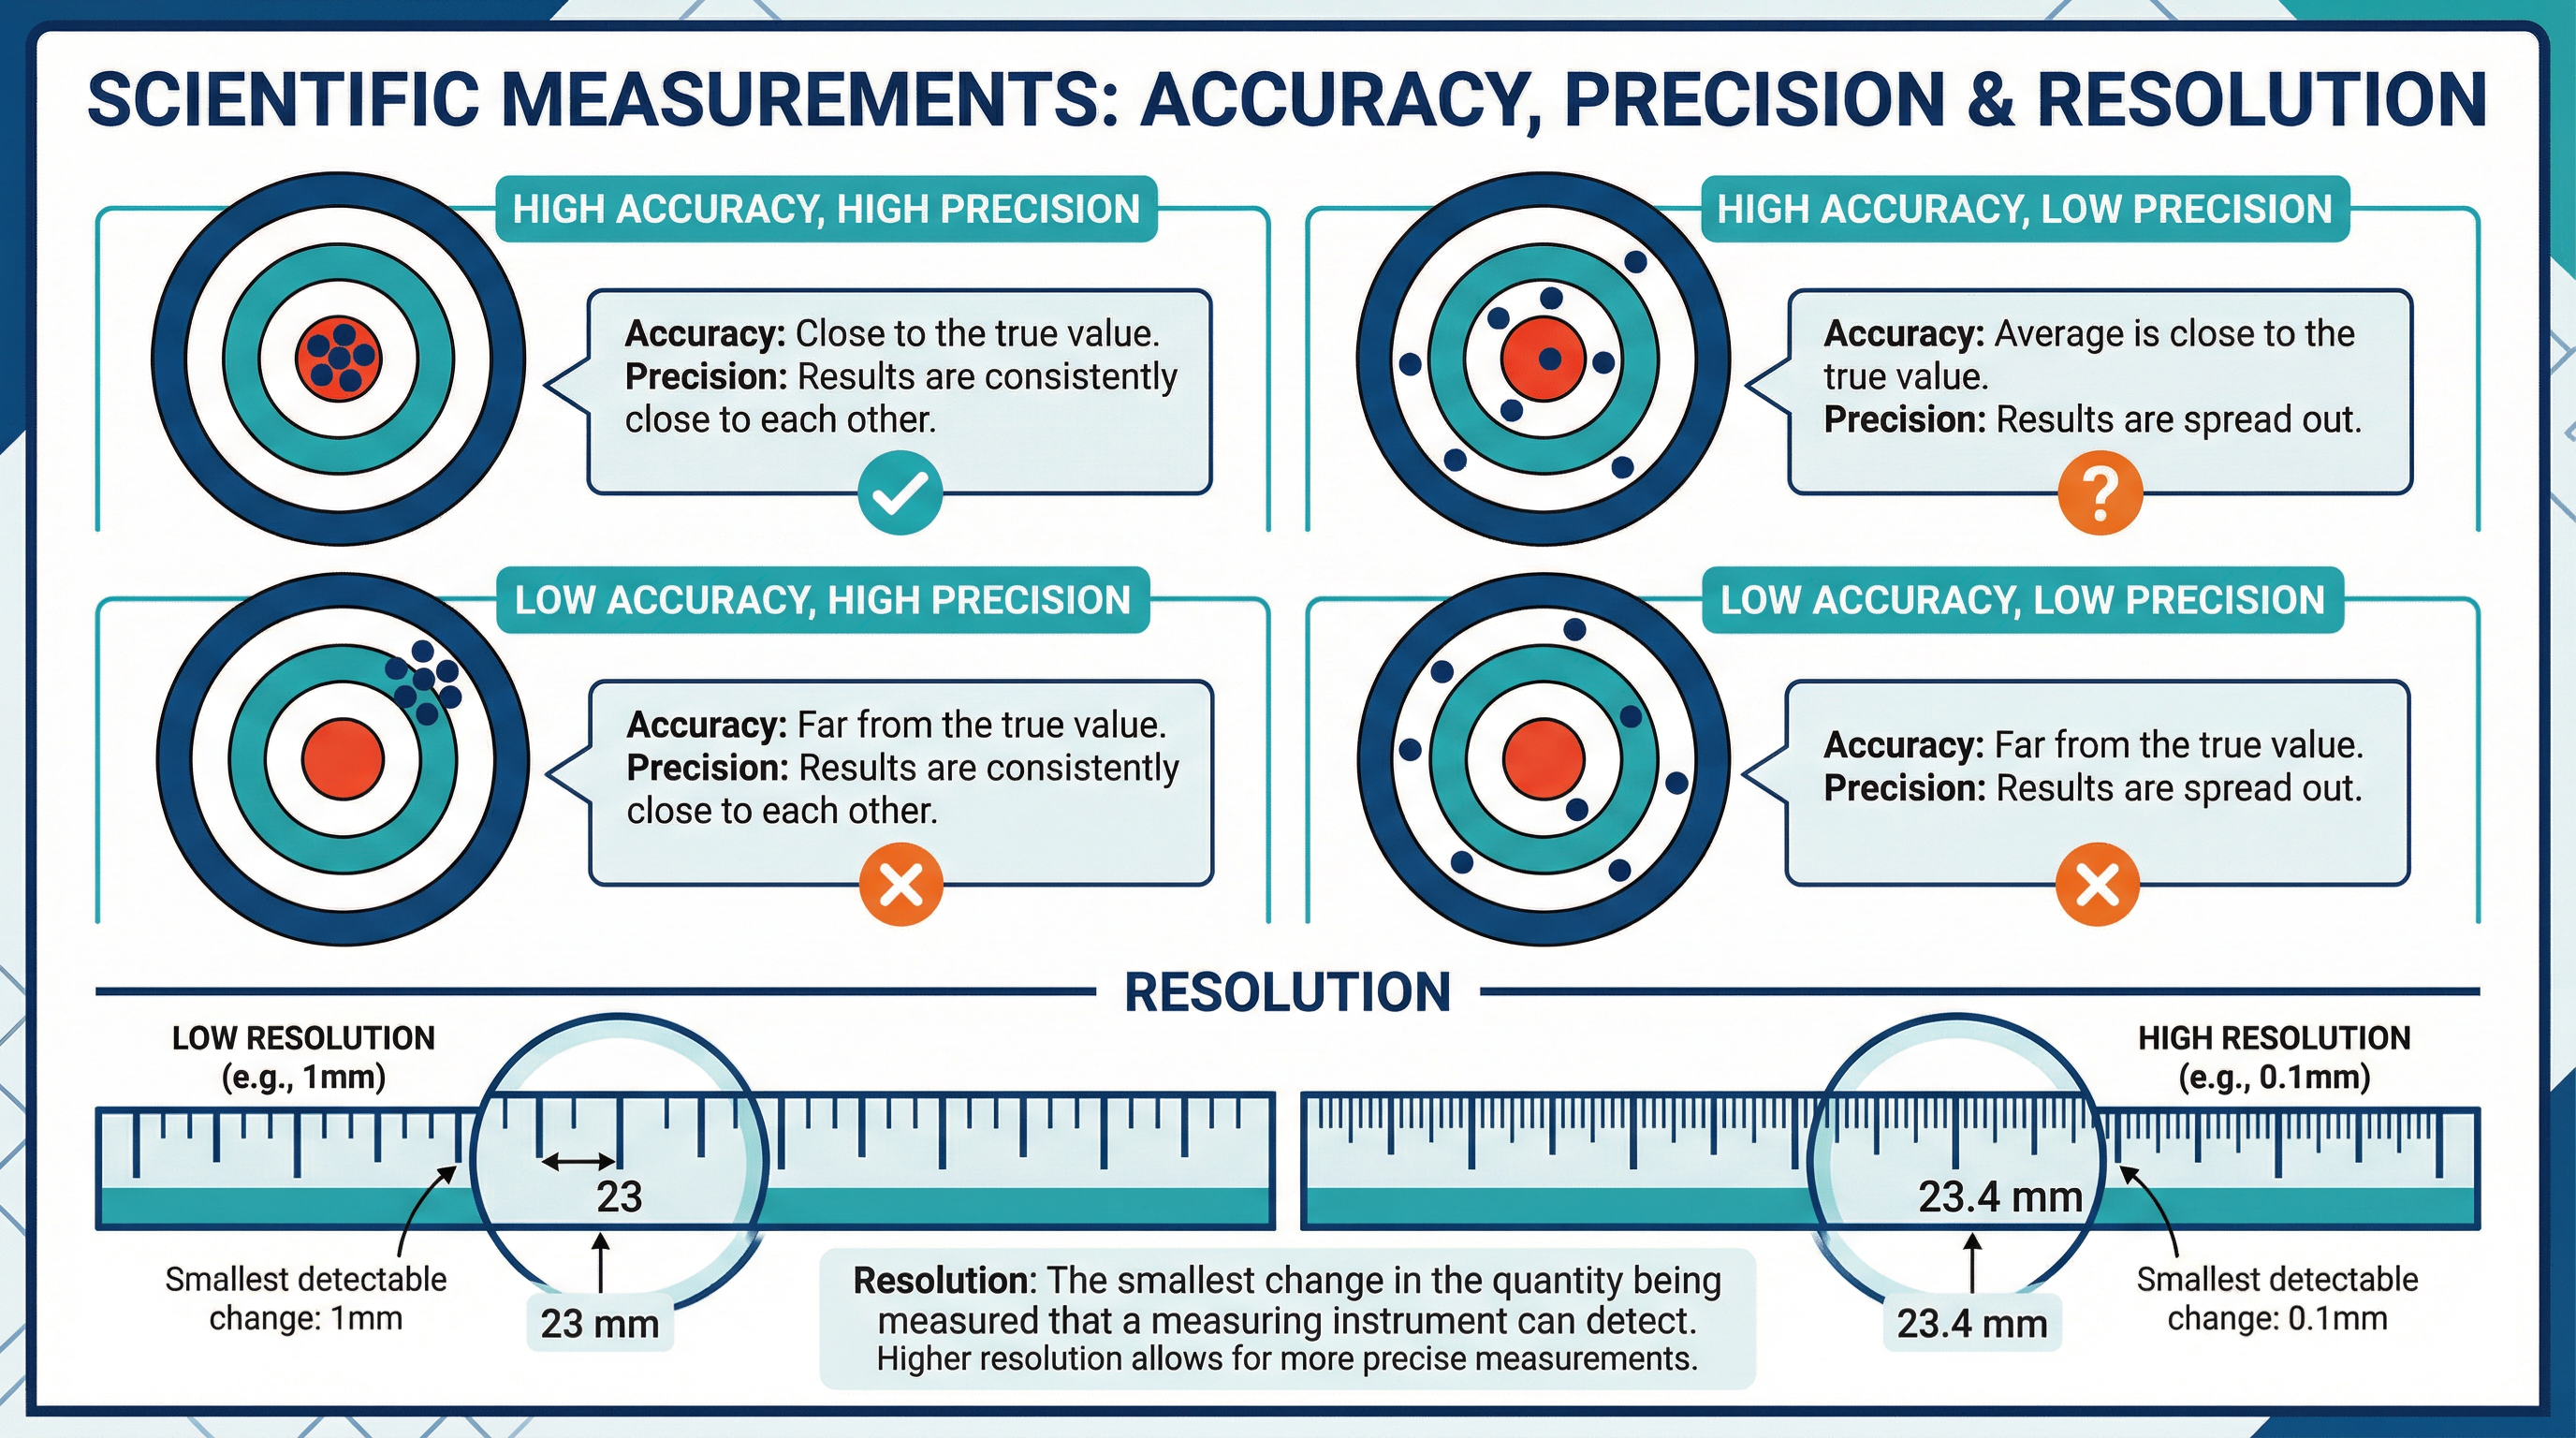
- **Accuracy**: How close a measurement is to the true, accepted value. Accuracy can be affected by systematic errors (e.g., a faulty instrument that always reads 2°C too high).
- **Precision**: How close repeated measurements are to each other. Precise results have very little spread. Precision is affected by random errors (e.g., fluctuations in conditions, misreading a scale).
- **Resolution**: The smallest change in a quantity that a measuring instrument can detect. For example, a ruler with millimetre markings has a resolution of 1 mm. A digital balance that reads to two decimal places (e.g., 12.54 g) has a resolution of 0.01 g.
### Concept 4: Repeatability and Reproducibility
These terms relate to the reliability of an experiment.
- **Repeatable**: An experiment is repeatable if the *same person* repeats the experiment using the *same method and equipment* and gets similar results.
- **Reproducible**: An experiment is reproducible if a *different person* gets similar results, or if the same person uses a *different method or equipment* and gets similar results. Reproducibility provides stronger evidence for a scientific conclusion.
## Mathematical/Scientific Relationships
### Calculating the Mean
The mean is the average of a set of numbers. It is used to get a more accurate estimate of the true value from a set of repeat readings.
**Formula**: Mean = Sum of all values / Number of values
**Important**: When calculating a mean from experimental data, you must first identify and **exclude any anomalous results**. An anomalous result (or outlier) is a reading that does not fit the pattern of the others and is likely due to an error. Including it in your calculation will produce an inaccurate mean.
## Practical Applications
### Required Practical: Field Investigations (Sampling)
Data collection skills are central to ecological fieldwork, such as investigating the distribution and abundance of organisms.
- **Apparatus**: Quadrat, tape measures, random number generator.
- **Method**: To avoid bias, sampling must be random. Lay out two tape measures at right angles along the sides of the area to create a grid. Use a random number generator to generate pairs of coordinates. Place the quadrat at these coordinates and count the number of organisms of interest (or estimate percentage cover). Repeat this process many times to get a representative sample of the area.
- **Common Errors**: Placing quadrats in areas that "look interesting" introduces bias. Not taking enough samples leads to an unrepresentative result.
- **Examiner Tip**: When asked how to ensure sampling is unbiased, the gold-standard answer is: "Use a random number generator to select coordinates for quadrat placement."

## Podcast Script
Welcome to the GCSE Biology Revision Podcast. I'm your tutor for today, and in this episode we're diving deep into Data Collection — that's topic 8.2 in the OCR GCSE Biology specification. Whether you're sitting Foundation or Higher tier, this topic comes up in every single paper in some form, so getting it right is absolutely worth your time. Grab a pen, because you'll want to take notes. Let's get started.
So, why does data collection matter so much in GCSE Biology? Well, the OCR exam board places a huge emphasis on what they call Working Scientifically skills. These are the skills that real scientists use every day — designing experiments, collecting data carefully, and analysing results honestly. In your exam, around 40 percent of your marks come from Assessment Objective 3, which is all about analysing, interpreting, and evaluating data. Another 45 percent comes from applying your knowledge — Assessment Objective 2. So together, that's 85 percent of your marks that depend on you being able to work with data confidently. Only 15 percent is pure recall. That tells you everything about what OCR wants to see.
Right, let's get into the core concepts. And we're going to start with the one that loses students the most marks, almost every single exam series — constructing a data table.
A well-constructed table is not just neat. It's a precise scientific communication tool. OCR examiners are looking for four specific things, and each one can earn you a mark.
First: the independent variable goes in the left-hand column. The independent variable is the one you deliberately change. So if you're investigating how temperature affects enzyme activity, temperature is your independent variable, and it goes on the left. The dependent variable — the one you measure — goes in the columns to the right.
Second: every column heading must include both the quantity AND the unit, separated by a forward slash. So not just "Temperature" — it must be "Temperature / degrees Celsius". Not just "Length" — it must be "Length / mm". The forward slash is the internationally recognised way of showing "per unit" in scientific notation. Some mark schemes also accept units in brackets, like "Length (mm)", but the forward slash is the safest bet for OCR.
Third: units must ONLY appear in the column heading. This is the mistake I see most often. Candidates write "10 mm" in the body of the table, then "20 mm", then "30 mm" — putting the unit next to every single data value. That's wrong. Once the unit is in the heading, the body of the table contains numbers only. Just 10, 20, 30. No units in the body.
Fourth: all data in a column must be recorded to a consistent number of decimal places. This is directly linked to the resolution of your measuring instrument. If you're using a ruler that measures to the nearest millimetre, your resolution is 1 mm, and you record whole numbers. If you're using a digital balance that reads to 0.01 grams, your resolution is 0.01 g, and every reading in that column must have two decimal places — even if the reading happens to be a round number. So if your balance reads 5 grams exactly, you write 5.00, not 5. If other values in the column are 5.23 and 4.87, then writing just 5 is inconsistent and you lose the mark. This trips up so many candidates.
Now let's talk about the key terminology around measurement quality. There are four terms you absolutely must know, and you must not confuse them. These are: accuracy, precision, resolution, and repeatability versus reproducibility.
Accuracy is about how close your result is to the true value. If the actual length of a leaf is 45 mm and you measure it as 44.8 mm, that's highly accurate. Accuracy is affected by systematic errors — things like a wrongly calibrated instrument, or always reading a scale from the wrong angle, which is called parallax error.
Precision is about how consistent your repeated measurements are with each other. If you measure the same leaf five times and get 44.8, 44.9, 44.8, 44.7, and 44.9, those results are very precise — they're clustered closely together. But notice — you can be precise without being accurate. If your ruler is incorrectly made and all your readings are consistently 2 mm too high, you'd get precise but inaccurate results.
Resolution is the smallest change that a measuring instrument can detect. A standard ruler has a resolution of 1 mm. A micrometer screw gauge has a resolution of 0.01 mm. A digital thermometer reading to one decimal place has a resolution of 0.1 degrees Celsius. Higher resolution means you can detect smaller differences, which generally improves the precision of your data. When a question asks you to suggest a better instrument for measuring something, think about resolution — and always justify your choice by saying it has a higher resolution.
Now, repeatability and reproducibility. These sound similar but mean very different things, and OCR examiners specifically test this distinction.
Repeatability means that the same person, using the same method and the same equipment, gets similar results when they repeat the experiment. If I measure the length of a bean seedling three times under the same conditions and get 23.1, 23.0, and 23.2 mm, my results are repeatable.
Reproducibility means that a different person, or the same person using a different method or different equipment, gets similar results. Reproducibility is a stronger claim — it means the finding is more likely to be a genuine scientific truth rather than a quirk of one particular setup.
Here's a memory hook for those two: think of it this way. Repeatable — same person, same method, Repeat. Reproducible — different person or method, Re-produce, as in someone else can produce the same result.
Now let's talk about anomalous results and means. An anomalous result — sometimes called an outlier — is a data point that doesn't fit the pattern of the other results. It's significantly different from the others and is likely caused by an experimental error, such as a misreading, a contaminated sample, or a disturbance during the experiment.
When you calculate a mean, you must exclude anomalous results. This is a specific marking point in OCR mark schemes. If you include the anomalous result in your mean, your average will be distorted and inaccurate. Always identify the anomaly first, exclude it, then calculate the mean from the remaining values.
For example: if your five repeat readings are 23, 24, 22, 38, and 23 — that value of 38 is clearly anomalous. Your mean should be calculated from 23, 24, 22, and 23 only, giving a mean of 23.
Let's move on to sampling. In ecology and fieldwork investigations, you often can't measure every single organism in an area. Instead, you take a sample. The key principle is that your sample must be random to avoid bias. If you choose where to place your quadrats by looking for areas that look interesting, you've introduced sampling bias and your results won't be representative of the whole area.
OCR specifically credits responses that mention using a random number generator to select coordinates for placing quadrats. So if a question asks how you would ensure your sampling is unbiased, say: "I would use a random number generator to produce pairs of coordinates, then place the quadrat at those coordinates." That's the answer that gets the mark.
Now, let's talk about selecting appropriate apparatus. A common exam question asks you to choose the best instrument for a particular measurement, or to explain why one instrument is better than another. The key factors to consider are: the range of the instrument — does it cover the values you expect to measure? The resolution — is it precise enough for your purpose? And the ease of reading — is it likely to introduce human error?
For measuring volume of liquids, a measuring cylinder is appropriate for larger volumes, but a burette or a syringe gives higher resolution for smaller volumes. For measuring length, a ruler is fine for centimetres and millimetres, but a micrometer is needed for very small structures. For measuring mass, a top-pan balance with two decimal places is more appropriate than a kitchen scale for biology experiments.
Right, we're now going to move into exam tips and common mistakes. This is where marks are won and lost.
Common mistake number one: writing units in the body of the table. I've already mentioned this, but it's so common it's worth repeating. Units go in the heading only. Never in the body cells.
Common mistake number two: inconsistent decimal places. If your instrument has a resolution of 0.1, every value in that column needs one decimal place. Even whole numbers. Write 10.0, not 10.
Common mistake number three: confusing accuracy and precision. Remember: accuracy is about closeness to the true value. Precision is about consistency of repeated measurements. These are not the same thing.
Common mistake number four: confusing repeatable and reproducible. Repeatable is same person, same method. Reproducible is different person or method.
Common mistake number five: including the anomalous result in the mean. Always exclude it. State that you're excluding it, and why.
Common mistake number six: when asked how to improve data collection, candidates often write "repeat the experiment" or "do it again." That's too vague and won't earn marks. Instead, say: "take more readings at narrower intervals to identify patterns more clearly." That's the specific phrase OCR rewards.
Now, a word on command words. These are the words at the start of a question that tell you what kind of answer is expected.
"State" or "Give" — these want a short, factual answer. One or two words, or a brief phrase. No explanation needed.
"Describe" — say what you observe or what happens. Use correct scientific terminology. Don't explain why — just describe what.
"Explain" — this is where you must give a reason. Use the word "because" to link your observation to the cause. For example: "The mean is lower because the anomalous result was excluded."
"Evaluate" — consider evidence on both sides, then make a judgement. Don't just list positives or just list negatives.
"Calculate" — show your working, use the correct formula, include units in your answer.
Now let's do a quick-fire recall quiz. Cover your notes if you can, and try to answer each question before I give the answer. Ready?
Question one: Where does the independent variable go in a data table? Answer: In the left-hand column.
Question two: Where should units appear in a data table? Answer: In the column heading only, separated from the quantity by a forward slash.
Question three: What is the difference between accuracy and precision? Answer: Accuracy is how close a result is to the true value. Precision is how consistent repeated measurements are with each other.
Question four: What is resolution? Answer: The smallest change that a measuring instrument can detect.
Question five: What is the difference between repeatable and reproducible? Answer: Repeatable means the same person gets similar results using the same method. Reproducible means a different person or method gives similar results.
Question six: What should you do with an anomalous result when calculating a mean? Answer: Exclude it from the calculation.
Question seven: How should you ensure random sampling when placing quadrats? Answer: Use a random number generator to generate coordinate pairs.
How did you do? If you got all seven, you're in great shape. If you missed a few, go back and review those specific concepts.
Let's wrap up with a quick summary of the most important points to take away from this episode.
One: In a data table, the independent variable is always in the left column, and the dependent variable is to the right.
Two: Units belong only in column headings, written as "Quantity / unit" — never in the body of the table.
Three: All data in a column must be recorded to the same number of decimal places, matching the resolution of the instrument used.
Four: Accuracy is closeness to the true value. Precision is consistency of repeated results. Resolution is the smallest detectable change.
Five: Repeatable means same person, same method. Reproducible means different person or method.
Six: Always exclude anomalous results before calculating a mean.
Seven: Use a random number generator for unbiased sampling in fieldwork.
Eight: When asked to improve data collection, say "take more readings at narrower intervals" — not just "repeat the experiment."
That's it for today's episode. You've covered everything OCR expects for Data Collection in topic 8.2. Remember, these Working Scientifically skills appear across all your biology papers, so the time you invest here pays dividends throughout your entire exam. Good luck with your revision — you've got this. See you in the next episode."