OCR · GCSE · Biology
Planning Experiments
Master the art of planning experiments for your OCR GCSE Biology exam. This guide breaks down how to secure top marks in AO3-heavy questions by mastering variables, method design, and data analysis, turning a tricky topic into guaranteed marks.
- 6 min read
- 3 worked examples
- 5 practice questions
- 6 key terms
Study Notes

Overview
Planning a scientific investigation is a cornerstone of biology and a skill that OCR examiners test rigorously, dedicating up to 60% of marks on this topic to Assessment Objective 3 (AO3). This means your ability to design, justify, and evaluate experiments is more important than ever. This guide will equip you with a foolproof framework for tackling 6-mark planning questions, ensuring you can confidently identify variables, select appropriate apparatus, and structure a method that is precise, reliable, and valid. We will move beyond simply describing steps to justifying choices, a key differentiator for top-band candidates. This topic has strong synoptic links to all Practical Activity Groups (PAGs), from enzyme kinetics (Topic 2.6) to photosynthesis (Topic 5.1), as the core principles of experimental design are universal.
Key Concepts
Concept 1: Variables - The Heart of the Investigation
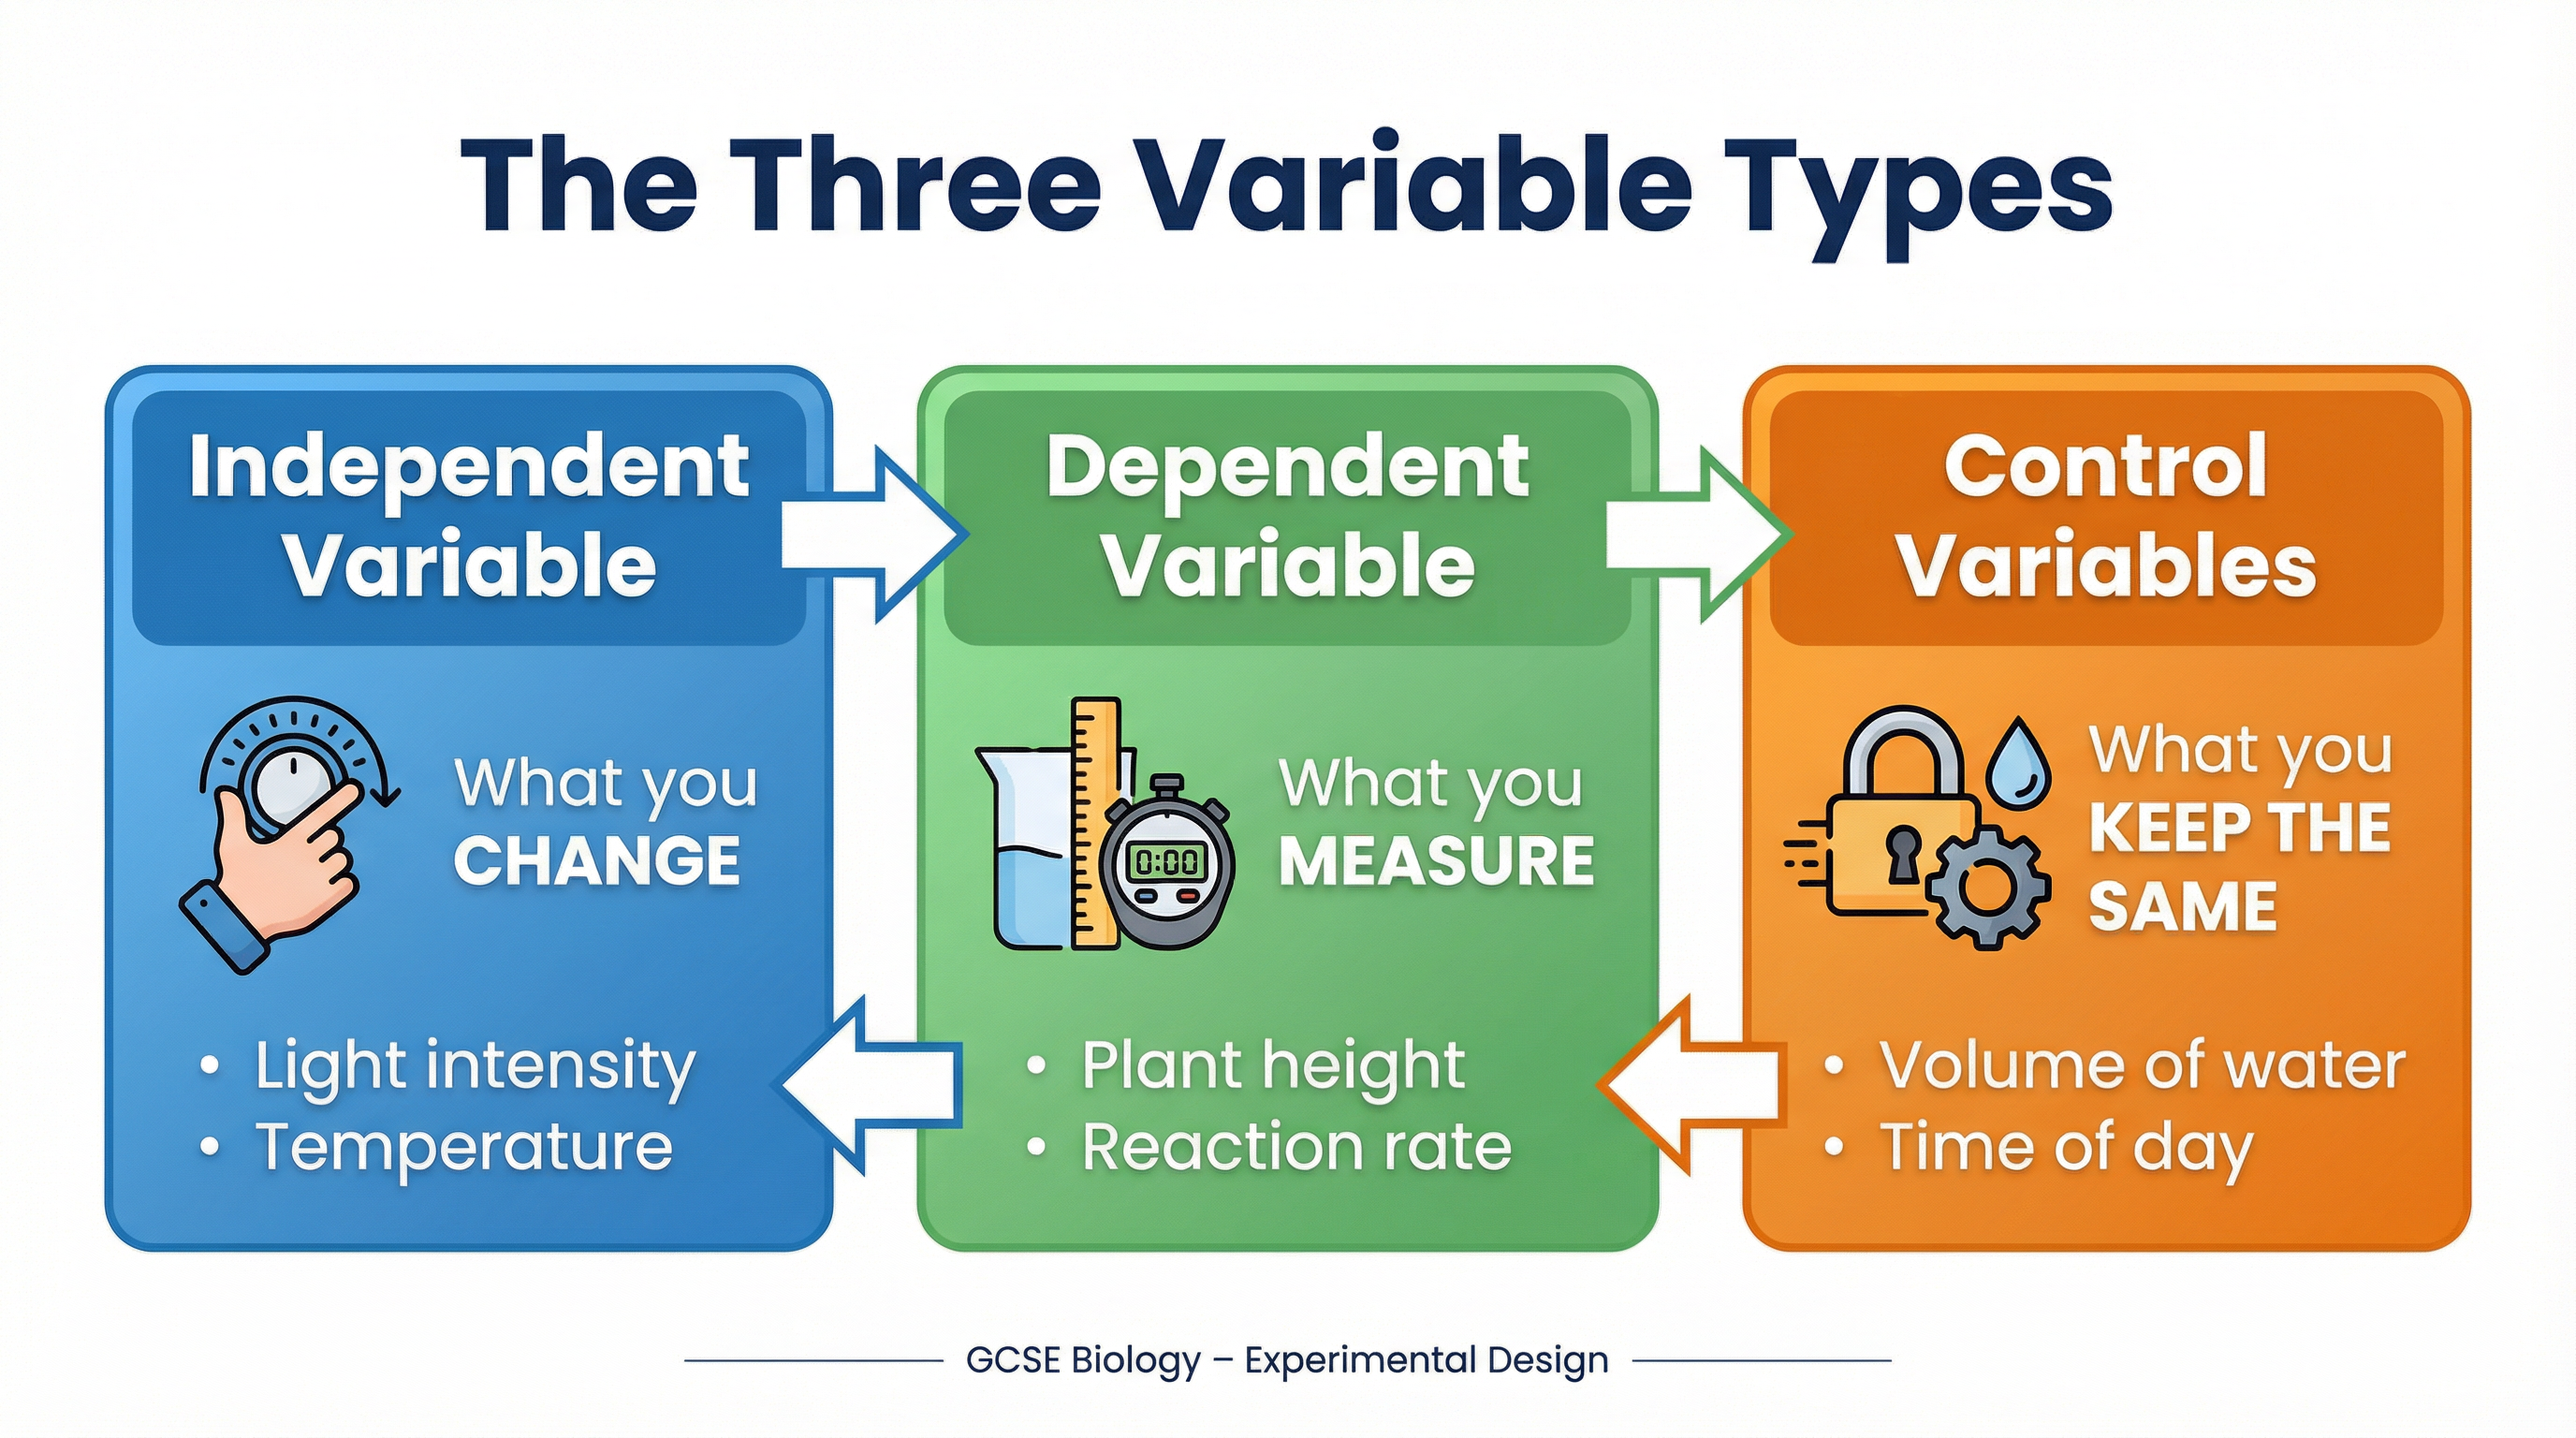
At the core of any experiment is the relationship between variables. Failing to identify and control these properly is the most common reason candidates lose marks. There are three types you must know intimately.
- Independent Variable (IV): This is the one and only factor you deliberately change to see what effect it has. You are the investigator, and you decide the values. For example, when investigating the effect of light intensity on the rate of photosynthesis, the light intensity (e.g., measured in lux or by distance from a lamp) is your IV.
- Dependent Variable (DV): This is the factor you measure to see the effect of changing the IV. Its value depends on the IV. In the photosynthesis example, the DV would be the rate of reaction, which could be measured by counting the number of oxygen bubbles produced per minute or, for higher precision, by collecting the volume of oxygen in a gas syringe over a set time.
- Control Variables (CVs): These are all the other factors that could potentially affect the outcome of your experiment. To ensure a fair test, you must keep these constant. If you don't, you won't know if your results are due to the change in the IV or something else. For the photosynthesis experiment, key CVs would include the temperature (kept constant with a water bath), the concentration of carbon dioxide solution, and the species and size of the pondweed.

Examiner Tip: It is not enough to simply list control variables. To gain credit, you must state how you will control them. For example, instead of just writing 'temperature', a top-level answer would state, 'Maintain the temperature at 25°C using a thermostatically controlled water bath.'
Concept 2: The VAMRA Framework for 6-Mark Questions
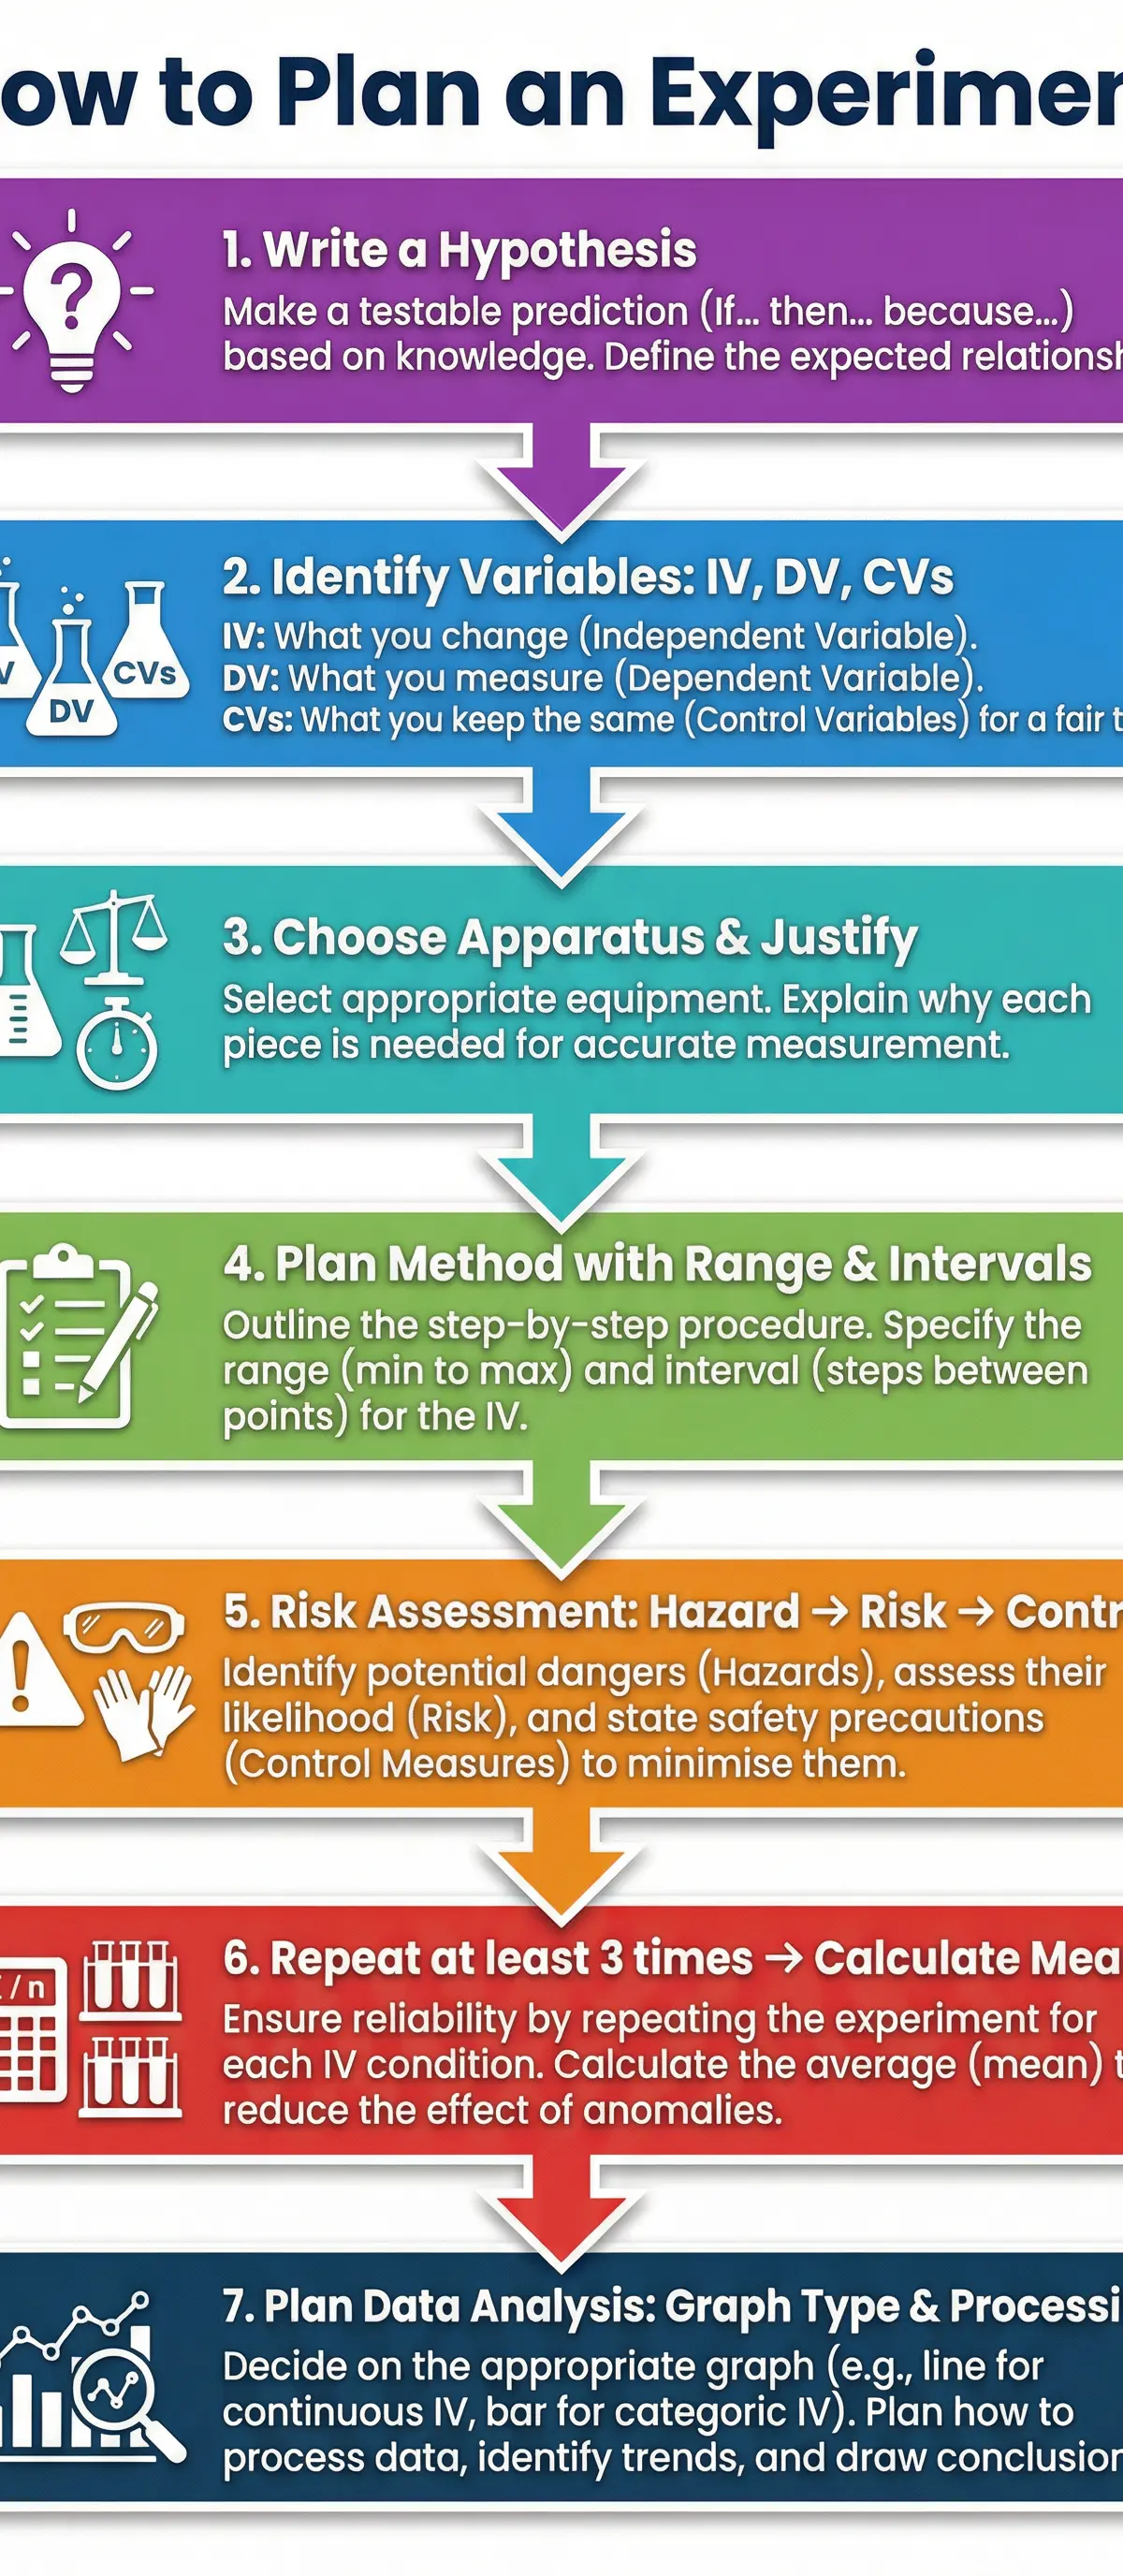
When faced with a question asking you to 'Plan an investigation...', use the VAMRA acronym to structure your response. This ensures you cover all the key areas an examiner is looking for.
- Variables: Start by explicitly stating your IV, DV, and at least two specific CVs.
- Apparatus: List the key pieces of equipment needed and, crucially, justify your choices based on their resolution and precision. For example, 'Use a gas syringe to measure the volume of gas produced as it has a higher resolution (e.g., to the nearest 0.1 cm³) than counting bubbles, leading to more precise results.'
- Method: Provide a clear, step-by-step procedure. This must include a specified range and intervals for your IV (e.g., 'Test at least 5 different temperatures from 10°C to 50°C at 10°C intervals'). You must also state that the experiment will be repeated at least three times at each IV value to calculate a mean and identify/remove any anomalies. This demonstrates an understanding of reliability.
- Risk Assessment: Identify a specific hazard, describe the associated risk, and state a practical control measure. For example: Hazard - Bunsen burner. Risk - Burns to skin. Control - Tie hair back, keep flammable materials away, use a heatproof mat.
- Analysis: Explain how you will process your results. State the type of graph you will plot (e.g., a line graph for continuous data) and label the axes (IV on the x-axis, DV on the y-axis). Mention calculating the mean and rate of reaction.
Concept 3: Accuracy, Precision, and Reliability
These terms are often confused, but they have distinct meanings that examiners want to see used correctly.
- Accuracy: How close a measurement is to the true value. Using calibrated equipment improves accuracy.
- Precision: How close repeat measurements are to each other. Using apparatus with a high resolution (more decimal places) allows for greater precision.
- Reliability: The extent to which an experiment can be repeated by different people and give the same results. Repeating the experiment and calculating a mean improves the reliability of the conclusion.
Mathematical/Scientific Relationships
Calculating the Rate of Reaction
This is a common calculation required in many PAGs. The formula is fundamental:
Rate = Change in Dependent Variable / Time
- Example: If 5 cm³ of oxygen gas is collected in 30 seconds, the rate is 5 cm³ / 30 s = 0.167 cm³/s. Candidates must show their working and include the correct units.
Unit Conversions
A frequent source of lost marks is incorrect unit conversion. You must be fluent in these:
- Mass: 1 gram (g) = 1000 milligrams (mg)
- Volume: 1 litre (L) = 1000 millilitres (ml) = 1000 cm³
- Length: 1 metre (m) = 100 centimetres (cm) = 1000 millimetres (mm)
Practical Applications
This topic directly relates to all Practical Activity Groups (PAGs). For example, in PAG 1 (Microscopy), you might plan an investigation into how the concentration of a salt solution affects the cells in an onion epidermis. You would need to control the temperature and time the cells are left in the solution, while changing the salt concentration (IV) and observing the degree of plasmolysis (DV). In PAG 5 (Photosynthesis), you would apply these principles to investigate light intensity, CO₂ concentration, or temperature, measuring the rate of oxygen production.
Visual Resources
2 diagrams and illustrations
Interactive Diagrams
2 interactive diagrams to visualise key concepts
Conceptual Flow Outline
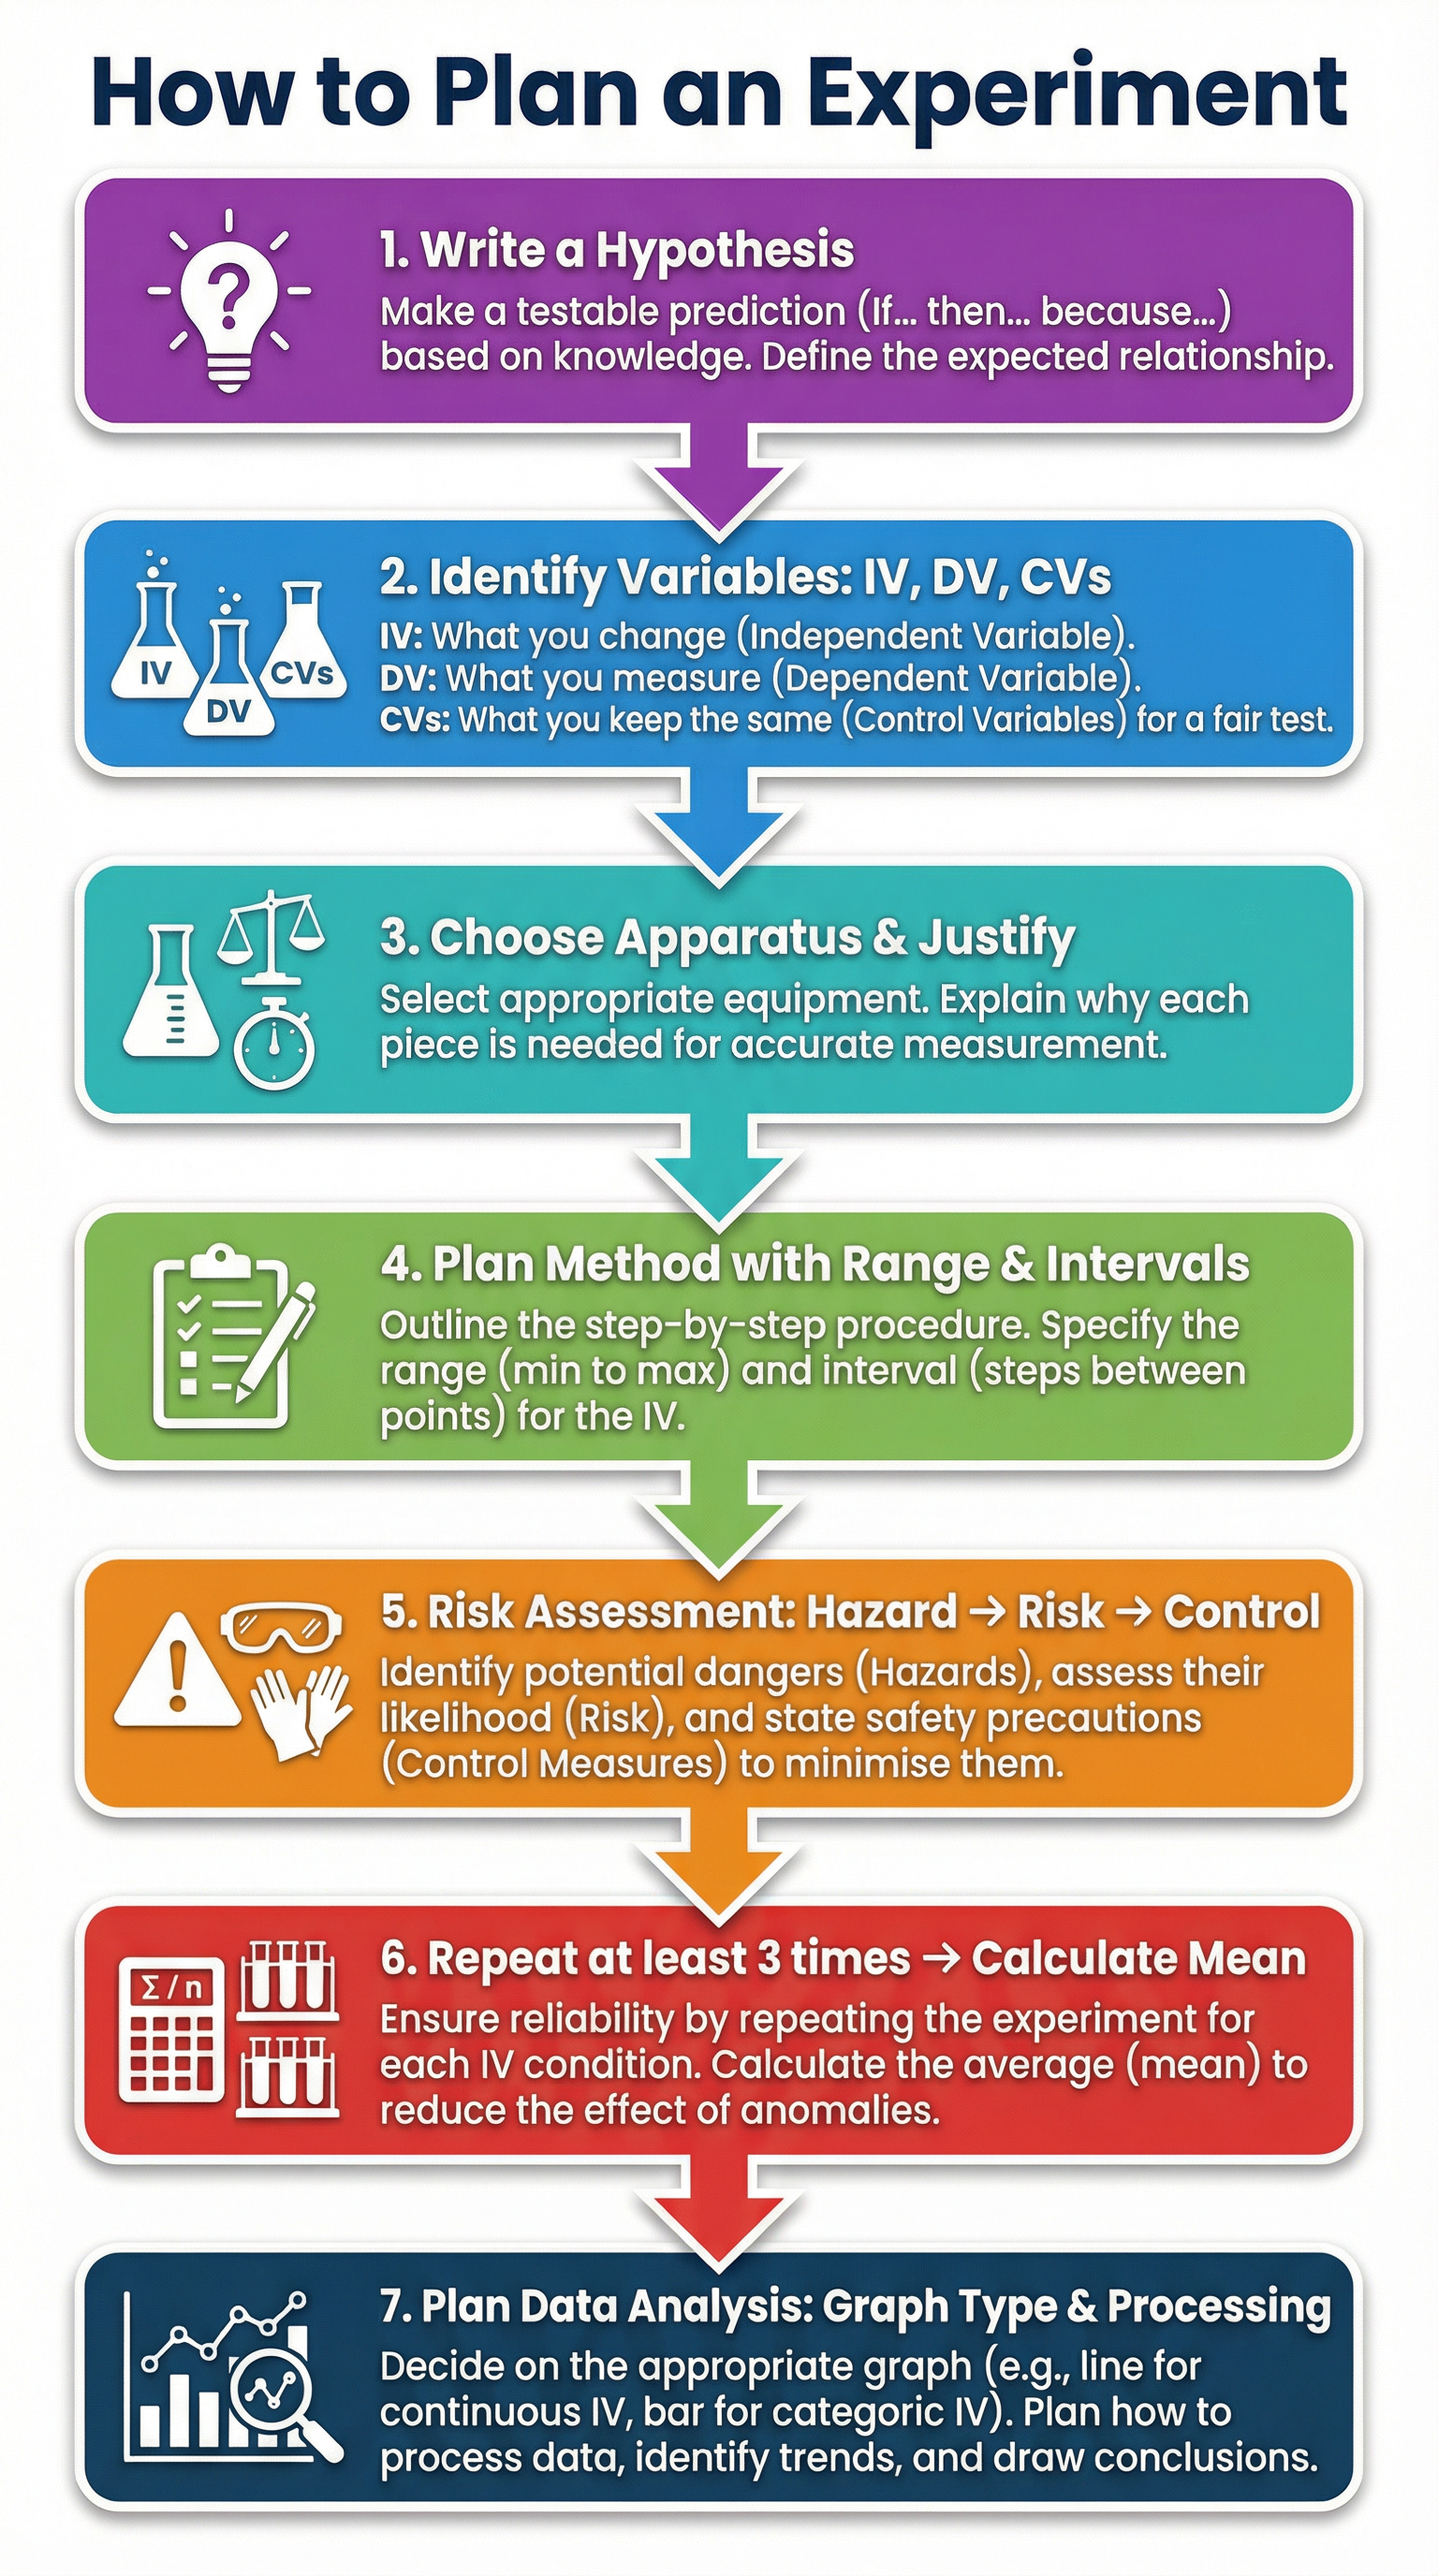
A flowchart showing the logical sequence of steps when planning a scientific investigation, from hypothesis to conclusion.
Conceptual Flow Outline
A concept map illustrating the relationship between variables in a fair test. The Independent Variable is the only factor changed to see its effect on the Dependent Variable, while all Control Variables are held constant.
Worked Examples
3 worked examples — open one to explore the question and available guidance.
Practice Questions
Test your understanding — click to reveal model answers
A student investigated the effect of substrate concentration on the rate of an enzyme-catalysed reaction. State the independent, dependent, and one control variable for this investigation.
Hint: Think about what is being changed, what is being measured, and what must be kept the same for a fair test.
When investigating the effect of light intensity on photosynthesis, a student counts the bubbles produced by pondweed. Describe two ways the student could make the measurement of the dependent variable more precise.
Hint: Counting bubbles can be inaccurate. How could you collect the gas produced instead? How could you make the timing more reliable?
Evaluate the following plan to investigate the effect of temperature on the rate of photosynthesis. 'I will set up a beaker of pondweed at 10°C and 50°C. I will shine a lamp on it and count the bubbles produced for one minute. I will then plot a graph.'
Hint: Use the VAMRA framework to identify what is missing or poorly described in this plan.
A risk assessment for an experiment using acid states: 'Hazard: Acid, Risk: It's dangerous, Control: Be careful.' Explain why this risk assessment would not be awarded any marks.
Hint: A good risk assessment is specific. Compare the student's vague statements to what an examiner would expect.
When planning an experiment, why is it important to specify a range of at least five values for the independent variable?
Hint: Think about what a graph with only two points would look like compared to one with five.