Subject: Business | Level: GCSE | Exam Board: AQA
Mastering financial performance analysis is the key to unlocking top grades in GCSE Business. This guide demystifies the Income Statement and Statement of Financial Position, showing you exactly how to calculate profitability and interpret data like a senior examiner.
Revision Notes & Key Concepts
Revision Podcast Transcript
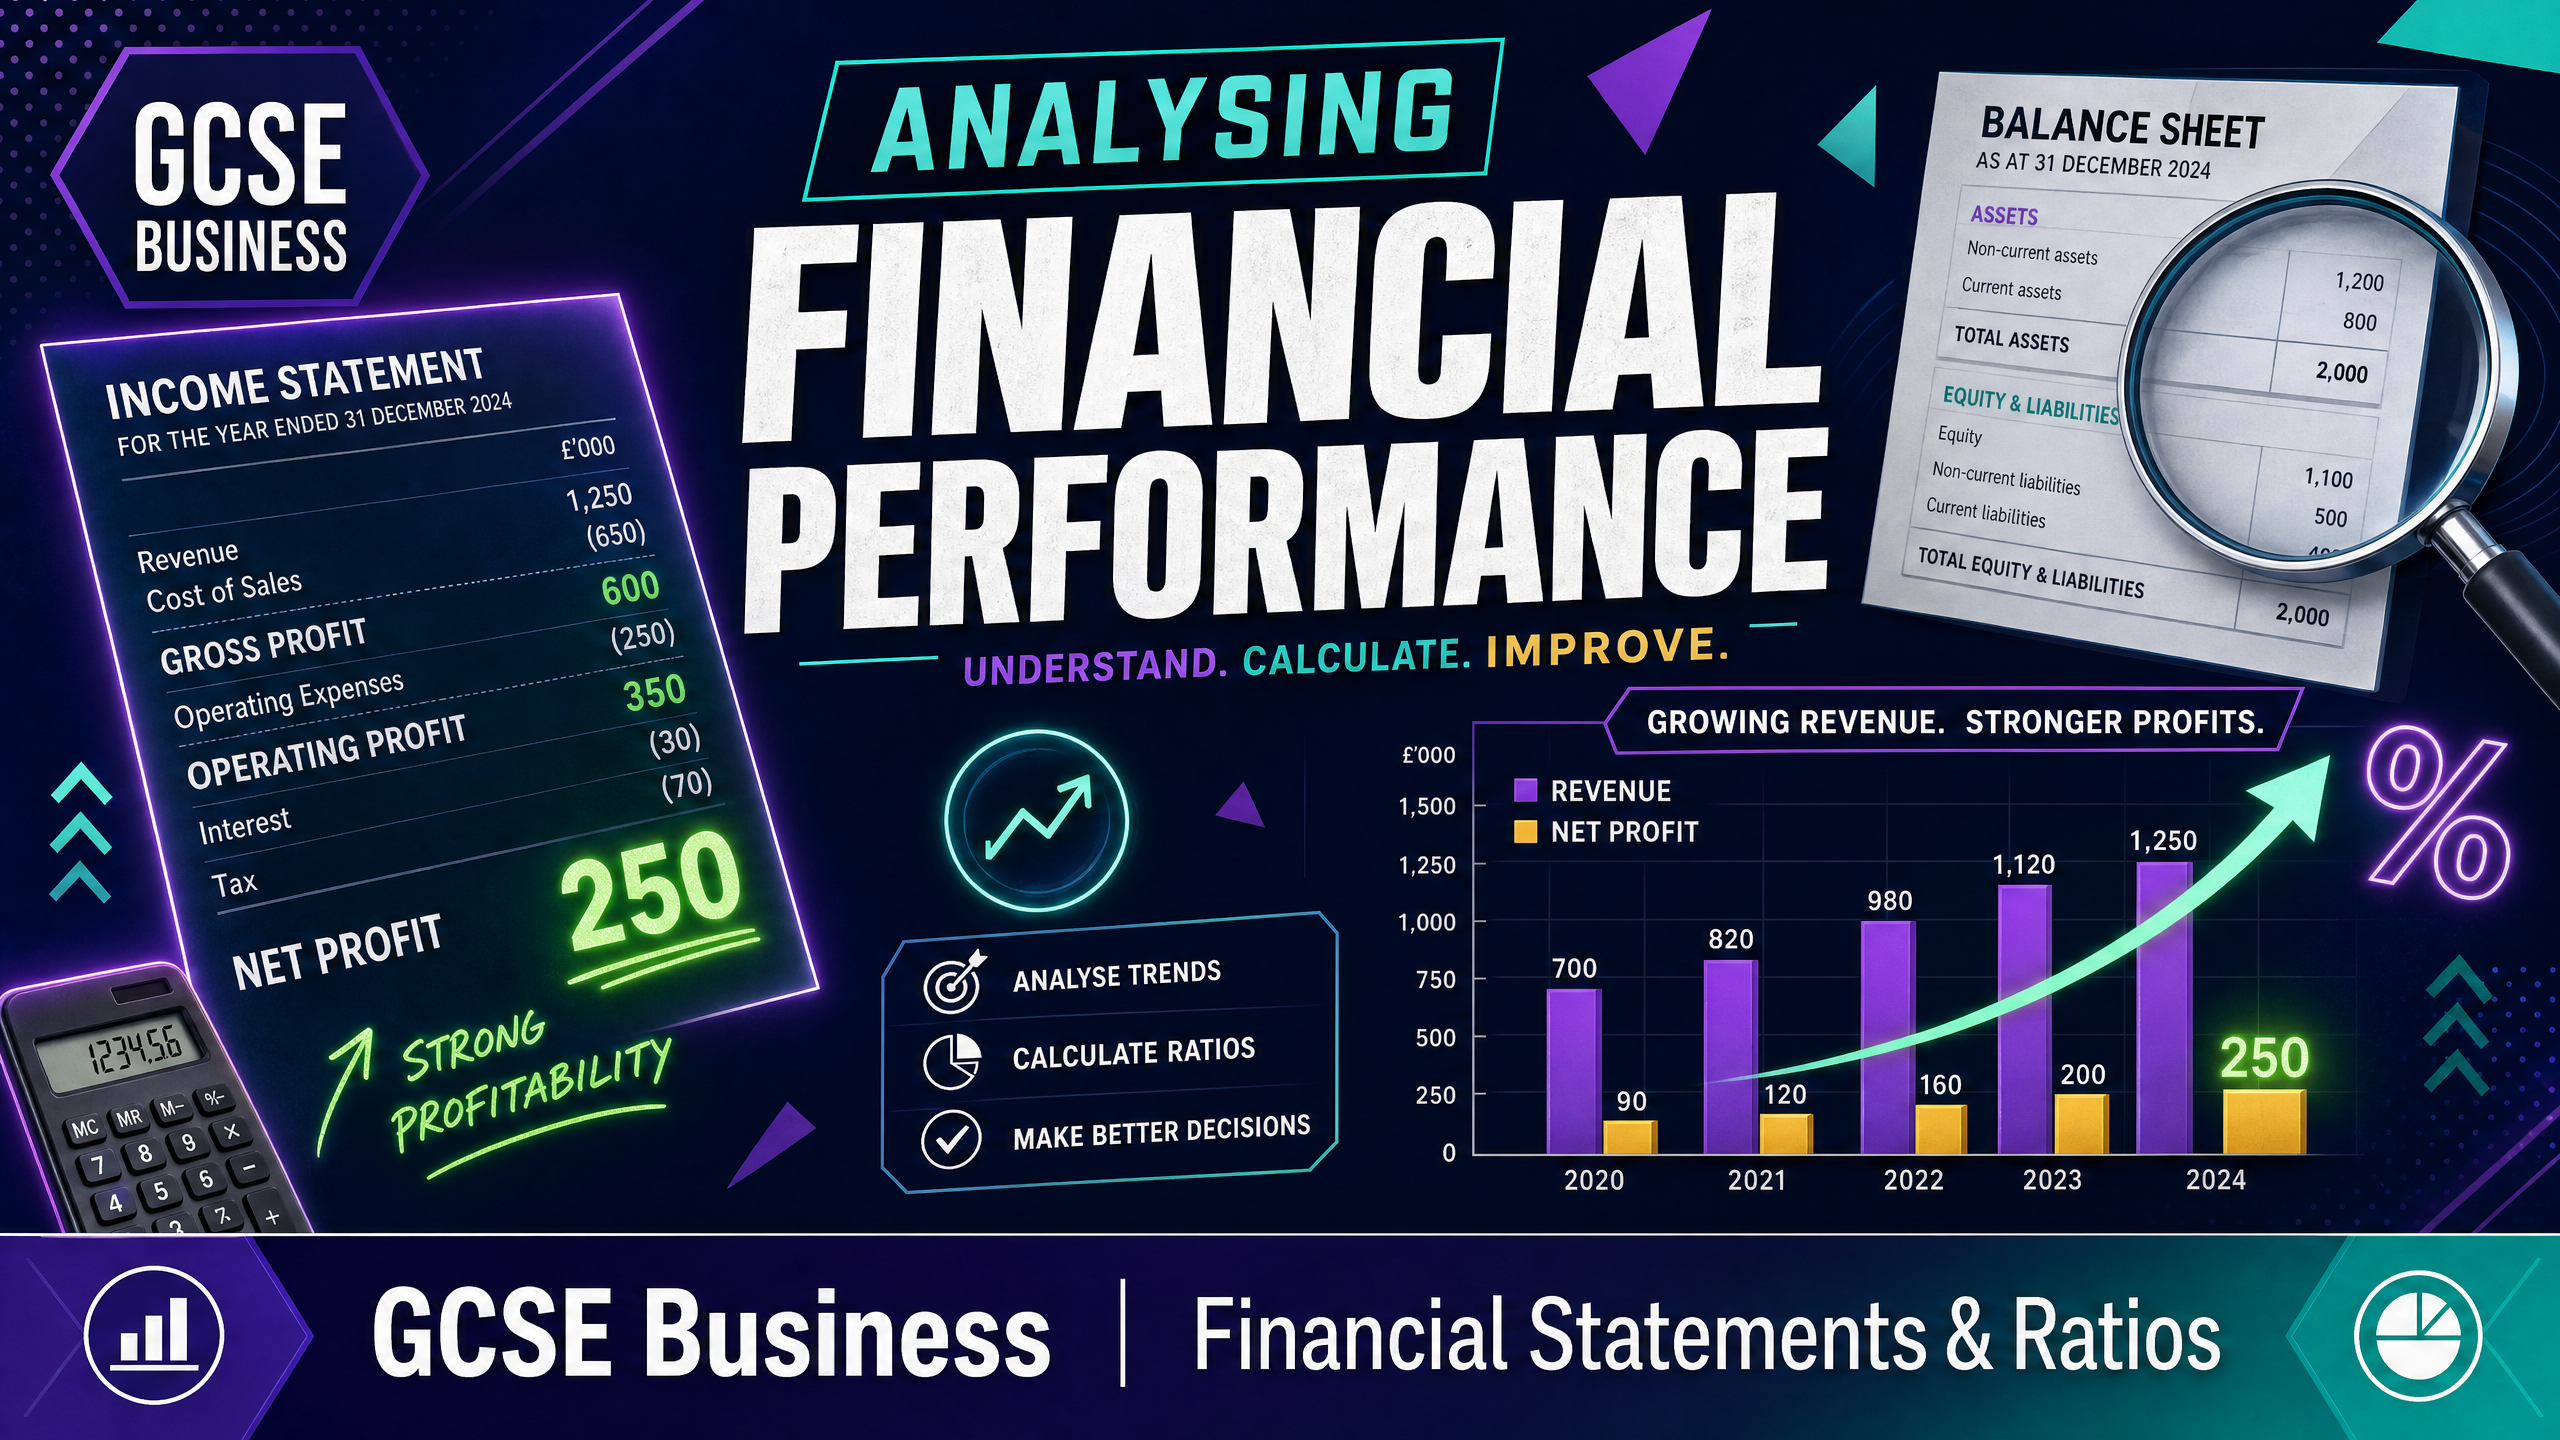
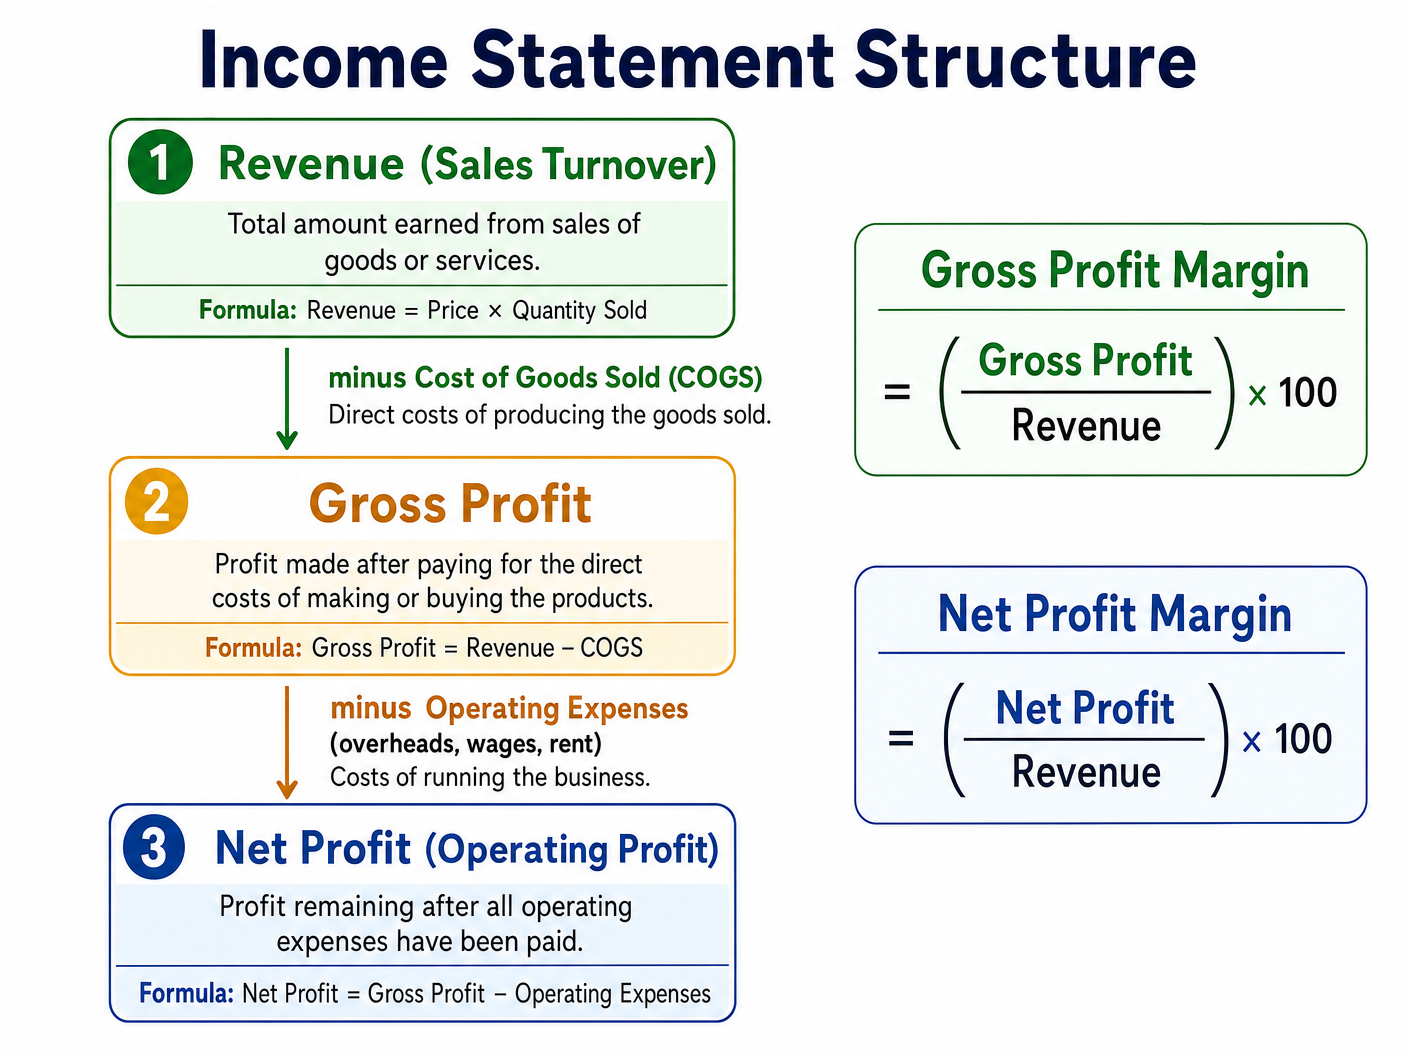
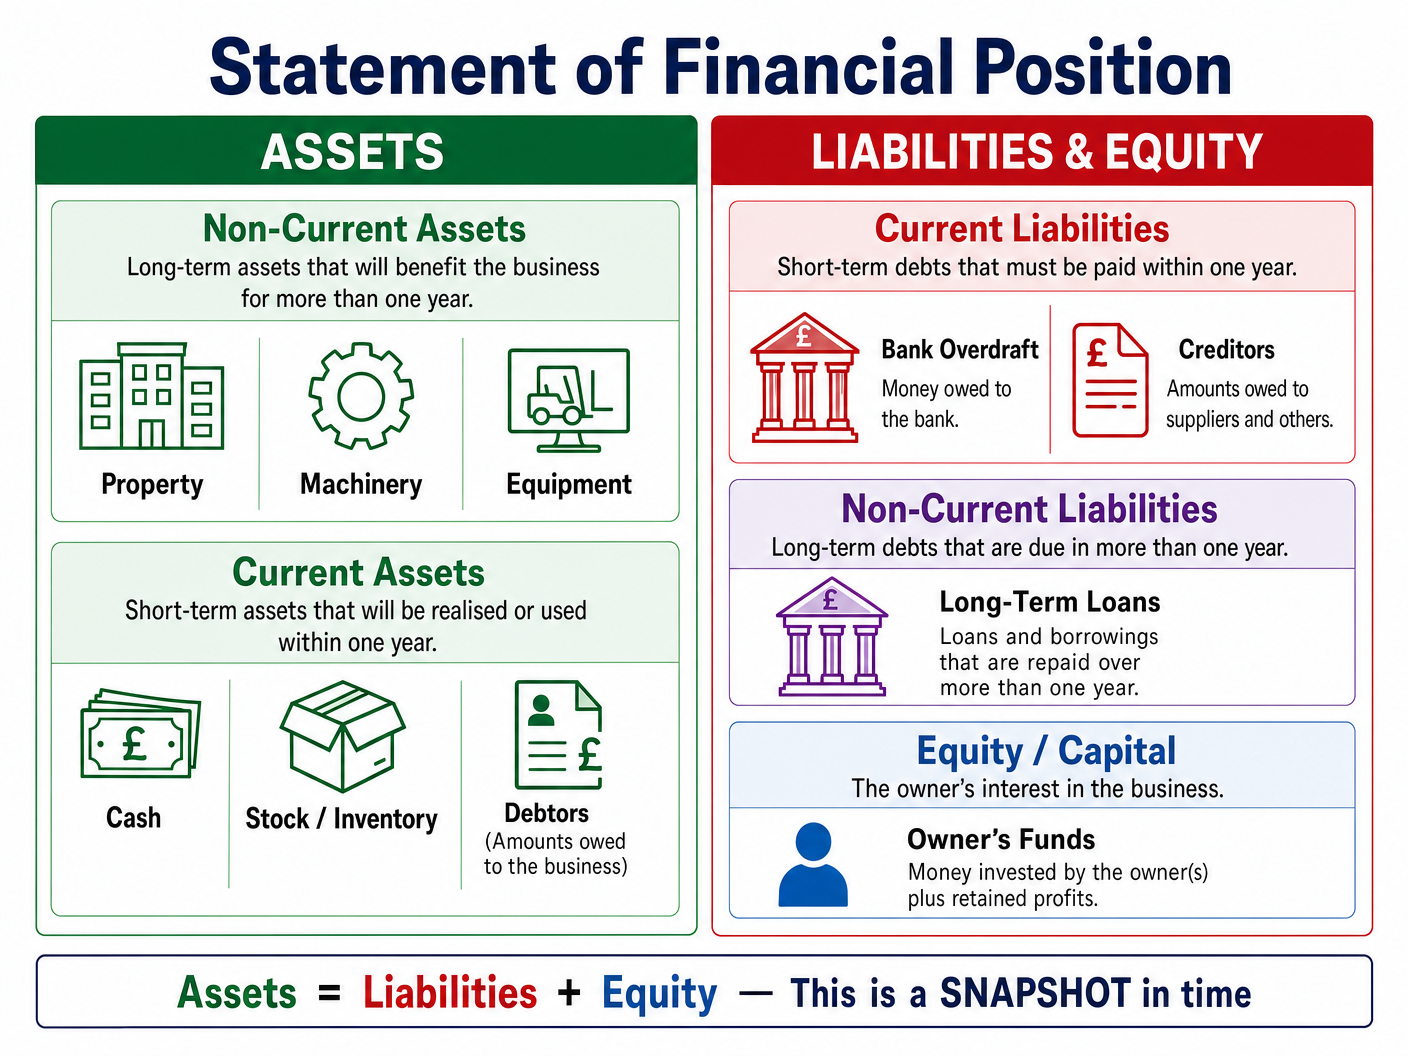
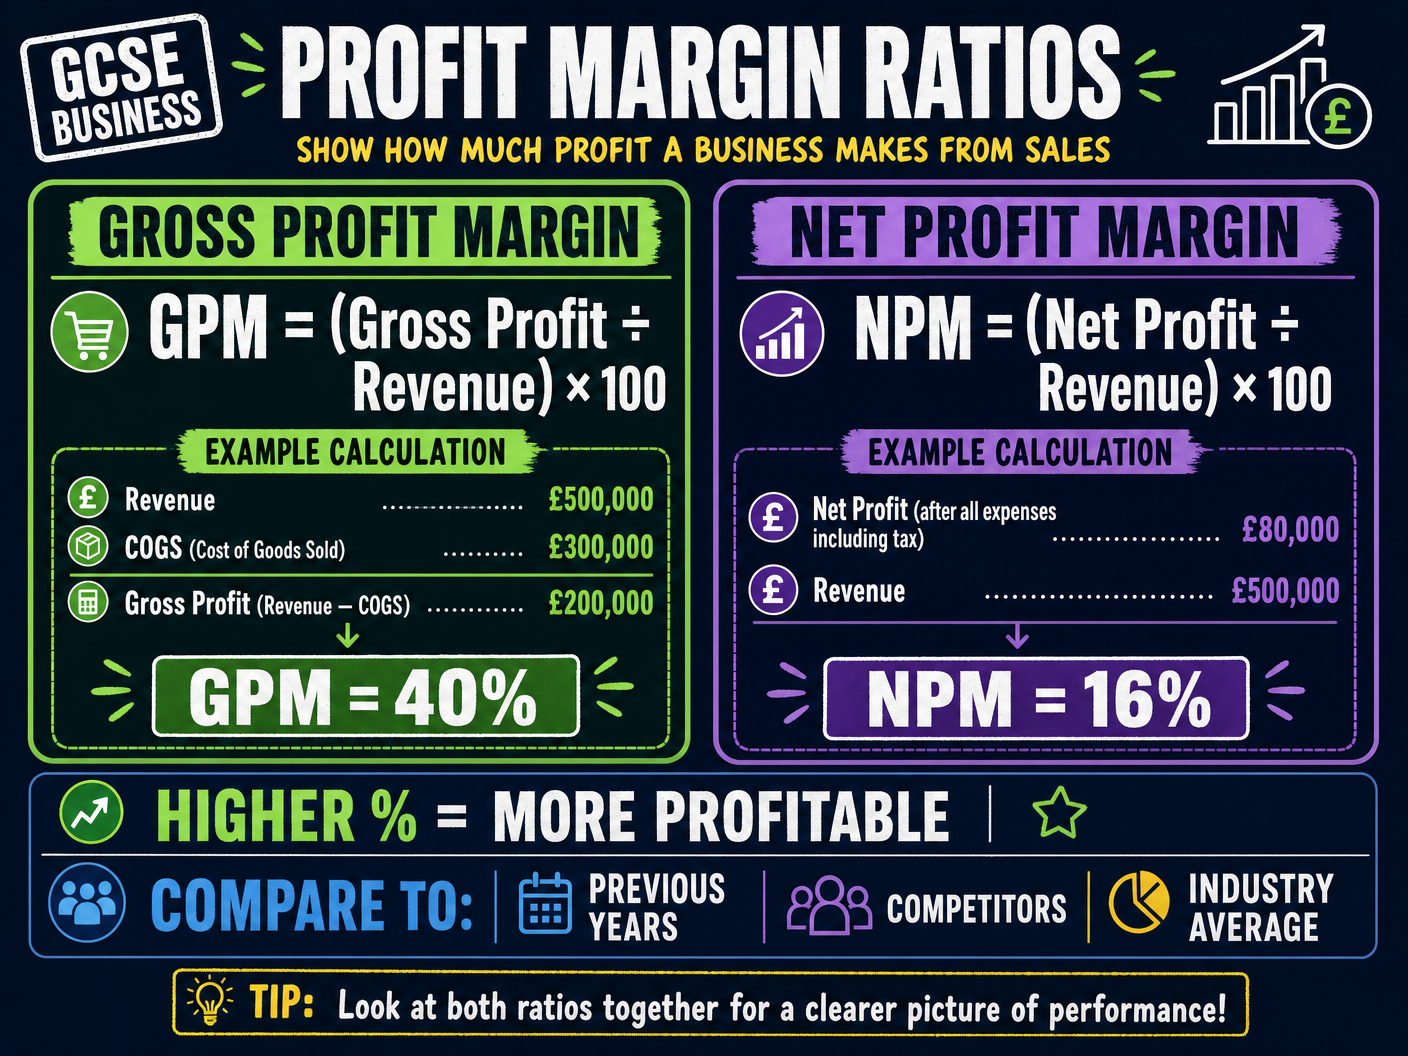
Welcome to your GCSE Business revision podcast. I'm your tutor for today, and in this episode we're diving deep into one of the most important topics in your Business exam: Analysing the Financial Performance of a Business. Whether you're sitting AQA, Edexcel, OCR, or any other board, this topic appears in virtually every exam paper — and the good news is, once you understand the logic behind it, it becomes one of the most straightforward topics to score highly on. So grab a pen, get comfortable, and let's get started. SECTION ONE: CORE CONCEPTS Let's begin with the big picture. Why do businesses bother analysing their financial performance at all? The answer is simple: without understanding how well — or how badly — a business is doing financially, managers, owners, and investors simply cannot make good decisions. Financial statements are the scorecards of business. They tell you whether the business is making money, whether it owns more than it owes, and whether it's improving or declining over time. There are two key financial statements you need to know for your GCSE: the Income Statement, and the Statement of Financial Position. Let's look at each one in turn. First up: the Income Statement. You might also hear this called the Profit and Loss Account, and both names are acceptable in your exam. The income statement shows the financial performance of a business over a period of time — usually one year. It answers the question: did the business make a profit or a loss during this period? Here's how it works. At the top, you have Revenue — sometimes called Sales Turnover. This is the total amount of money the business earned from selling its goods or services. Revenue equals price multiplied by quantity sold. Simple enough. Next, we subtract the Cost of Goods Sold — often abbreviated to COGS. This is the direct cost of producing or buying the goods that were sold. For a manufacturer, this includes raw materials and direct labour. For a retailer, it's the wholesale cost of the stock they bought to resell. Revenue minus Cost of Goods Sold gives us Gross Profit. This is the profit made before any of the business's running costs are deducted. A high gross profit means the business is adding good value to its products. But we're not done yet. From gross profit, we then subtract Operating Expenses. These are the indirect costs of running the business — things like rent, wages for office staff, marketing costs, utility bills, and insurance. These are sometimes called overheads. After deducting operating expenses from gross profit, we arrive at Net Profit. This is the bottom line — the profit remaining after all costs have been paid. Net profit is what the business can use to pay taxes, reward shareholders with dividends, or reinvest back into the business. So the flow is: Revenue, minus Cost of Goods Sold, equals Gross Profit. Gross Profit, minus Operating Expenses, equals Net Profit. Make sure you can reproduce that flow from memory. Now let's move to the second financial statement: the Statement of Financial Position. This used to be called the Balance Sheet, and again, both terms are acceptable. Here's the crucial difference from the income statement: while the income statement covers a period of time, the statement of financial position is a snapshot in time. It shows what the business owns and what it owes on one specific date — usually the last day of the financial year. The statement of financial position is built around three categories: Assets, Liabilities, and Equity. Assets are things the business owns or is owed. We split these into two types. Non-Current Assets are long-term assets that the business will use for more than one year — things like property, machinery, vehicles, and equipment. Current Assets are short-term assets that will be converted into cash within one year — things like stock or inventory, money owed by customers called debtors or trade receivables, and cash itself. Liabilities are what the business owes to others. Again, we split these into two types. Current Liabilities are short-term debts due within one year — things like bank overdrafts and amounts owed to suppliers, called creditors or trade payables. Non-Current Liabilities are long-term debts due in more than one year — such as bank loans and mortgages. Finally, Equity — sometimes called Capital — represents the owner's interest in the business. It's what would be left for the owners if all the assets were sold and all the liabilities were paid off. The fundamental equation of the statement of financial position is: Assets equal Liabilities plus Equity. This equation must always balance — which is why it was historically called the Balance Sheet. Now let's talk about the ratios — and this is where the exam marks really start to flow. Profitability ratios measure how efficiently a business converts its revenue into profit. You need to know two: Gross Profit Margin and Net Profit Margin. Gross Profit Margin equals Gross Profit divided by Revenue, multiplied by 100. The answer is expressed as a percentage. For example, if a business has revenue of five hundred thousand pounds and a gross profit of two hundred thousand pounds, the gross profit margin is two hundred thousand divided by five hundred thousand, multiplied by one hundred, which equals forty percent. This means for every pound of sales, the business keeps forty pence as gross profit before paying its overheads. Net Profit Margin equals Net Profit divided by Revenue, multiplied by 100. Using the same business, if net profit is eighty thousand pounds and revenue is five hundred thousand pounds, the net profit margin is eighty thousand divided by five hundred thousand, multiplied by one hundred, which equals sixteen percent. This means the business keeps sixteen pence of every pound of sales as net profit after all costs. Here's a really important point: the gap between gross profit margin and net profit margin tells you about the business's overhead burden. If gross profit margin is forty percent but net profit margin is only sixteen percent, that gap of twenty-four percentage points represents the operating expenses. If this gap is widening over time, it suggests the business's overheads are growing faster than its revenue — a warning sign. SECTION TWO: INTERPRETING FINANCIAL PERFORMANCE Calculating ratios is only half the job. The other half — and where most marks are awarded in extended answer questions — is interpretation. You need to be able to say what the numbers actually mean. There are three benchmarks you should always consider when interpreting financial performance. First: comparison with previous years. Is the business improving or declining? A gross profit margin that has fallen from forty-five percent to forty percent over two years suggests the business's production costs are rising faster than its prices — perhaps due to rising raw material costs or supplier price increases. Second: comparison with competitors. A net profit margin of sixteen percent might sound good in isolation, but if the industry average is twenty-five percent, the business is actually underperforming. Context is everything. Third: different stakeholder perspectives. This is where many candidates lose marks — they forget that different people care about different things. Shareholders and investors focus on profitability ratios because they want returns on their investment. Managers use financial data to make operational decisions — should we cut costs? Should we raise prices? Lenders and banks look at the statement of financial position to assess whether the business can repay its debts. Employees might look at profitability to assess job security. Suppliers look at liquidity to assess whether the business can pay its bills. When a question asks you to evaluate financial performance from the perspective of a stakeholder, always identify who the stakeholder is, explain what they care about, and then apply the specific financial data to their perspective. SECTION THREE: EXAM TIPS AND COMMON MISTAKES Right, let's talk exam technique — because knowing the content is one thing, but performing under exam conditions is another. Tip one: memorise both formulas. No formula sheet is provided in the exam. Gross Profit Margin equals Gross Profit divided by Revenue times one hundred. Net Profit Margin equals Net Profit divided by Revenue times one hundred. Write these out ten times tonight. Seriously. Tip two: always show your working. In calculation questions, even if you get the final answer wrong, you can still earn method marks if your working is clear. Write out the formula first, substitute the numbers, then calculate. Never just write a final answer with no working shown. Tip three: don't confuse the two financial statements. A very common mistake is candidates describing the income statement when asked about the statement of financial position, or vice versa. Remember: income statement equals performance over time. Statement of financial position equals snapshot at a point in time. Tip four: when interpreting, always compare. A percentage figure on its own means very little. Always compare it to something — the previous year, a competitor, or an industry average. Examiners specifically reward comparative analysis. Tip five: use the command word to guide your answer. If the question says Calculate, just do the maths and show your working. If it says Analyse, you need to calculate and interpret. If it says Evaluate or Justify, you need to make a judgement — weigh up evidence and reach a conclusion. Tip six: the most common mistake in calculation questions is using the wrong profit figure. Make sure you use gross profit for the gross profit margin, and net profit for the net profit margin. Mixing these up is a very easy error to make under pressure. Tip seven: for the statement of financial position, remember it is a snapshot in time. If an exam question asks what the statement of financial position shows, always include this phrase — it's a marking point that candidates frequently miss. SECTION FOUR: QUICK-FIRE RECALL QUIZ Time for a quick-fire quiz! I'll ask the question, give you a few seconds to think, then give the answer. Question one: What is the formula for Gross Profit Margin? ... Gross Profit divided by Revenue, multiplied by one hundred. Question two: What does the statement of financial position show? ... A snapshot of what the business owns and owes at a specific point in time. Question three: Revenue is eight hundred thousand pounds and COGS is four hundred and eighty thousand pounds. What is the gross profit margin? ... Gross profit is three hundred and twenty thousand pounds. Gross profit margin is three hundred and twenty thousand divided by eight hundred thousand times one hundred, which equals forty percent. Question four: Name two examples of current assets. ... Stock or inventory, debtors or trade receivables, and cash. Question five: What is the difference between gross profit and net profit? ... Gross profit is revenue minus cost of goods sold. Net profit is gross profit minus operating expenses. Question six: Name two non-current liabilities. ... Long-term bank loans and mortgages. Question seven: Why might a shareholder be concerned if net profit margin falls from twenty percent to twelve percent? ... Because a lower net profit margin means less profit available for dividends, reducing their return on investment. SECTION FIVE: SUMMARY AND SIGN-OFF Let's bring it all together. In this episode, we've covered the two key financial statements: the income statement, which shows performance over a period of time, and the statement of financial position, which is a snapshot at a point in time. We've worked through the structure of each, and we've calculated and interpreted gross profit margin and net profit margin. The key things to take away are: know your formulas by heart; always show your working in calculations; always compare ratios against a benchmark; and always consider the stakeholder perspective when evaluating performance. For your revision, I'd suggest practising at least five calculation questions using different sets of financial data, and then writing a short paragraph interpreting each result from the perspective of a different stakeholder each time. You've got this. Financial performance is one of those topics that rewards practice — the more you do, the more confident you'll feel walking into that exam. Good luck, keep revising, and I'll see you in the next episode!
Key Terms & Definitions
- Income Statement
- A financial document showing a business's revenue, costs, and profit or loss over a given period of time.
- Statement of Financial Position
- A financial document showing the assets, liabilities, and equity of a business at a specific point in time.
- Gross Profit
- Revenue minus the cost of goods sold.
- Net Profit
- Gross profit minus operating expenses.
- Assets
- Items of value owned by the business or money owed to it.
- Liabilities
- Money owed by the business to others.
Worked Examples
Worked Example
Question: A business has Revenue of £500,000, Cost of Goods Sold of £200,000, and Operating Expenses of £150,000. Calculate the Gross Profit Margin and Net Profit Margin. Show your working. (4 marks)
Solution: **Gross Profit Calculation**: Gross Profit = Revenue - COGS Gross Profit = £500,000 - £200,000 = £300,000 [1 mark] **Gross Profit Margin Calculation**: GPM = (Gross Profit ÷ Revenue) × 100 GPM = (£300,000 ÷ £500,000) × 100 = 60% [1 mark] **Net Profit Calculation**: Net Profit = Gross Profit - Operating Expenses Net Profit = £300,000 - £150,000 = £150,000 [1 mark] **Net Profit Margin Calculation**: NPM = (Net Profit ÷ Revenue) × 100 NPM = (£150,000 ÷ £500,000) × 100 = 30% [1 mark]
Worked Example
Question: Explain one reason why a business might experience a falling Net Profit Margin despite its Gross Profit Margin remaining the same. (3 marks)
Solution: One reason for a falling Net Profit Margin while the Gross Profit Margin remains stable is an increase in operating expenses (overheads) [1 mark]. For example, if the business's rent or administrative wages increase, these costs are deducted from the gross profit to calculate net profit [1 mark]. Because the cost of goods sold hasn't changed (keeping GPM stable), the higher overheads will reduce the final net profit figure relative to revenue, thus lowering the Net Profit Margin [1 mark].
Worked Example
Question: Evaluate the financial performance of Business X. In 2023, its Net Profit Margin was 15%. In 2024, its Net Profit Margin is 12%. (9 marks)
Solution: **Introduction/Analysis**: The financial performance of Business X appears to be declining. The Net Profit Margin has fallen by 3 percentage points from 15% in 2023 to 12% in 2024. This indicates that for every £1 of revenue, the business is now only keeping 12p as net profit, compared to 15p the previous year. **Causes/Implications**: This decline could be caused by rising operating expenses, such as increased utility bills or higher wages, which eat into the profit margin. Alternatively, the business might have had to lower its selling prices to remain competitive, reducing revenue without a proportional drop in costs. This falling margin will be a significant concern for shareholders, as a lower net profit means there is less money available to distribute as dividends, potentially reducing their return on investment. **Evaluation/Conclusion**: However, to fully evaluate the performance, we need more context. While a falling NPM is generally negative, if Business X's main competitors have seen their margins fall to 8% due to an industry-wide crisis, then 12% might actually represent strong relative performance. Furthermore, if the business sacrificed short-term profit margin by spending heavily on a new marketing campaign (increasing expenses) that will boost long-term market share, this could be a strategic decision rather than poor performance. Overall, while the ratio shows a decline, a definitive judgement requires comparison with industry averages and an understanding of the business's long-term strategy.
Practice Questions
Question: Explain the difference between an asset and a liability. (2 marks)
Answer:
Question: A business has Revenue of £80,000, Gross Profit of £40,000, and Net Profit of £10,000. Calculate the Gross Profit Margin. (2 marks)
Answer:
Question: State two examples of current assets. (2 marks)
Answer:
Question: Explain one way a business could improve its Net Profit Margin. (3 marks)
Answer:
Question: Analyse the importance of the Statement of Financial Position to a bank considering giving a loan to a business. (6 marks)
Answer: