OCR · GCSE · Business
Course version: J204 · Version from Sept 2019
Break-even
Master break-even analysis, a fundamental concept in GCSE Business. Understand how fixed and variable costs interact with revenue to determine the point of profitability, and learn to apply this crucial tool for strategic business decision-making.
- 4 min read
- 3 worked examples
- 5 practice questions
- 6 key terms
Check what you remember
Read the wording for your board, then hide it and explain Break-Even Point in your own words. Rough notes are fine. This is a self-check, with no mark or grade.
Reference: OCR
The level of output where total revenue exactly equals total costs.
Study Notes
Overview
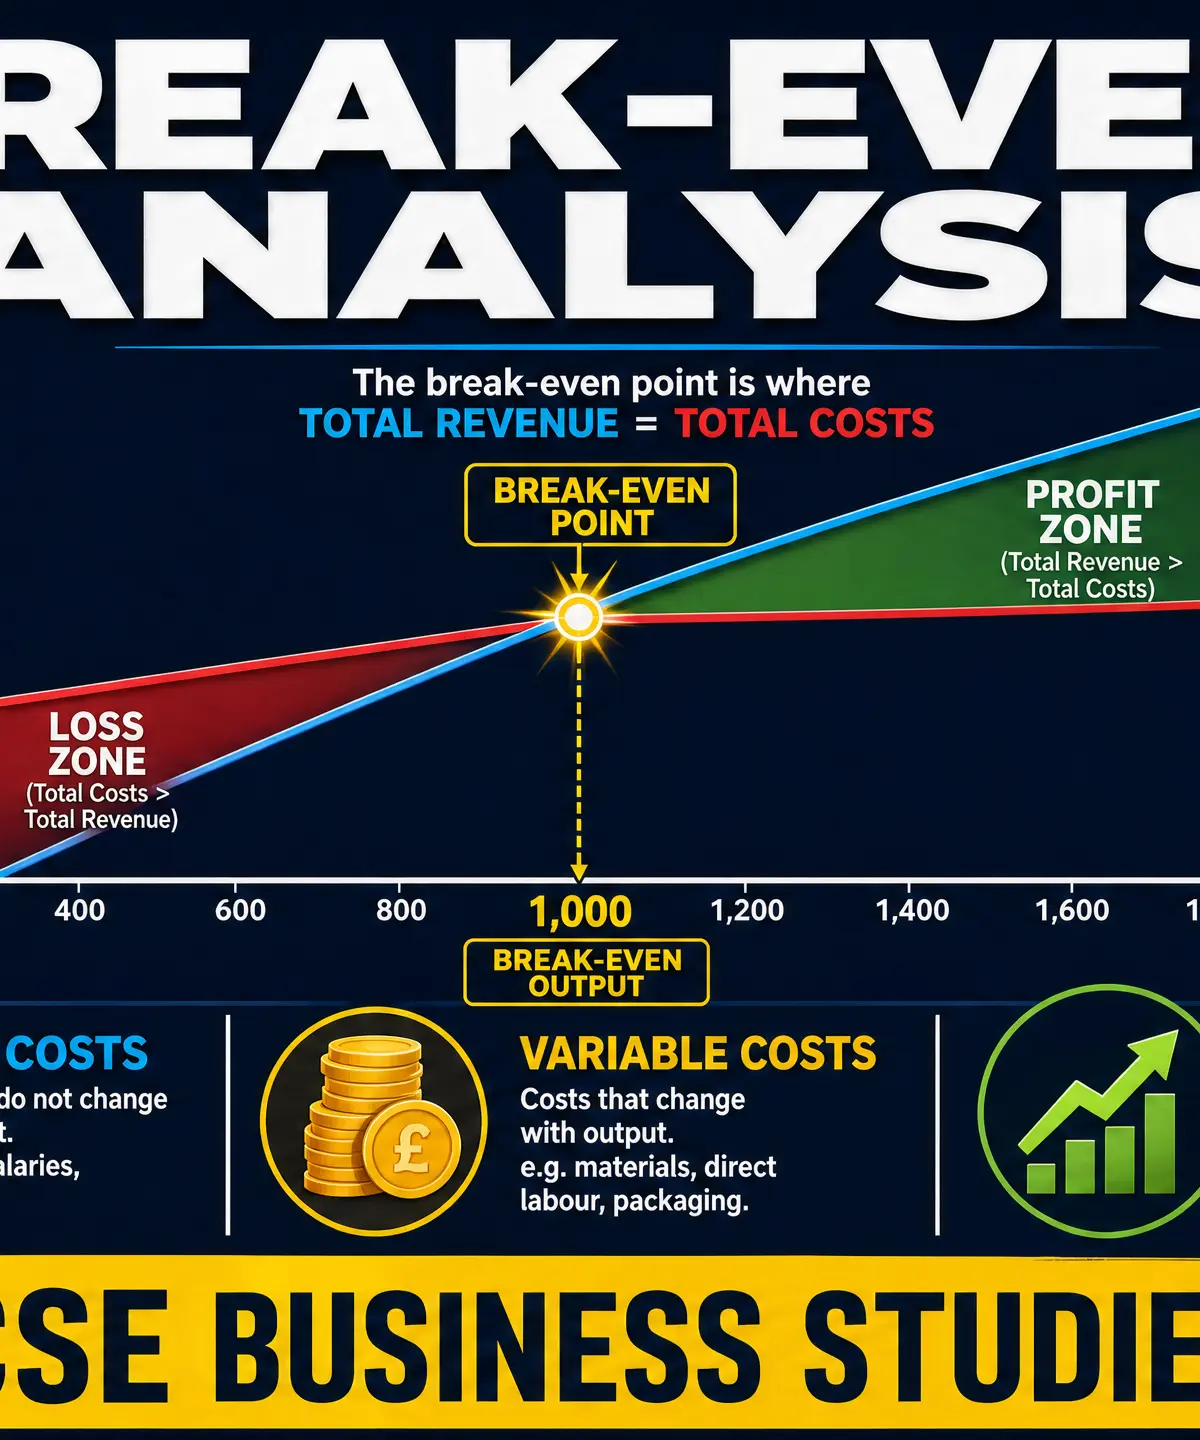
Break-even analysis is a cornerstone of business planning and financial management, and it is heavily tested across all GCSE Business specifications. Examiners expect candidates to not only perform calculations accurately but also to interpret break-even charts and evaluate the usefulness of this tool for business decision-making.
This study guide covers the definitions of fixed, variable, and total costs, the calculation of the break-even quantity and margin of safety, and the application of these concepts to real-world business scenarios such as pricing and marketing. Mastering this topic is essential for securing marks in both short calculation questions and extended evaluative essays.
Core Concepts
Business Costs
To calculate break-even, you must first understand the different types of costs a business faces:
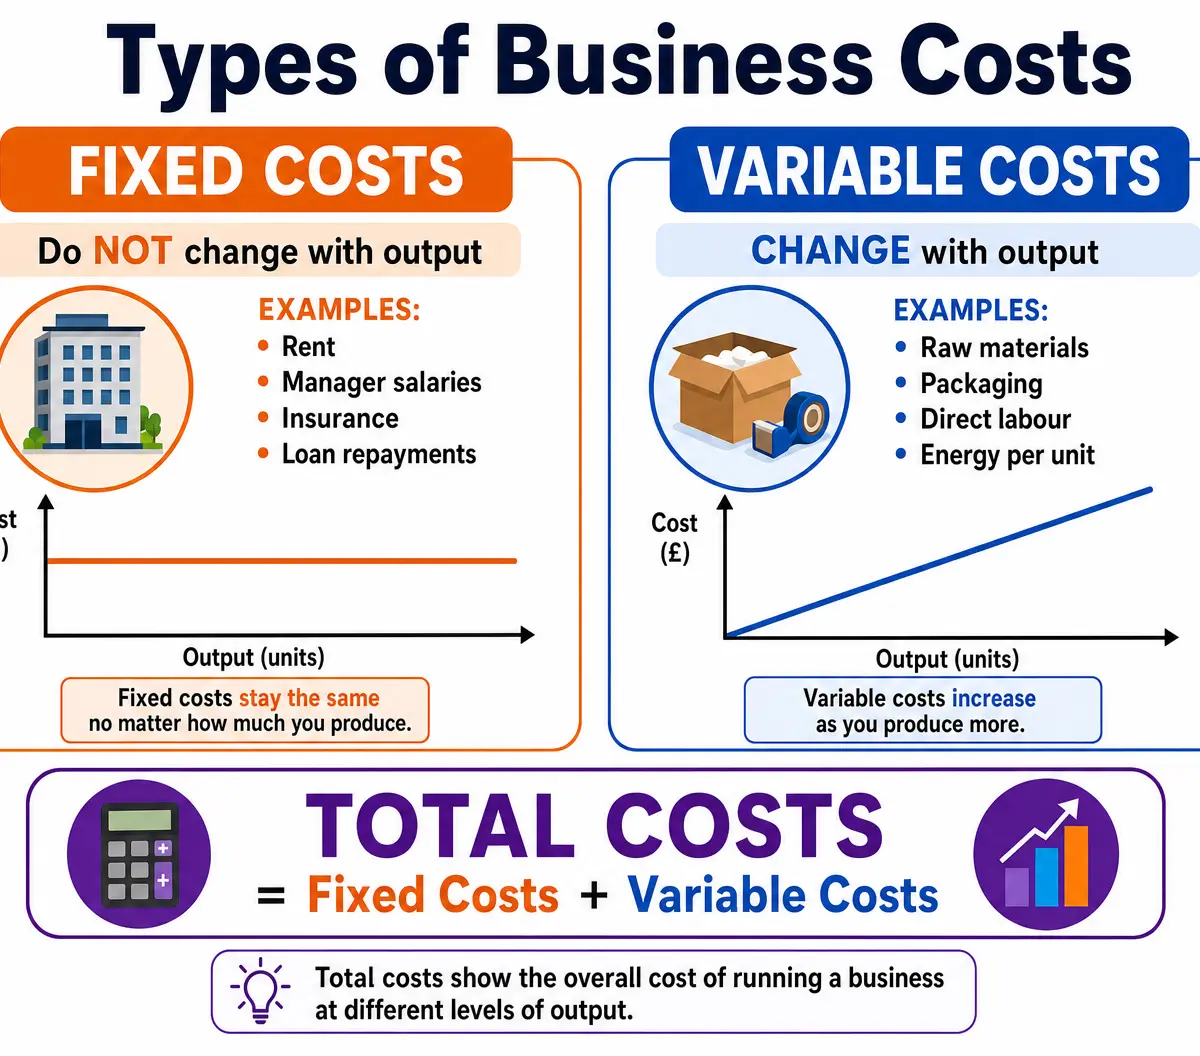
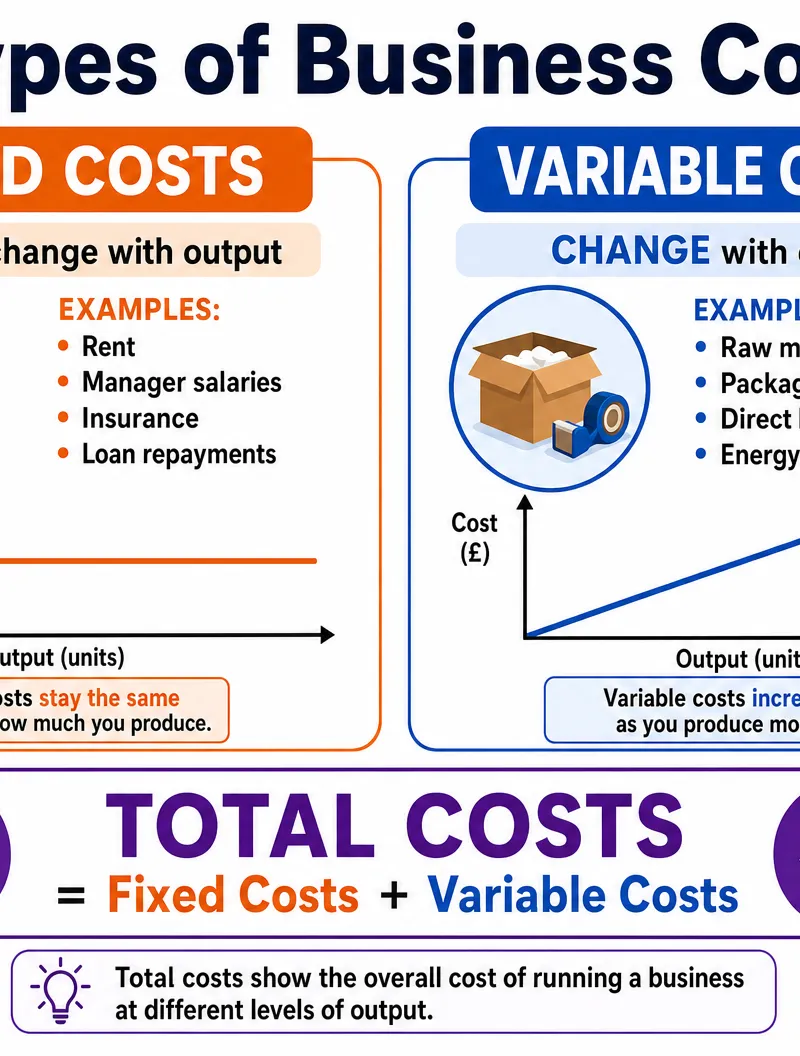
- Fixed Costs: These are costs that do not change with the level of output in the short term. Whether a business produces zero units or 10,000 units, fixed costs remain the same. Examples include rent, insurance, and salaries.
- Variable Costs: These are costs that change directly with the level of output. As production increases, variable costs increase. Examples include raw materials, packaging, and piece-rate labour.
- Total Costs: The sum of fixed costs and variable costs (Total Costs = Fixed Costs + Variable Costs).
Revenue and Profit
- Total Revenue: The total amount of money brought in by sales. It is calculated by multiplying the selling price per unit by the number of units sold (Total Revenue = Price × Quantity).
- Profit: The financial gain made when total revenue exceeds total costs.
- Loss: The financial loss made when total costs exceed total revenue.
The Break-Even Point
Break-even is the point at which a business is making neither a profit nor a loss. At this exact level of output, Total Revenue = Total Costs.
Contribution
Contribution is a crucial concept for calculating break-even. It is the amount of money left over from the sale of each unit after variable costs have been paid. This 'contribution' goes towards paying off the fixed costs.
Contribution per unit = Selling Price - Variable Cost per unit
Calculating Break-Even Quantity
The formula to calculate the number of units a business needs to sell to break even is:
Break-Even Quantity = Fixed Costs / Contribution per unit
Margin of Safety
The margin of safety is the difference between the current (or expected) level of output and the break-even level of output. It shows how much sales can fall before the business starts making a loss.
Margin of Safety = Current Output - Break-Even Output
Break-Even Charts
Examiners often require candidates to draw, complete, or interpret break-even charts.
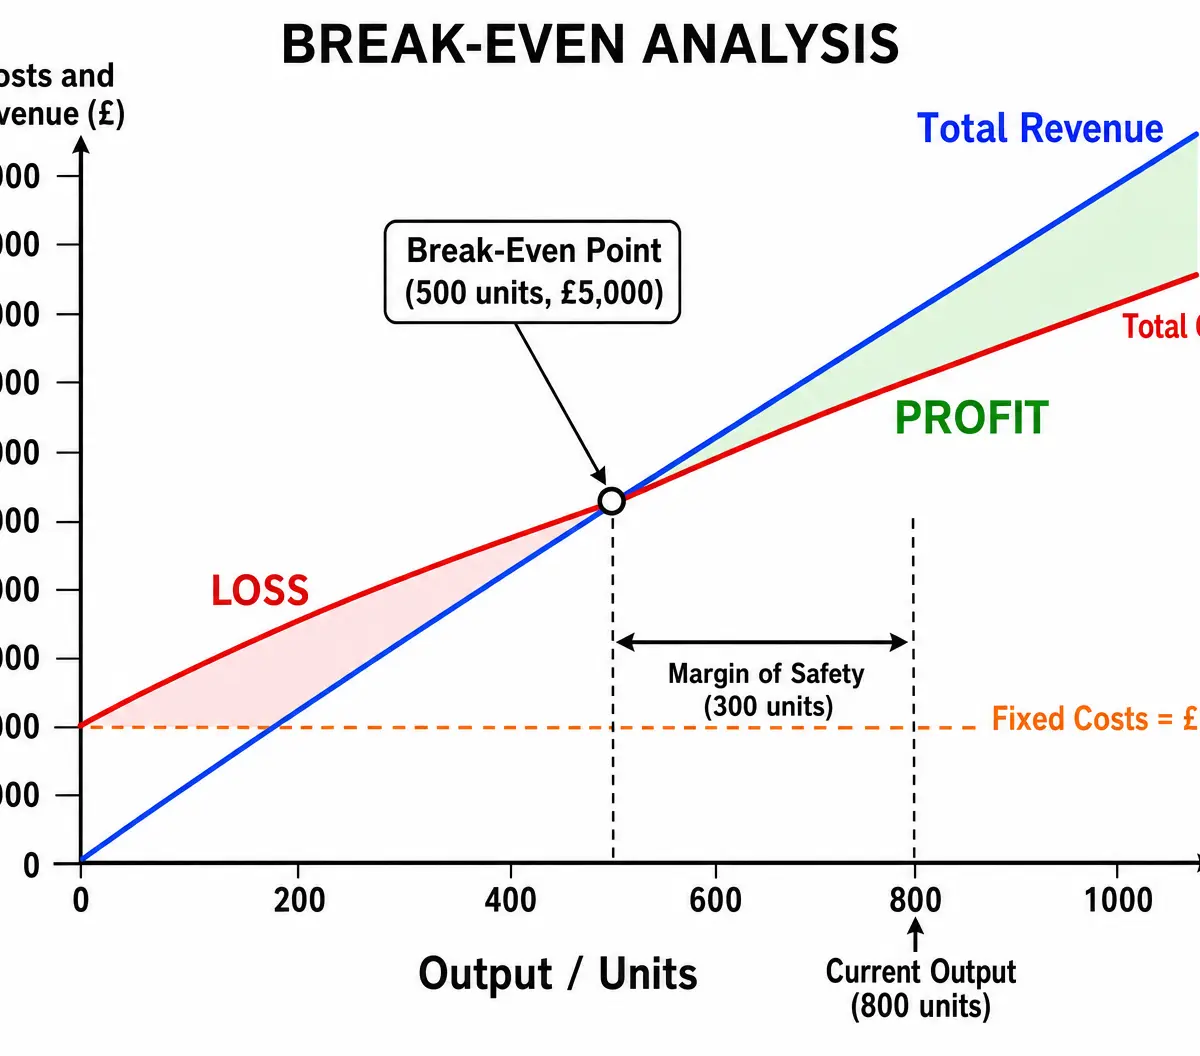
Key features of a break-even chart:
- X-axis: Output (units)
- Y-axis: Costs and Revenue (£)
- Fixed Costs Line: A horizontal line starting from the fixed cost value on the Y-axis.
- Total Costs Line: Starts from the fixed costs intercept on the Y-axis and slopes upwards.
- Total Revenue Line: Starts from the origin (0,0) and slopes upwards, usually steeper than the total costs line.
- Break-Even Point: The intersection of the Total Costs and Total Revenue lines.
Podcast Episode
Listen to this 10-minute podcast for a comprehensive review of Break-Even Analysis, including a step-by-step calculation walkthrough and a quick-fire recall quiz.
Visual Resources
2 diagrams and illustrations

Interactive Diagrams
1 interactive diagram to visualise key concepts
Conceptual Flow Outline
Relationship between costs, revenue, and break-even
Worked Examples
3 worked examples — open one to explore the question and available guidance.
Practice Questions
Try the question, then reveal an answer plan or example response
A bakery has fixed costs of £5,000 per month. It sells cakes for £3 each. The variable cost per cake is £1. Calculate the break-even quantity. (3 marks)
Hint: Remember to calculate contribution per unit first.
Using the bakery from the previous question, if they currently sell 3,000 cakes a month, calculate their margin of safety. (2 marks)
Hint: Margin of Safety = Current Output - Break-Even Output
Explain one limitation of using break-even analysis for a business. (3 marks)
Hint: Think about the assumptions made when drawing a break-even chart.
A clothing manufacturer's rent increases by £1,000 a month. Explain the impact this will have on their break-even point. (3 marks)
Hint: Rent is what type of cost? How does an increase in this cost affect the formula?
State the formula for calculating total costs. (1 mark)
Hint: It's the sum of the two main types of costs.
Exam technique
How to turn what you know into marks
How to approach the question
Always show your workings for calculation questions. For extended writing, use the PEEL structure.
How to structure your answer
- Essay questions
- Provide a balanced argument discussing both pros and cons, ending with a justified conclusion.
- Source questions
- Use data from the case study to support your calculations or arguments.
- Explain questions
- State a point, explain how it impacts the business, and link it back to the question.
Timing
Approximately 1 minute per mark.
Common pitfalls
- Confusing fixed and variable costs.
- Forgetting to calculate contribution per unit before dividing fixed costs.
- Starting the Total Costs line from zero on a chart instead of the Fixed Costs intercept.
- Failing to mention the limitations of break-even analysis in evaluation questions.
What the command words want
- Explain
- Give a reason and develop it with a consequence for the business.
- Evaluate
- Discuss advantages and disadvantages, and provide a final judgement.
- Calculate
- Show workings and provide the final numerical answer with units.
Watch or listen (optional)
Test your understanding of Break-even
Active recall beats re-reading. Take an instant quiz now to test what you’ve learned and lock it into long-term memory.
A week of Premium from your first lesson · Then the free plan continues · No card, no charge