Subject: Mathematics | Level: GCSE | Exam Board: Edexcel
Master the fundamentals of probability to confidently tackle combined events, tree diagrams, and Venn diagrams. This topic is essential for interpreting data and predicting outcomes, and it frequently features in high-mark exam questions.
Revision Notes & Key Concepts
Revision Podcast Transcript
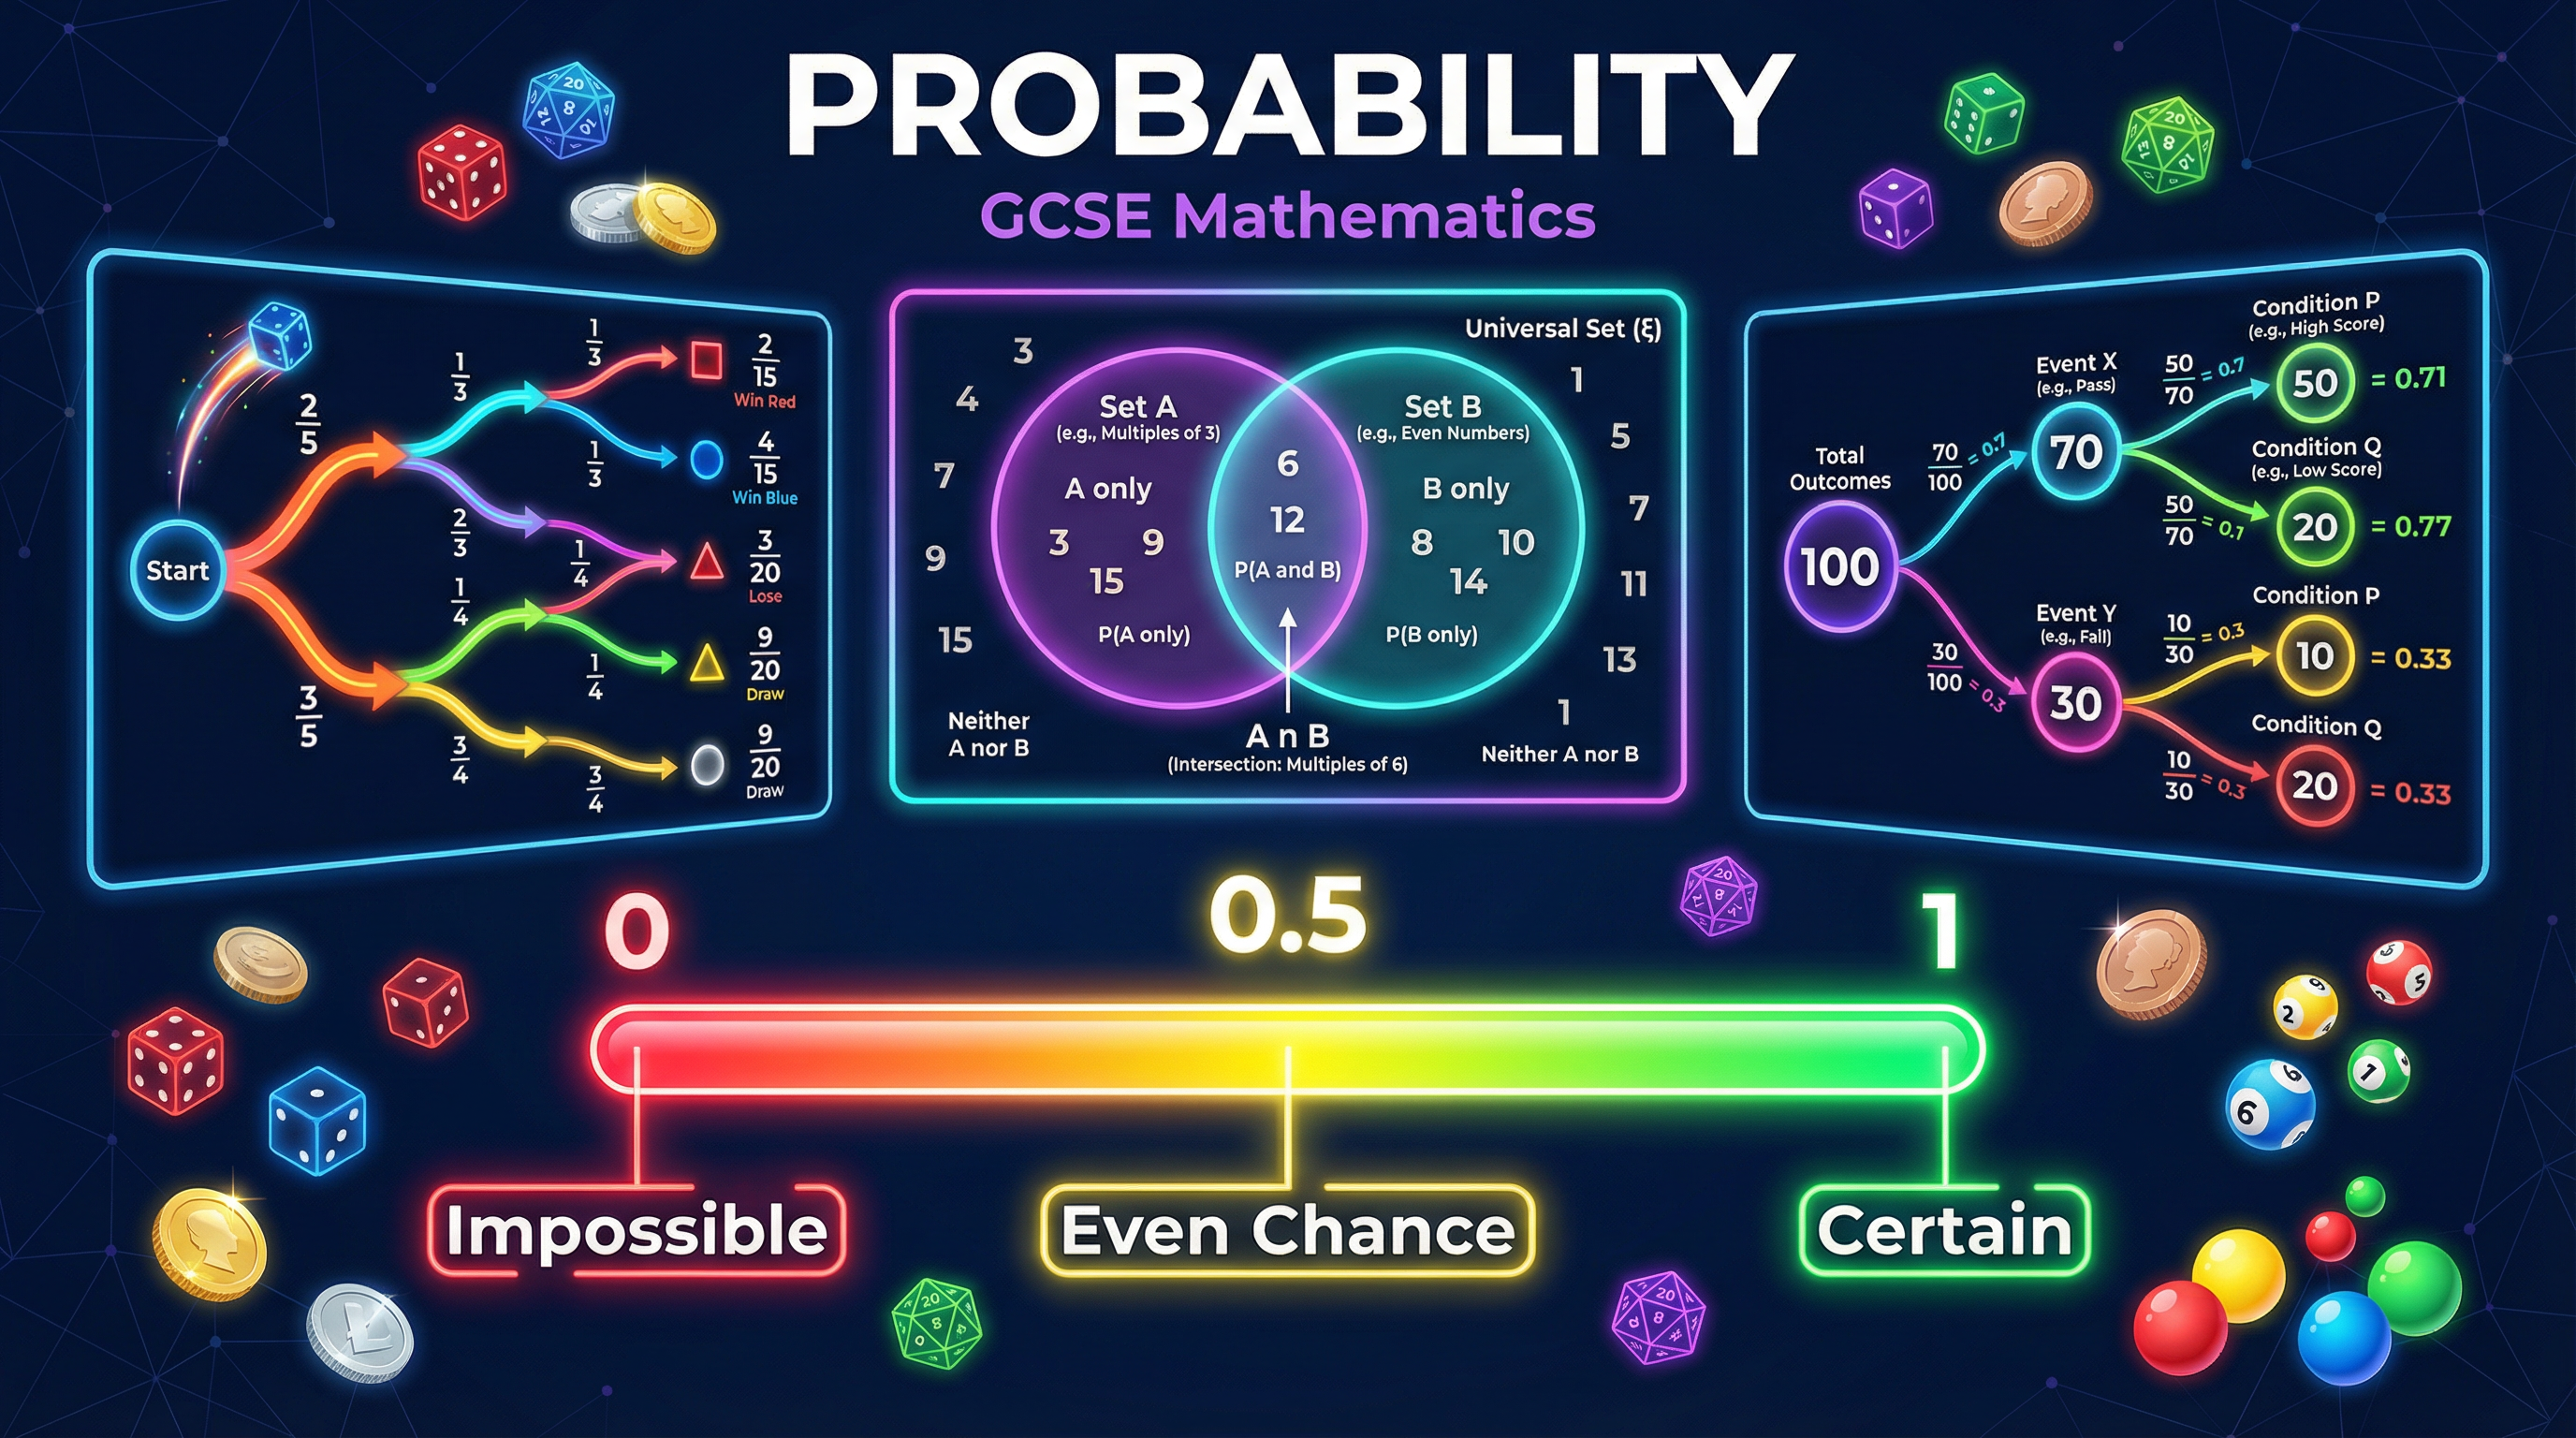
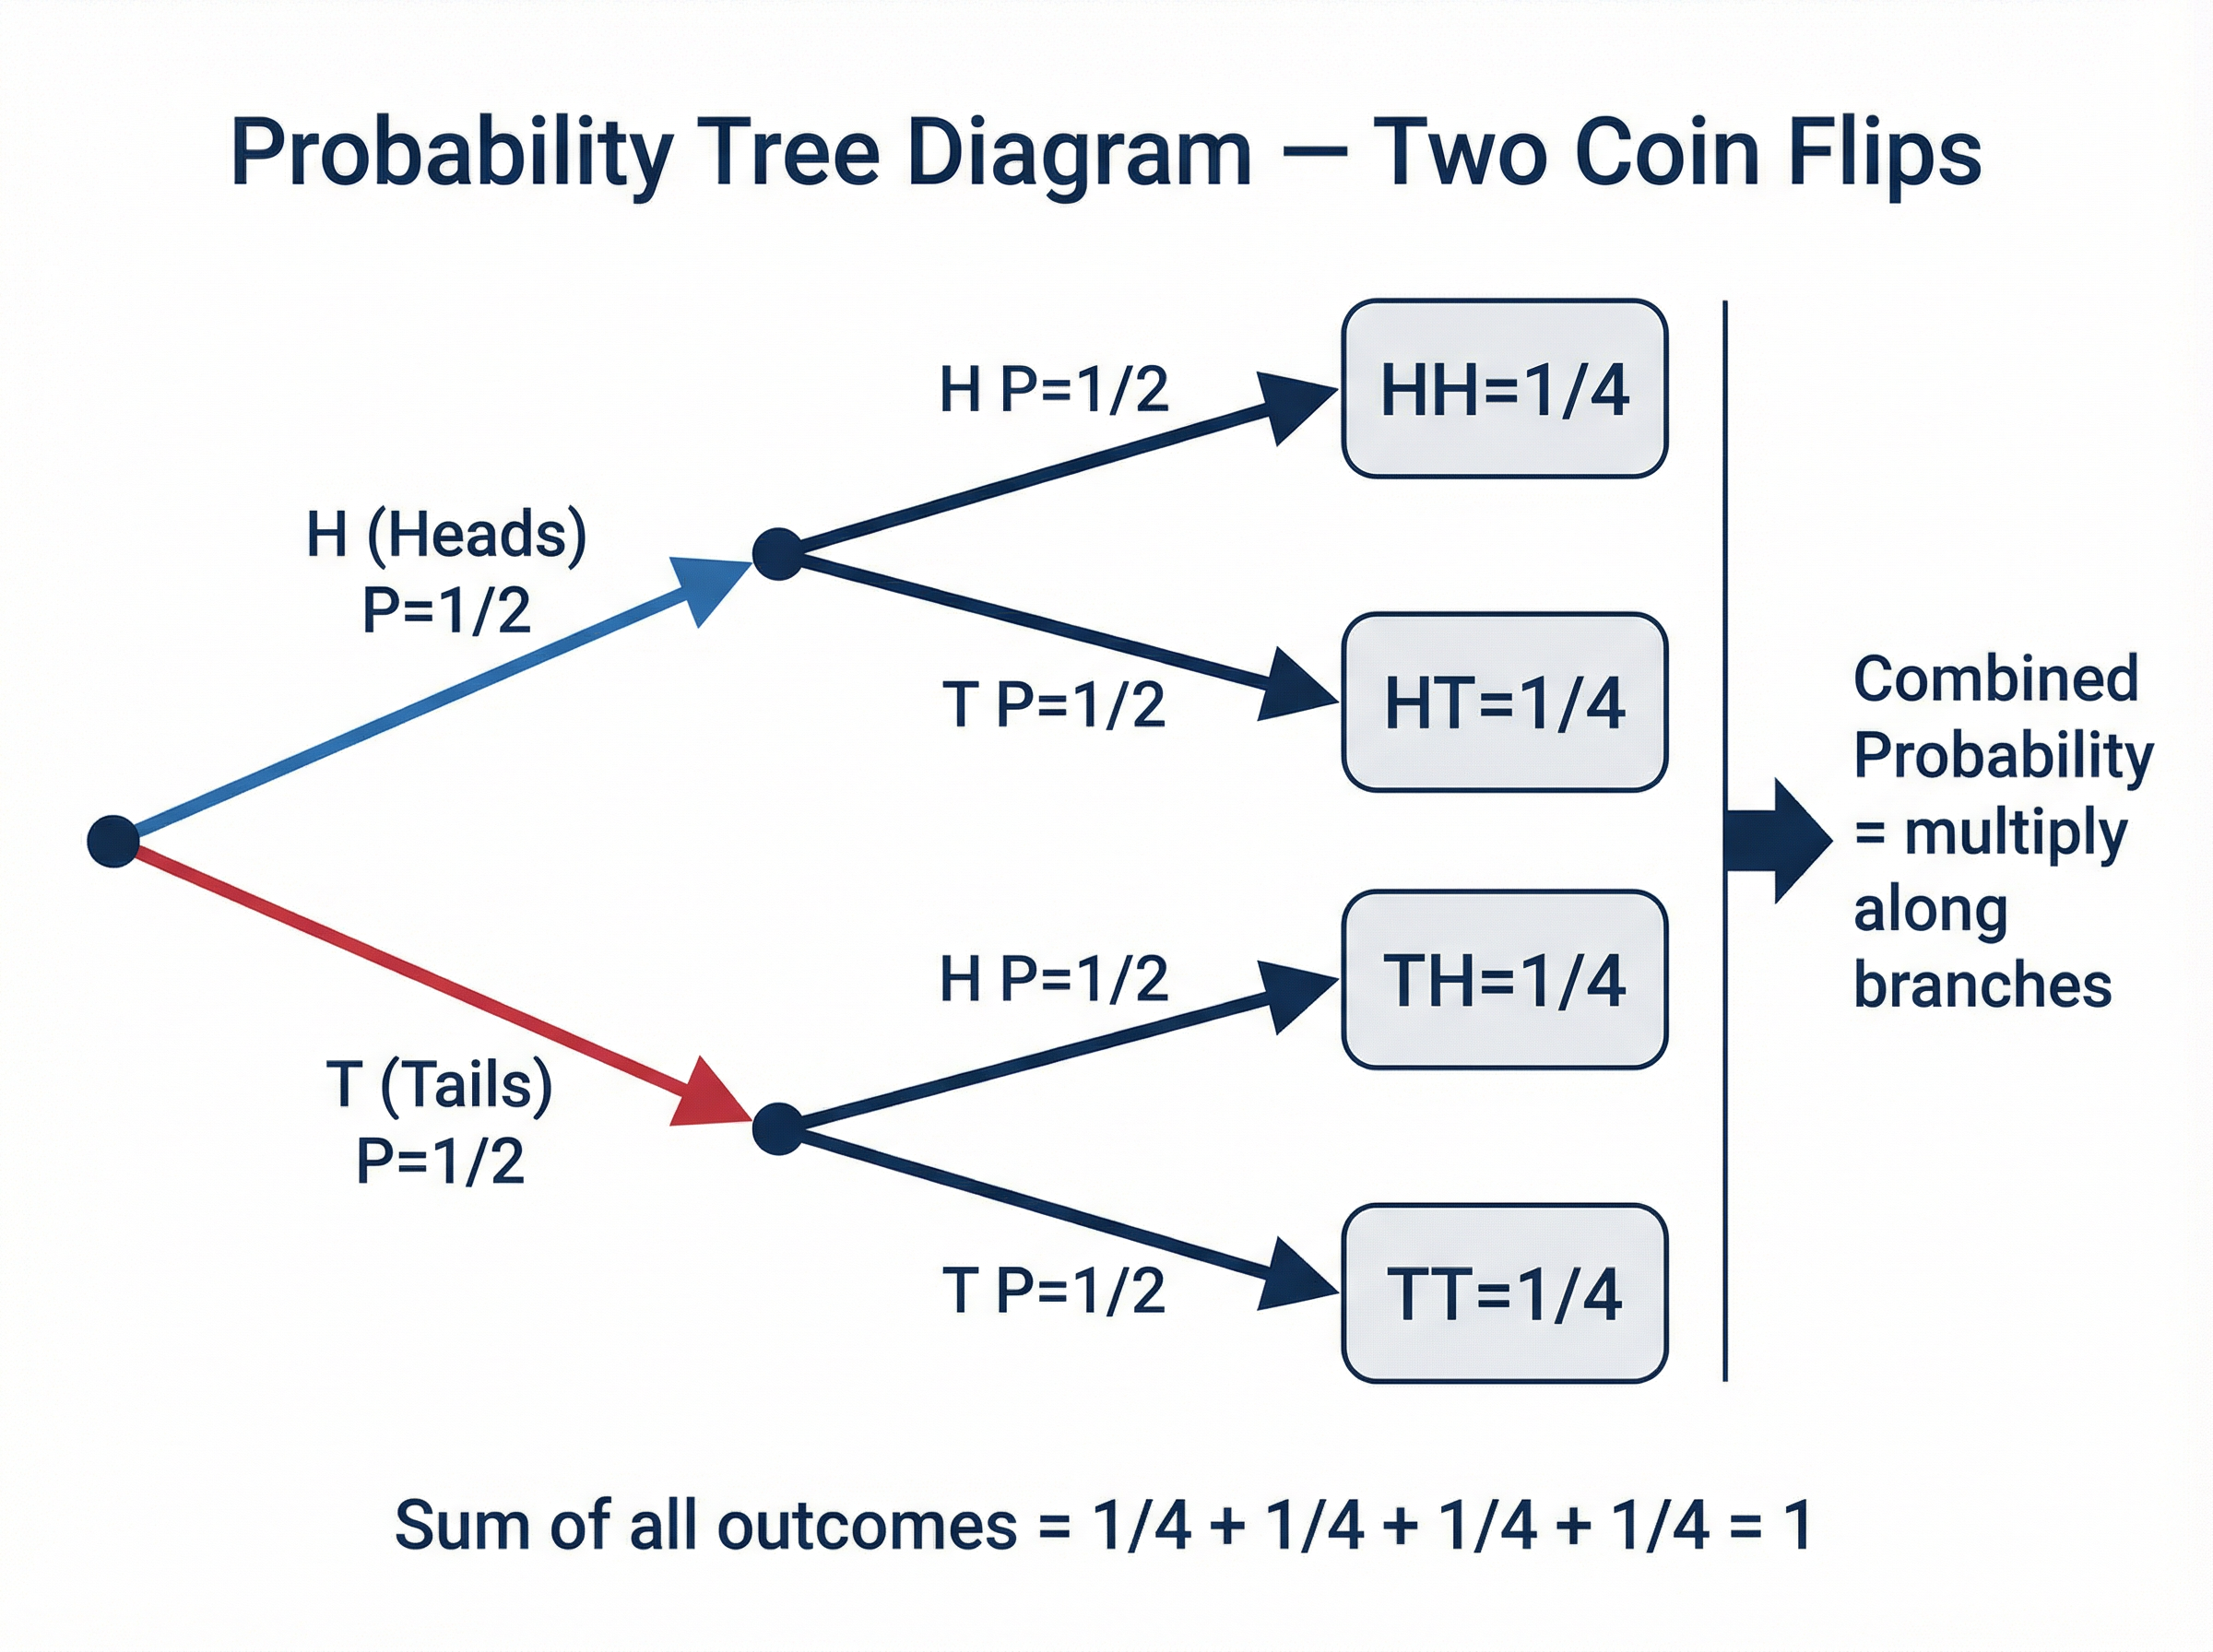
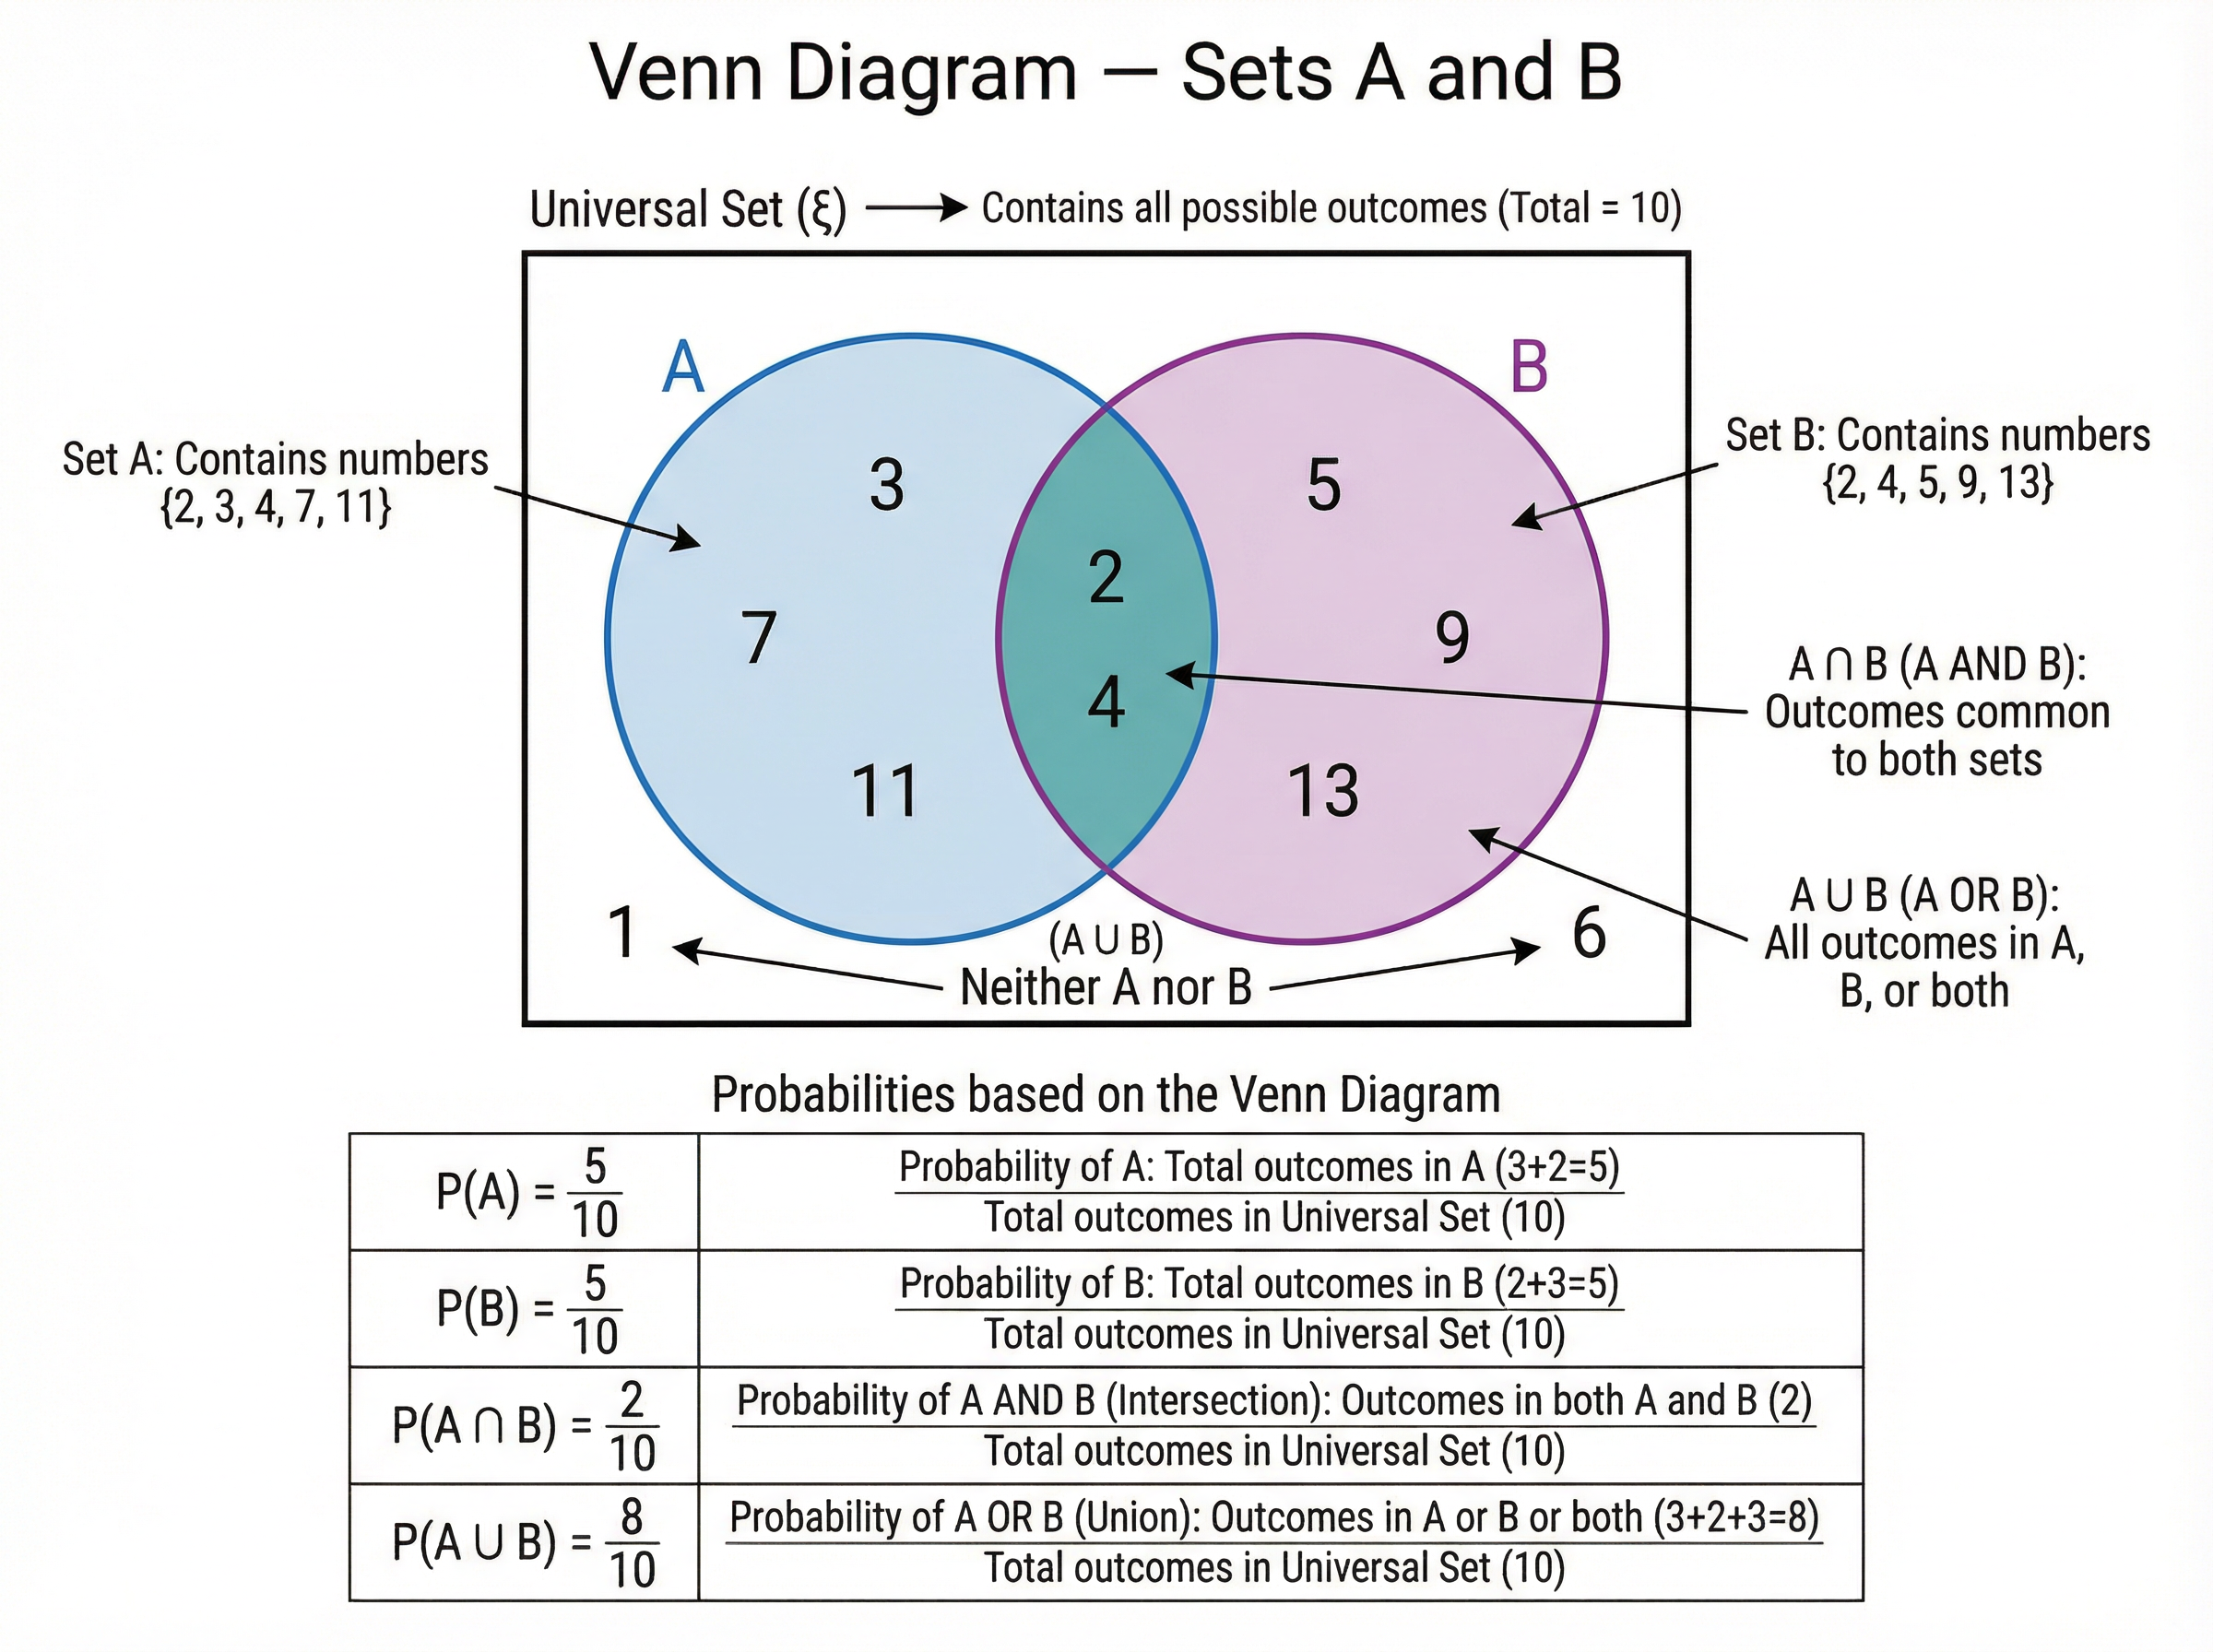
GCSE Mathematics Probability — Study Podcast Duration: approximately 10 minutes Voice: Female, warm, conversational, enthusiastic tutor --- INTRO — approximately 1 minute Hello and welcome! I'm so glad you're here. Whether you're revising for the first time or doing a final push before your GCSE Maths exam, this episode is going to give you everything you need to feel confident about Probability. I'm going to walk you through the key concepts, show you exactly how examiners think, point out the mistakes that cost students marks every single year, and then finish with a quick-fire quiz to test your recall. So grab a pen and paper — yes, actually grab one — because the best way to learn probability is to work through it as we go. Let's dive in. --- CORE CONCEPTS — approximately 5 minutes Let's start with the absolute foundation: the probability scale. Every probability is a number between zero and one, inclusive. Zero means the event is impossible — it cannot happen. One means the event is certain — it will definitely happen. Anything in between represents how likely the event is. A probability of zero point five means an even chance — equally likely to happen or not happen. Examiners will sometimes ask you to place events on a probability scale, and they want to see you using correct numerical values, not just words like "likely" or "unlikely." Now, here's a rule you must memorise: the probabilities of all possible outcomes of an experiment must add up to exactly one. This is called the exhaustive rule. If I roll a fair six-sided die, the probability of getting a one, two, three, four, five, or six must sum to one. If you're ever given a probability question where the probabilities don't add to one, that's your signal that something is wrong — or that you need to find a missing probability by subtracting from one. This leads us to complementary events. The probability that an event does NOT happen equals one minus the probability that it DOES happen. So if the probability of rain tomorrow is zero point three, the probability of no rain is one minus zero point three, which is zero point seven. Examiners love "at least one" problems — and the slickest way to solve them is always to use the complement. Instead of calculating all the ways you CAN get at least one, calculate the probability of getting NONE, and subtract from one. Next up: frequency trees and two-way tables. These are your tools for organising information when you're given data about groups of people or objects. A frequency tree splits a group into categories at each stage. For example: one hundred students, sixty play sport. Of those sixty, forty also play a musical instrument. Of the forty who don't play sport, fifteen play an instrument. You can read probabilities straight from the tree by dividing the frequency in a branch by the total. The key skill examiners test here is conditional probability from a frequency tree — the probability of one thing GIVEN that another thing has already happened. You find this by restricting your sample space to just the relevant branch. Now let's talk about Venn diagrams. A Venn diagram shows two or more overlapping sets inside a rectangle called the universal set. The intersection — the overlapping bit in the middle — contains outcomes that belong to BOTH sets. The union — everything inside either circle — contains outcomes in set A OR set B or both. A common exam question gives you a Venn diagram and asks for P of A given B — that's conditional probability again. You restrict your view to just set B, and ask: of everything in B, what fraction is also in A? So P of A given B equals the number in the intersection divided by the total in B. Now for tree diagrams — probably the most tested tool in this topic. A tree diagram maps out a multi-stage experiment. Each branch shows an outcome and its probability. The golden rule: multiply along branches to get the probability of a combined outcome. Then add the probabilities of different branches that give you the same final result. For independent events — like flipping a coin twice — the probability on the second set of branches stays the same regardless of what happened first. But for dependent events — like picking coloured balls from a bag WITHOUT replacement — the probabilities on the second set of branches CHANGE depending on what was picked first. This is where so many candidates drop marks. If there are ten balls in a bag and you pick one out without replacing it, there are now only nine balls left. The denominator changes. Always adjust it. Let me give you a quick example. A bag contains six red balls and four blue balls. I pick one ball, don't replace it, then pick a second. What's the probability of picking two red balls? First pick: six red out of ten total, so probability is six over ten. Second pick: now there are only five red balls left and nine balls total, so probability is five over nine. Multiply along the branch: six over ten times five over nine equals thirty over ninety, which simplifies to one third. Notice how the denominator dropped from ten to nine — that's the without-replacement adjustment. --- EXAM TIPS AND COMMON MISTAKES — approximately 2 minutes Right, let's talk exam technique. First: always check your probabilities sum to one. After completing a tree diagram or frequency tree, add all the final branch probabilities. If they don't sum to one, you've made an arithmetic error somewhere. This is a free self-check that takes ten seconds and could save you marks. Second: label everything. Examiners award marks for clearly labelled branches on tree diagrams. Write the outcome AND the probability on every single branch. Don't assume the examiner can read your mind. Third: the "without replacement" trap. This is the most common error in the whole topic. Candidates see a probability question with two picks and just use the same fractions twice. Always ask yourself: is this with or without replacement? The question will usually tell you — but you have to read it carefully. Fourth: don't confuse "and" with "or." In probability, AND means multiply. OR means add — but only if the events are mutually exclusive, meaning they can't both happen at the same time. If they're not mutually exclusive, you need to use the addition rule: P of A or B equals P of A plus P of B minus P of A and B. Forgetting to subtract the intersection is a classic error. Fifth: for "at least one" questions, always use the complement. Calculate the probability of NONE of the event happening, then subtract from one. It's almost always faster and less error-prone than listing all the ways you CAN get at least one. Sixth: when a question says "calculate," you must show your working. A correct answer with no working shown may only receive one mark out of three or four. Show every step. --- QUICK-FIRE RECALL QUIZ — approximately 1 minute Okay, cover up your notes if you can. I'll ask a question, give you a few seconds to think, then give the answer. Question one: What must all probabilities of exhaustive outcomes sum to? ... The answer is one. Question two: A bag has five red and three blue balls. I pick one without replacing it, then pick again. What is the denominator for the second pick? ... The answer is seven — because one ball has been removed. Question three: P of event A is zero point four. What is P of not A? ... Zero point six. One minus zero point four. Question four: In a tree diagram, how do you find the probability of a combined outcome across two stages? ... You multiply along the branches. Question five: What is the formula for conditional probability P of A given B? ... The number of outcomes in A AND B, divided by the total number of outcomes in B. --- SUMMARY AND SIGN-OFF — approximately 1 minute Let's wrap up. The big five things to take away from this episode are: one, all probabilities live between zero and one, and exhaustive outcomes sum to one. Two, use the complement for "at least one" problems. Three, multiply along branches in a tree diagram, and add probabilities of different branches that give the same result. Four, always adjust the denominator for without-replacement problems. And five, for conditional probability, restrict your sample space to the given condition. Probability is one of those topics where a few clear rules, applied carefully, can get you most of the marks. The examiner is not trying to trick you — they're testing whether you can apply these rules systematically and show your working clearly. You've got this. Good luck, and I'll see you in the next episode. --- END OF SCRIPT
Key Terms & Definitions
- Mutually Exclusive
- Events that cannot happen at the same time (e.g., rolling a 2 and rolling a 5 on a single die).
- Independent Events
- Events where the outcome of one does not affect the probability of the other.
- Dependent Events
- Events where the outcome of the first event changes the probability of the second event.
- Sample Space
- The set of all possible outcomes of an experiment.
- Exhaustive Events
- A set of events that covers all possible outcomes, meaning their probabilities must sum to 1.
- Conditional Probability
- The probability of an event occurring given that another event has already occurred.
Worked Examples
Worked Example
Question: A bag contains 7 red counters and 3 blue counters. Two counters are taken at random from the bag without replacement. Calculate the probability that both counters are the same colour. (4 marks)
Solution: Step 1: Identify the two successful combined outcomes: (Red AND Red) OR (Blue AND Blue). Step 2: Calculate P(Red, Red). First pick is 7/10. Second pick (without replacement) is 6/9. P(R,R) = (7/10) × (6/9) = 42/90. Step 3: Calculate P(Blue, Blue). First pick is 3/10. Second pick is 2/9. P(B,B) = (3/10) × (2/9) = 6/90. Step 4: Add the probabilities of the mutually exclusive outcomes. P(Same Colour) = 42/90 + 6/90 = 48/90. Final answer: 48/90 (or 8/15)
Worked Example
Question: In a class of 30 students, 18 study History, 15 study Geography, and 4 study neither. A student is chosen at random. Given that the student studies History, calculate the probability that they also study Geography. (3 marks)
Solution: Step 1: Find the number of students who study both. Total students = 30. Students studying at least one subject = 30 - 4 = 26. Sum of History and Geography = 18 + 15 = 33. Intersection (both) = 33 - 26 = 7. Step 2: Identify the restricted sample space. The question states 'Given that the student studies History', so the denominator is the total number of History students (18). Step 3: Calculate the conditional probability. The numerator is the number of students who study both (7). Final answer: 7/18
Worked Example
Question: The probability that a biased coin lands on heads is 0.6. The coin is flipped 3 times. Calculate the probability that it lands on heads at least once. (3 marks)
Solution: Step 1: Recognise that calculating 'at least one' directly requires finding P(1 head) + P(2 heads) + P(3 heads), which is time-consuming. Use the complement rule instead. Step 2: Find the probability of the complement (getting NO heads, i.e., 3 tails). P(Tails) = 1 - 0.6 = 0.4. Step 3: Calculate P(3 Tails) = 0.4 × 0.4 × 0.4 = 0.064. Step 4: Subtract from 1 to find P(at least one head). P(At least one head) = 1 - 0.064 = 0.936. Final answer: 0.936
Practice Questions
Question: A fair six-sided die is rolled. What is the probability of rolling a prime number?
Answer:
Question: The probability that a train is late is 0.15. Calculate the probability that the train is not late.
Answer:
Question: A box contains 5 strawberry chocolates, 4 orange chocolates, and 3 caramel chocolates. Sarah takes a chocolate at random, eats it, and then takes a second chocolate. Calculate the probability that she eats two strawberry chocolates.
Answer:
Question: In a group of 50 people, 30 own a dog, 22 own a cat, and 8 own neither. A person is chosen at random. Given that they own a dog, what is the probability that they also own a cat?
Answer:
Question: A spinner has 4 sections coloured Red, Blue, Green, and Yellow. The probability of landing on Red is 0.2 and Blue is 0.3. The probability of landing on Green is twice the probability of landing on Yellow. Calculate the probability of landing on Green.
Answer: