Subject: Mathematics | Level: GCSE | Exam Board: OCR
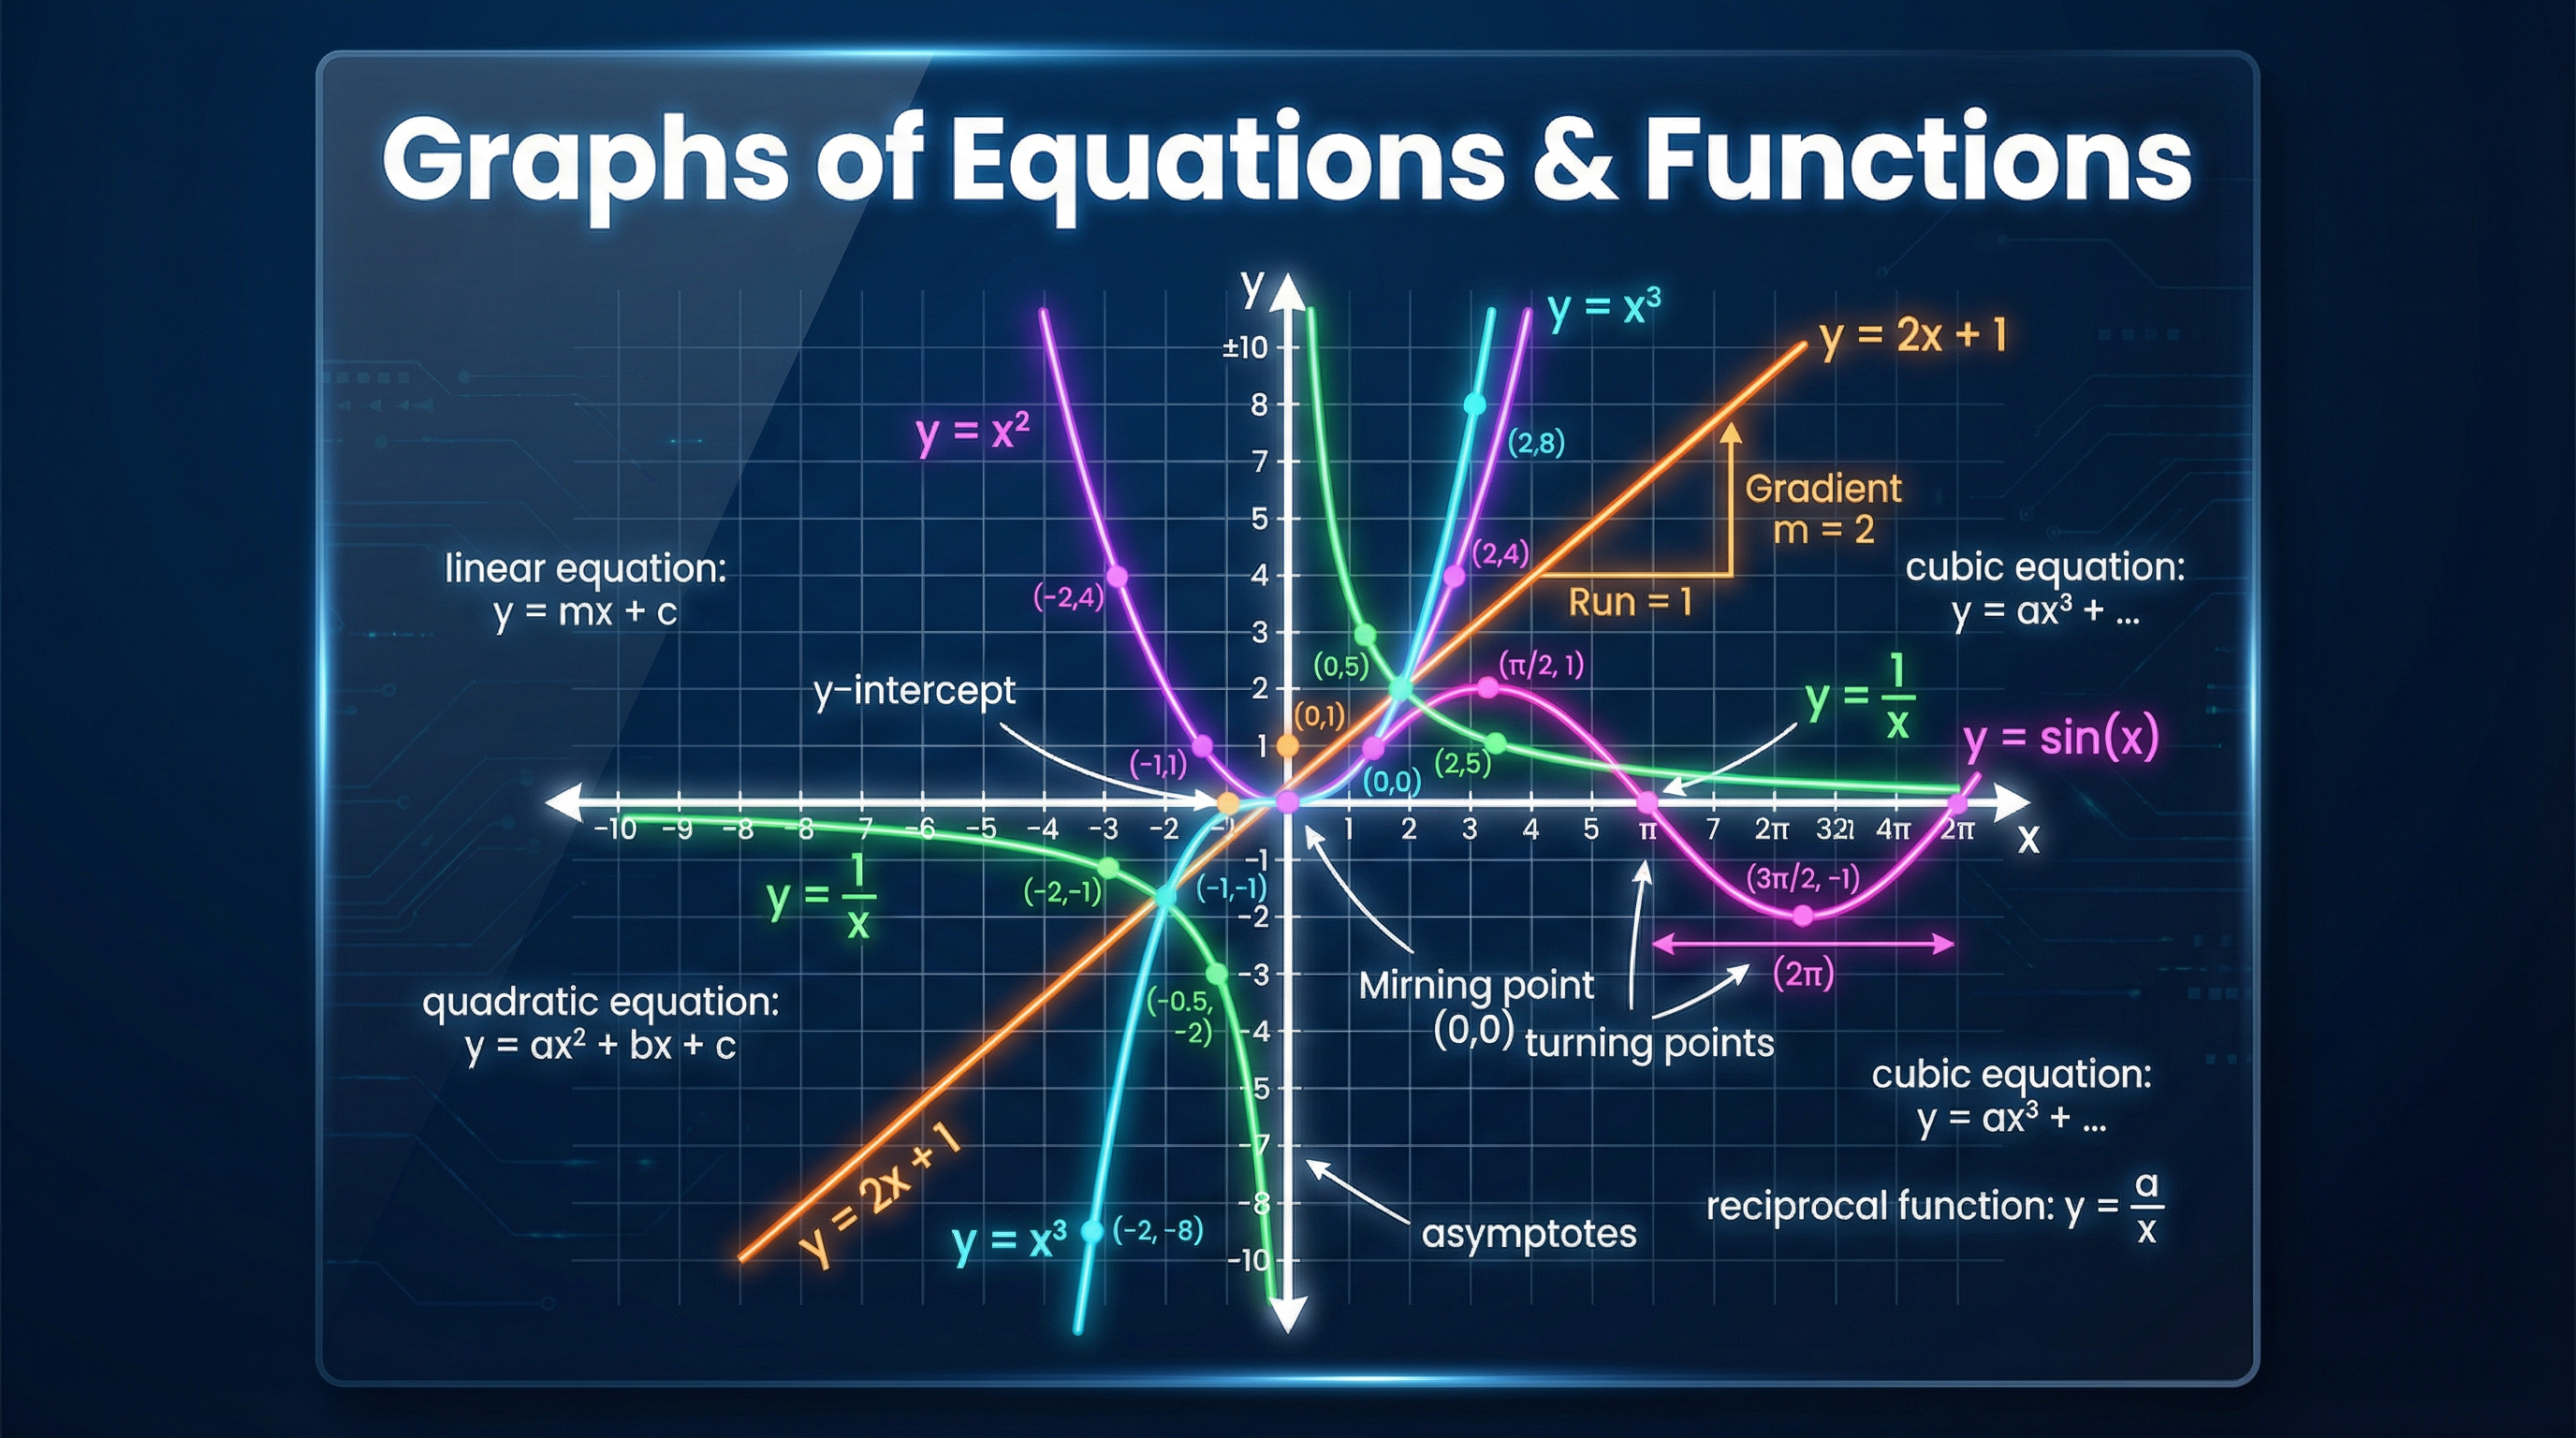
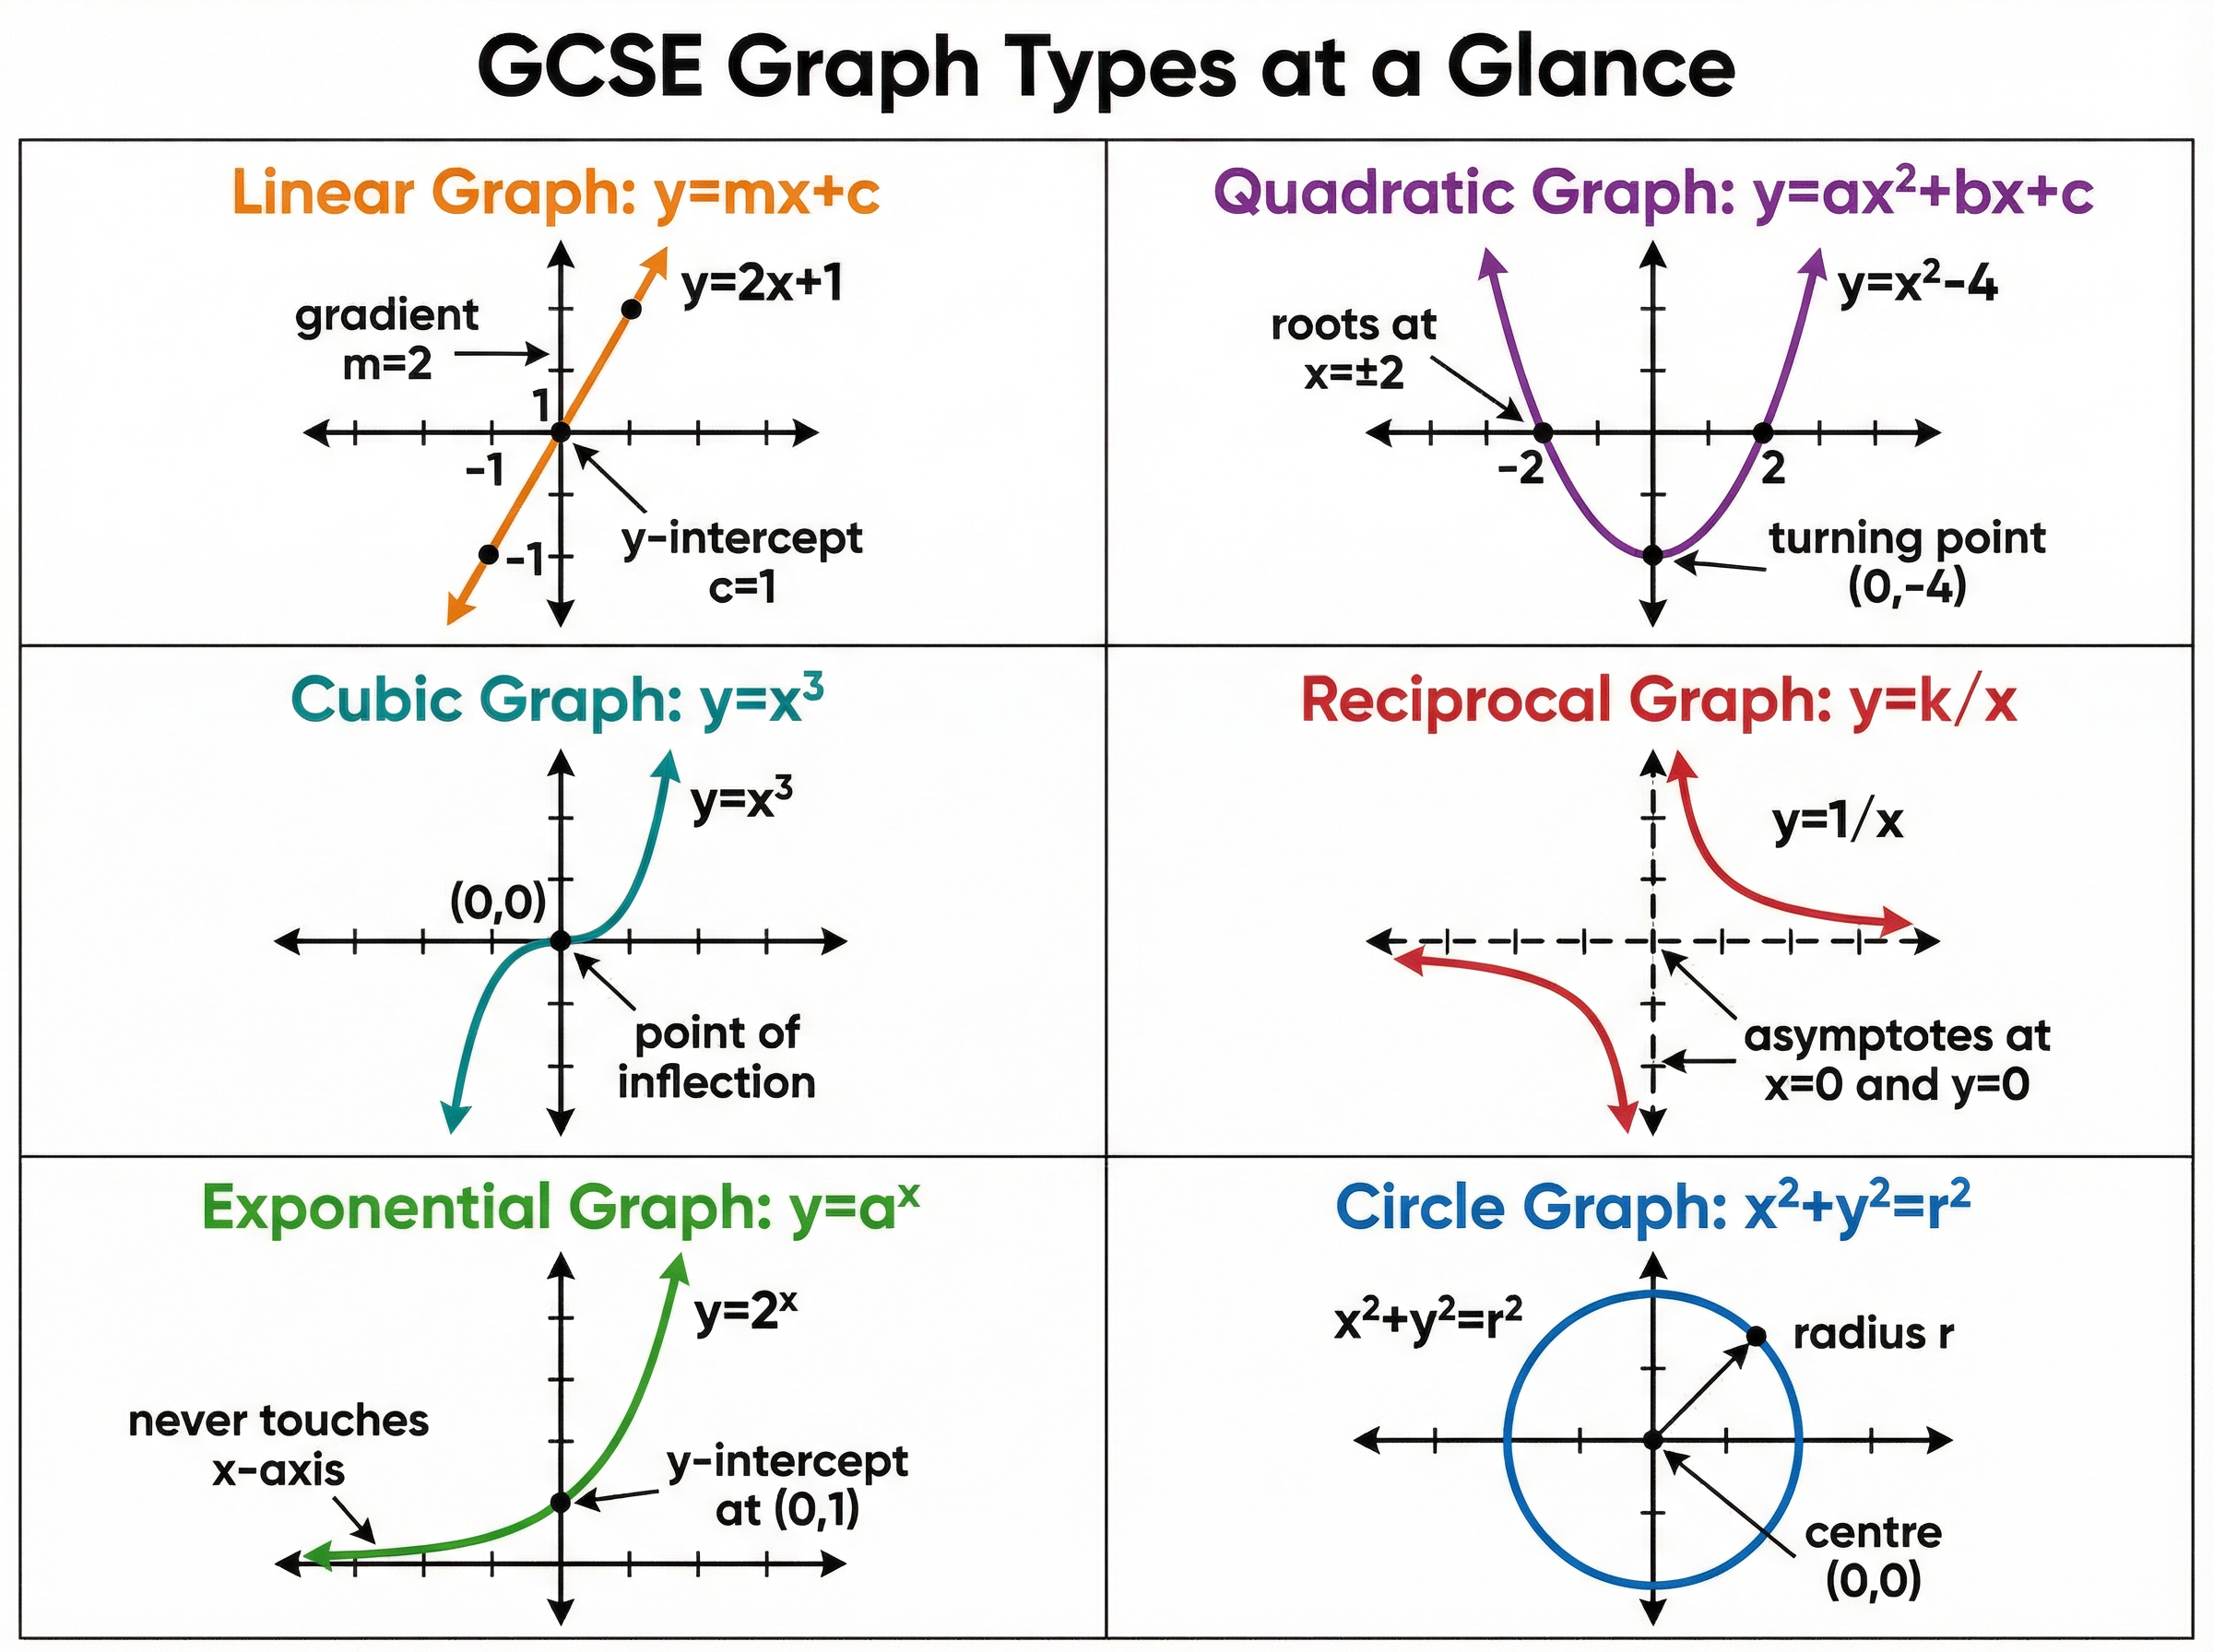
Master the visual language of Mathematics. This comprehensive guide covers linear, quadratic, cubic, reciprocal, exponential, and circle graphs, showing you exactly how to secure top marks in every graph question.
Revision Notes & Key Concepts
Key Terms & Definitions
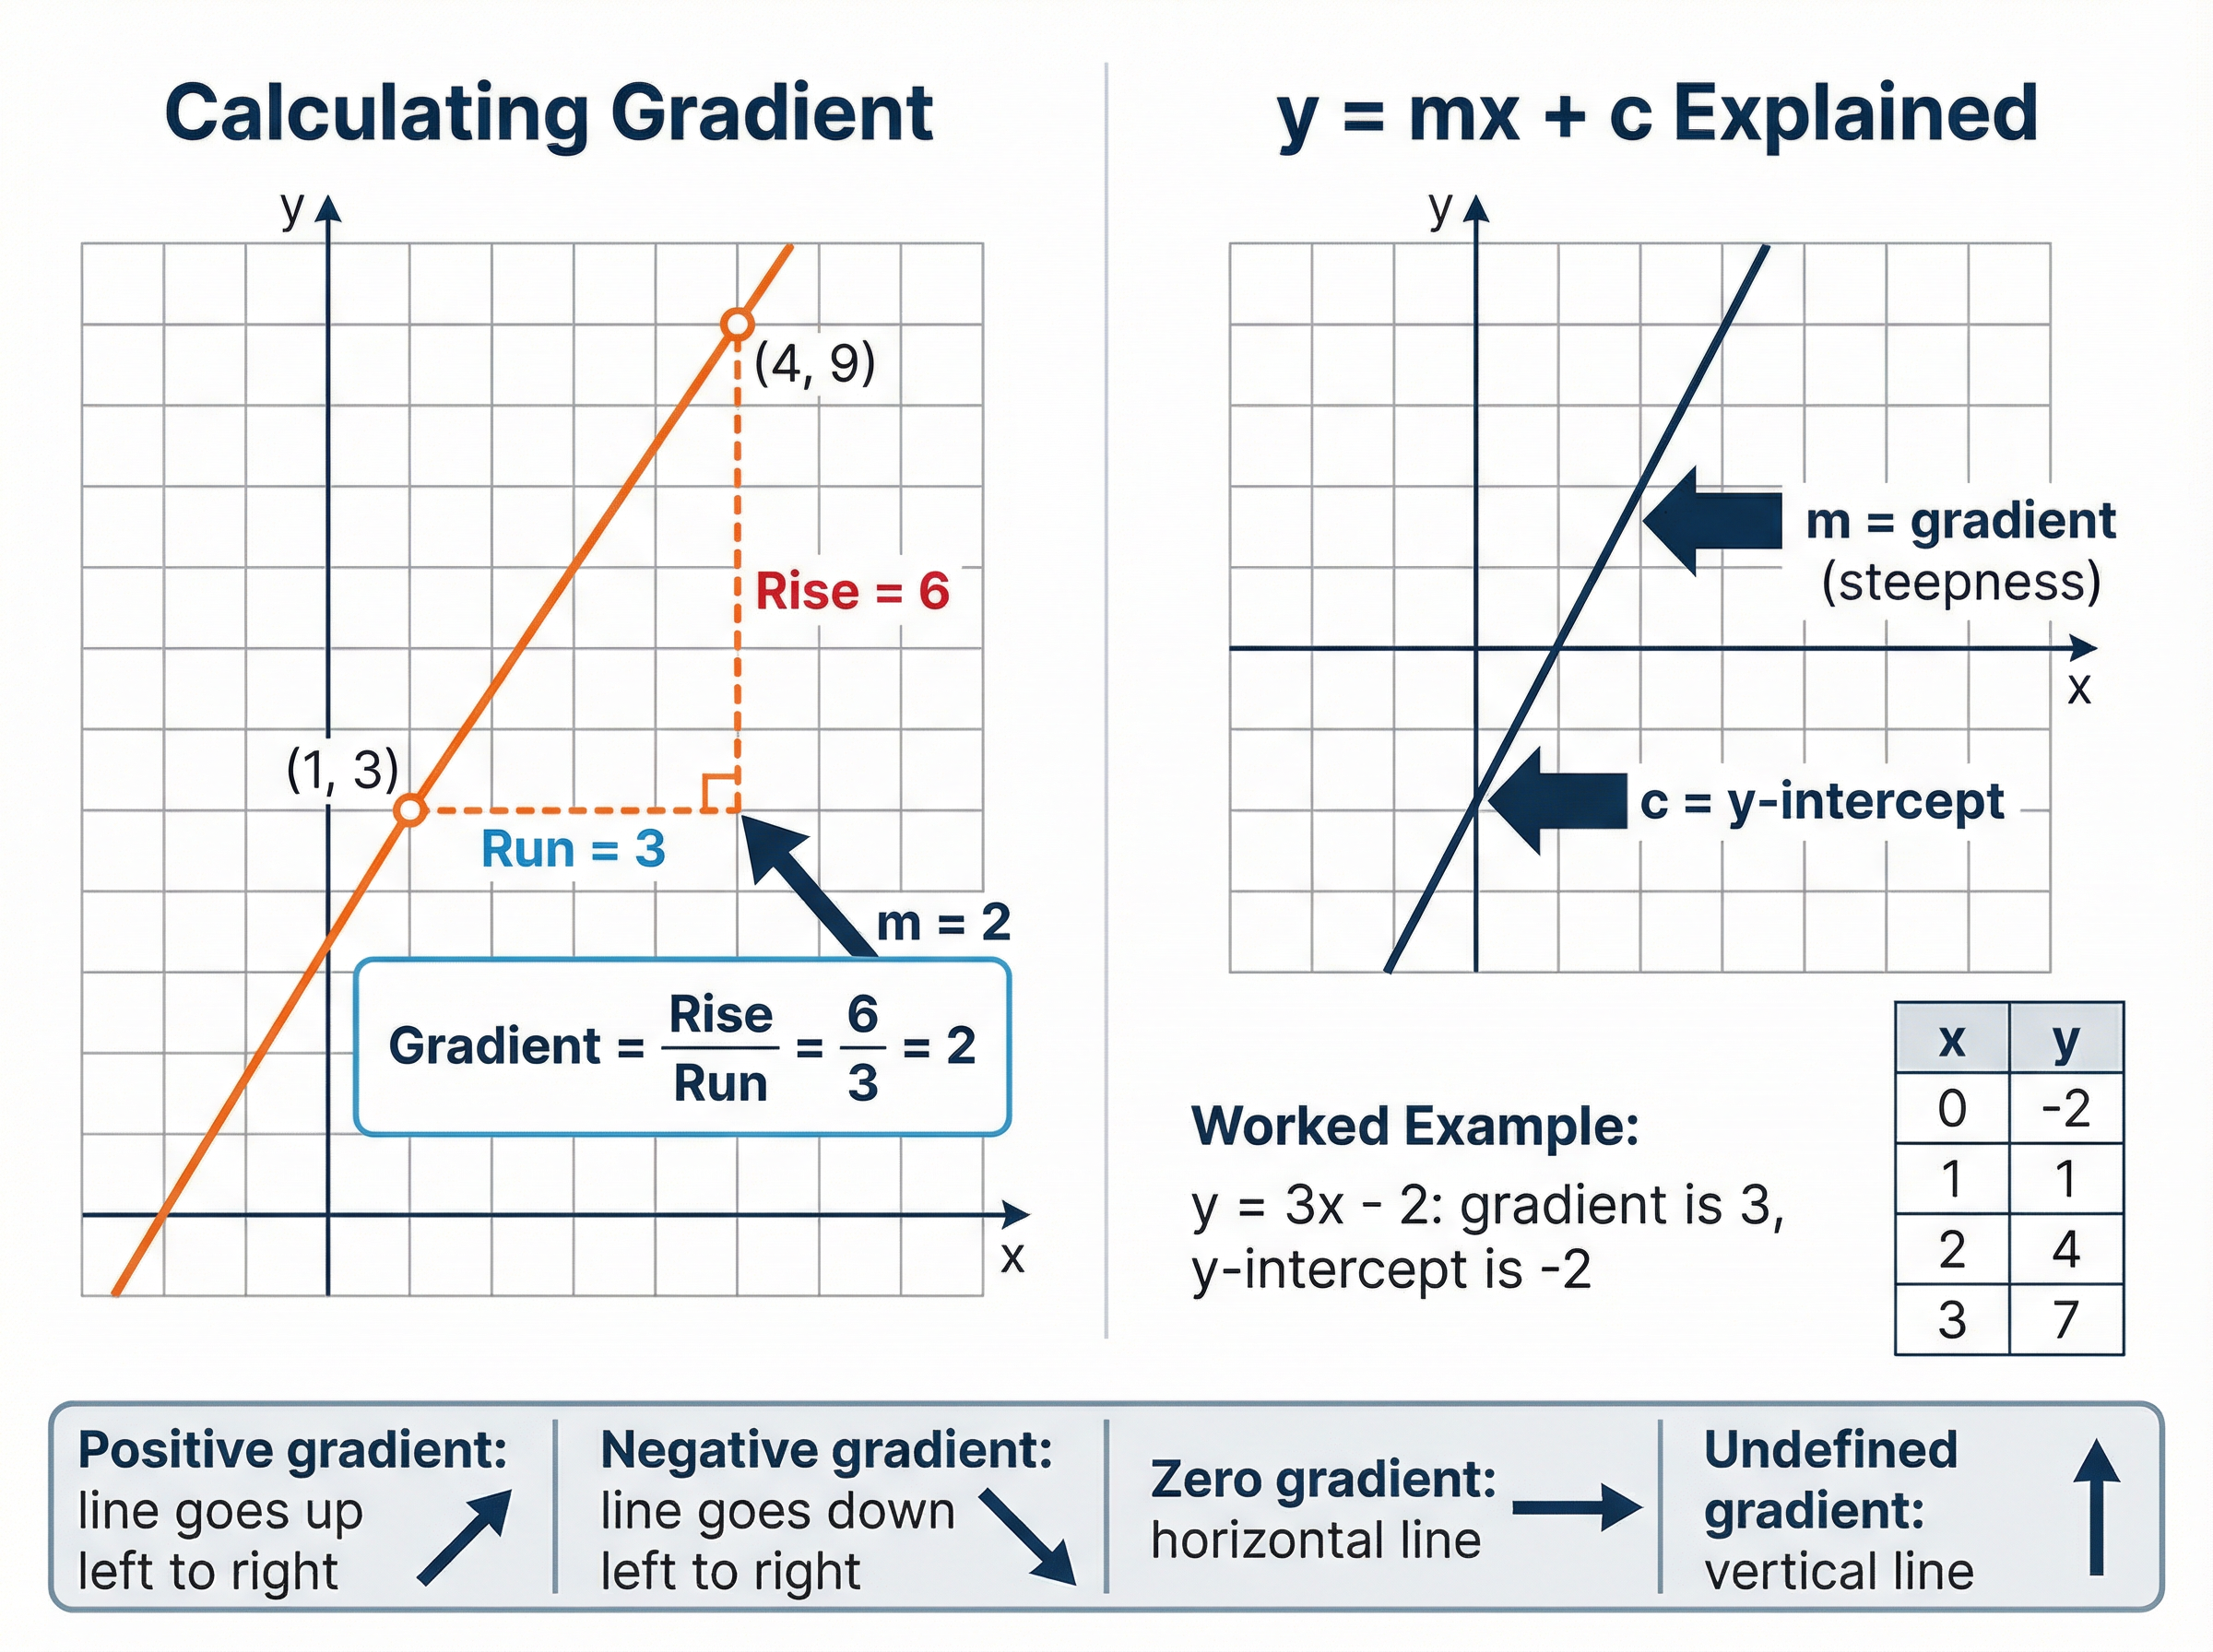
- Gradient
- A measure of the steepness of a line, calculated as the change in y divided by the change in x.
- y-intercept
- The point where a graph crosses the y-axis, occurring when x = 0.
- Root
- A solution to an equation, represented graphically as the point(s) where the curve crosses the x-axis (where y = 0).
- Turning Point
- The local maximum or minimum point on a curve where the gradient is exactly zero.
- Asymptote
- A straight line that a curve approaches infinitely closely but never touches or crosses.
- Tangent
- A straight line that touches a curve at exactly one point without crossing it.
Worked Examples
Worked Example
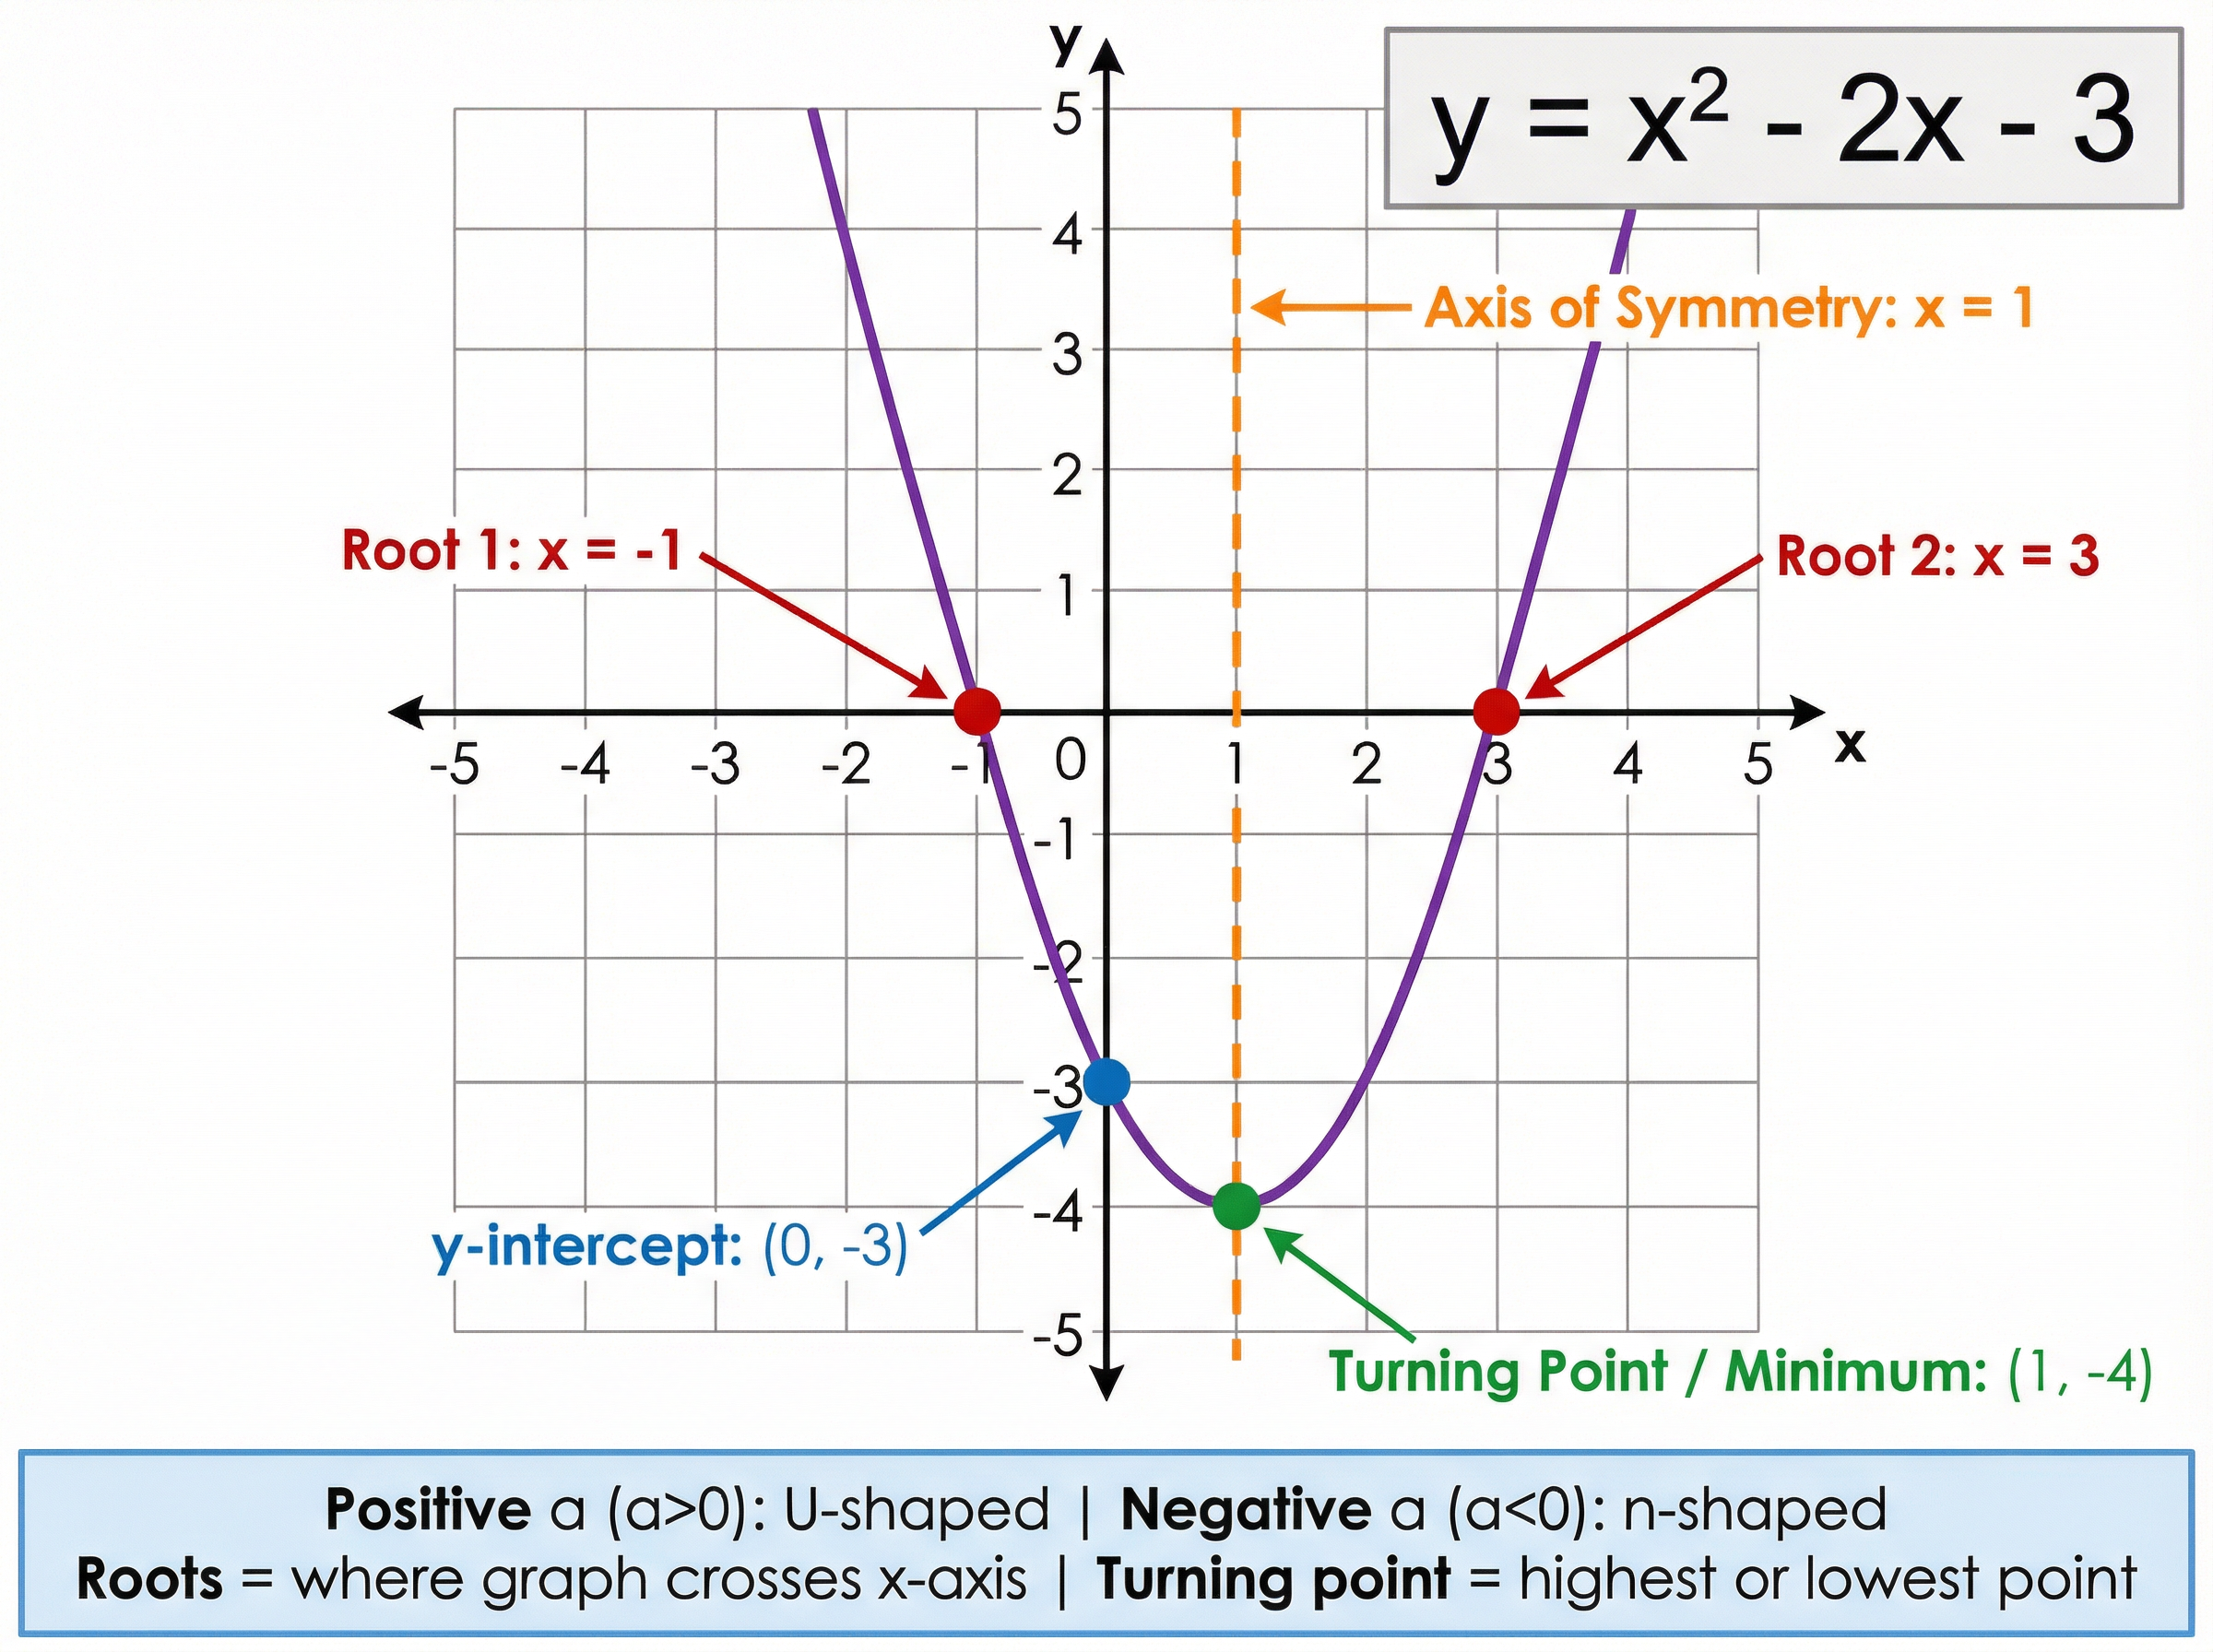
Question: (a) Complete the table of values for $y = x^2 - 2x - 3$. (b) On the grid, draw the graph of $y = x^2 - 2x - 3$ for values of $x$ from -2 to 4. (c) Use your graph to find estimates for the solutions of $x^2 - 2x - 3 = 0$.
Solution: Step 1: Calculate missing y-values by substituting x into the equation. When $x = -2$: $y = (-2)^2 - 2(-2) - 3 = 4 + 4 - 3 = 5$ When $x = 1$: $y = (1)^2 - 2(1) - 3 = 1 - 2 - 3 = -4$ Step 2: Plot the points accurately on the grid: (-2,5), (-1,0), (0,-3), (1,-4), (2,-3), (3,0), (4,5). Step 3: Join the points with a smooth, continuous pencil curve. Step 4: For part (c), identify where the graph crosses the x-axis (where $y=0$). Final answer: The solutions are $x = -1$ and $x = 3$.
Worked Example
Question: A straight line $L$ passes through the points $A (2, 5)$ and $B (4, 11)$. Find the equation of line $L$.
Solution: Step 1: Find the gradient ($m$) using the formula. $m = \frac{11 - 5}{4 - 2} = \frac{6}{2} = 3$ Step 2: Substitute the gradient and one point into $y = mx + c$ to find $c$. Using point $A(2, 5)$: $5 = 3(2) + c$ $5 = 6 + c$ $c = -1$ Final answer: $y = 3x - 1$
Worked Example
Question: (Higher Tier) The point $P(3, 4)$ lies on the circle $x^2 + y^2 = 25$. Find the equation of the tangent to the circle at point $P$.
Solution: Step 1: Find the gradient of the radius connecting the origin $(0,0)$ to $P(3,4)$. Gradient of radius = $\frac{4 - 0}{3 - 0} = \frac{4}{3}$ Step 2: The tangent is perpendicular to the radius. Find the negative reciprocal to get the tangent's gradient. Gradient of tangent = $-\frac{3}{4}$ Step 3: Substitute the tangent gradient and point $P$ into $y = mx + c$. $4 = -\frac{3}{4}(3) + c$ $4 = -\frac{9}{4} + c$ $c = 4 + \frac{9}{4} = \frac{16}{4} + \frac{9}{4} = \frac{25}{4}$ Final answer: $y = -\frac{3}{4}x + \frac{25}{4}$ (or $4y = -3x + 25$)
Practice Questions
Question: A straight line has the equation $y = 4x - 5$. Write down the gradient and the coordinates of the y-intercept.
Answer:
Question: The graphs of $y = 2x + 1$ and $y = x^2 - 2$ intersect at two points. Find the coordinates of these points algebraically.
Answer:
Question: (Higher Tier) Sketch the graph of $y = \cos(x)$ for $0^\circ \leq x \leq 360^\circ$. Label the coordinates of any intercepts with the coordinate axes.
Answer:
Question: A curve has the equation $y = x^3 - 4x$. Find the coordinates of the points where the curve crosses the x-axis.
Answer:
Question: The velocity-time graph of a car is shown. Estimate the acceleration of the car at $t = 4$ seconds.
Answer: