OCR · GCSE · Physics
Velocity
Master OCR GCSE Physics Topic 1.4: Velocity — a topic that goes far beyond simply knowing how fast something is going. This guide demystifies the crucial distinction between scalar and vector quantities, provides a deep dive into interpreting distance-time and velocity-time graphs, and offers examiner-approved strategies for applying the SUVAT equations of motion to secure top marks. Every section is written with the mark scheme in mind, so you know exactly what examiners are looking for.
- 8 min read
- 3 worked examples
- 5 practice questions
- 8 key terms
Study Notes
Overview
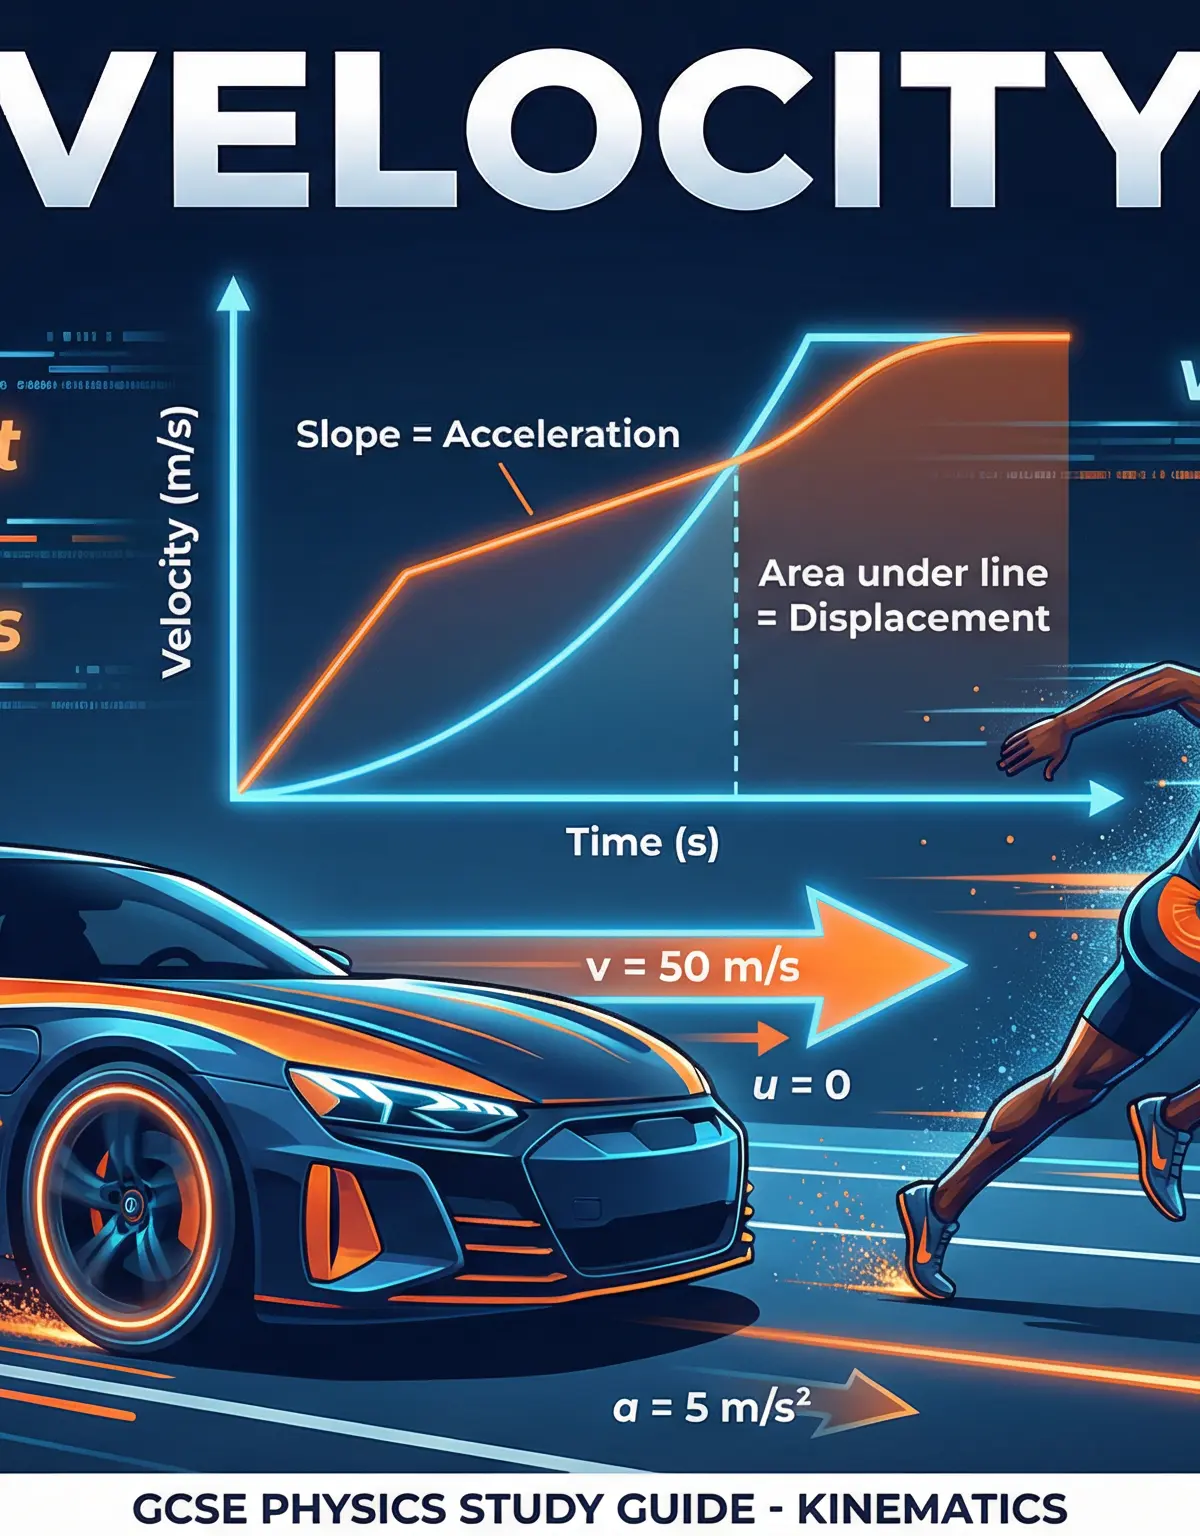
Welcome to your deep dive into Velocity, OCR GCSE Physics specification point 1.4. This topic is a cornerstone of mechanics, exploring how we describe and calculate the motion of objects with precision. It is not simply about how fast something is going; it is about how fast it is going and in which direction. This distinction between speed (a scalar quantity) and velocity (a vector quantity) is fundamental to the entire topic and a recurring source of marks in OCR examinations. Understanding this topic thoroughly is crucial, as it forms the bedrock for more advanced concepts including forces, momentum, and energy transfer.
OCR examiners frequently test these concepts through a combination of graphical analysis questions — requiring candidates to interpret and calculate from distance-time and velocity-time graphs — and mathematical problems requiring the application of the equations of motion (SUVAT). Candidates should expect questions using command words such as 'Calculate', 'Describe', 'Explain', and 'Determine', often set in real-world contexts such as vehicle journeys, sports, or falling objects. Assessment Objective weightings for this topic are AO1 (30%), AO2 (40%), and AO3 (30%), meaning the majority of marks reward application and analysis rather than simple recall.
Key Concepts
Concept 1: Scalar vs. Vector Quantities
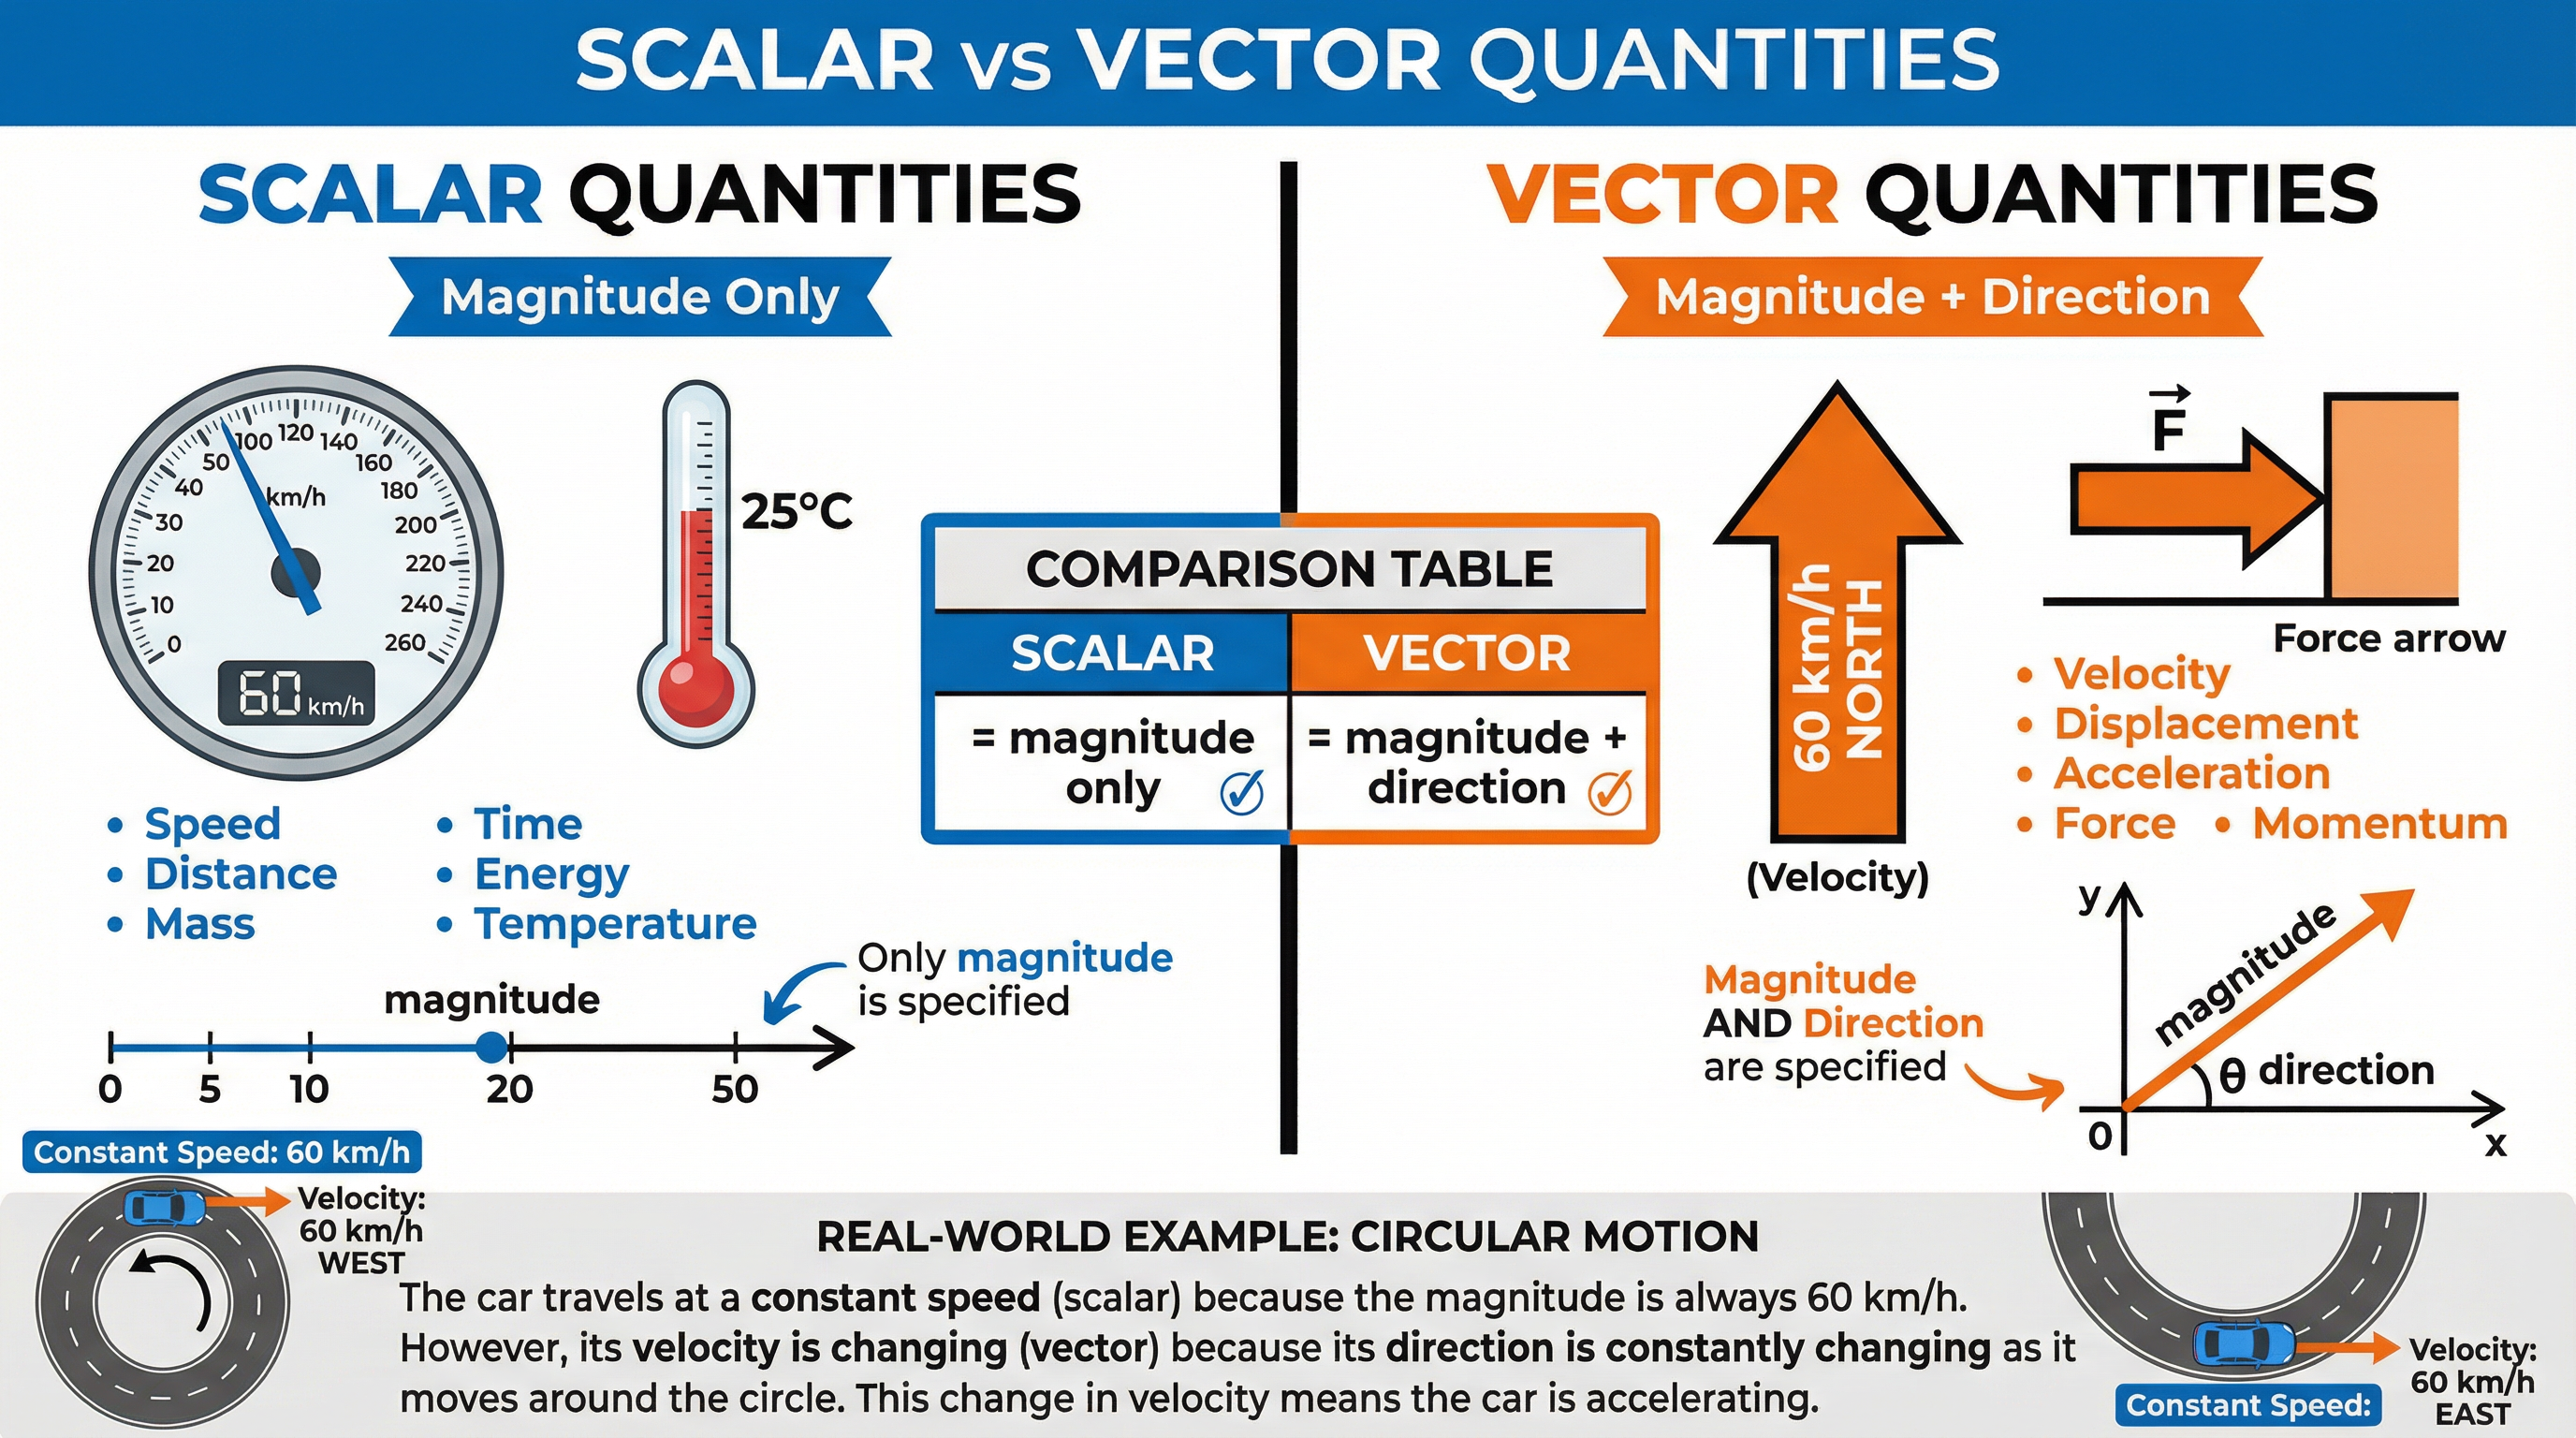
In physics, every measurable quantity is classified as either a scalar or a vector. This is a critical distinction that underpins the entire topic of velocity.
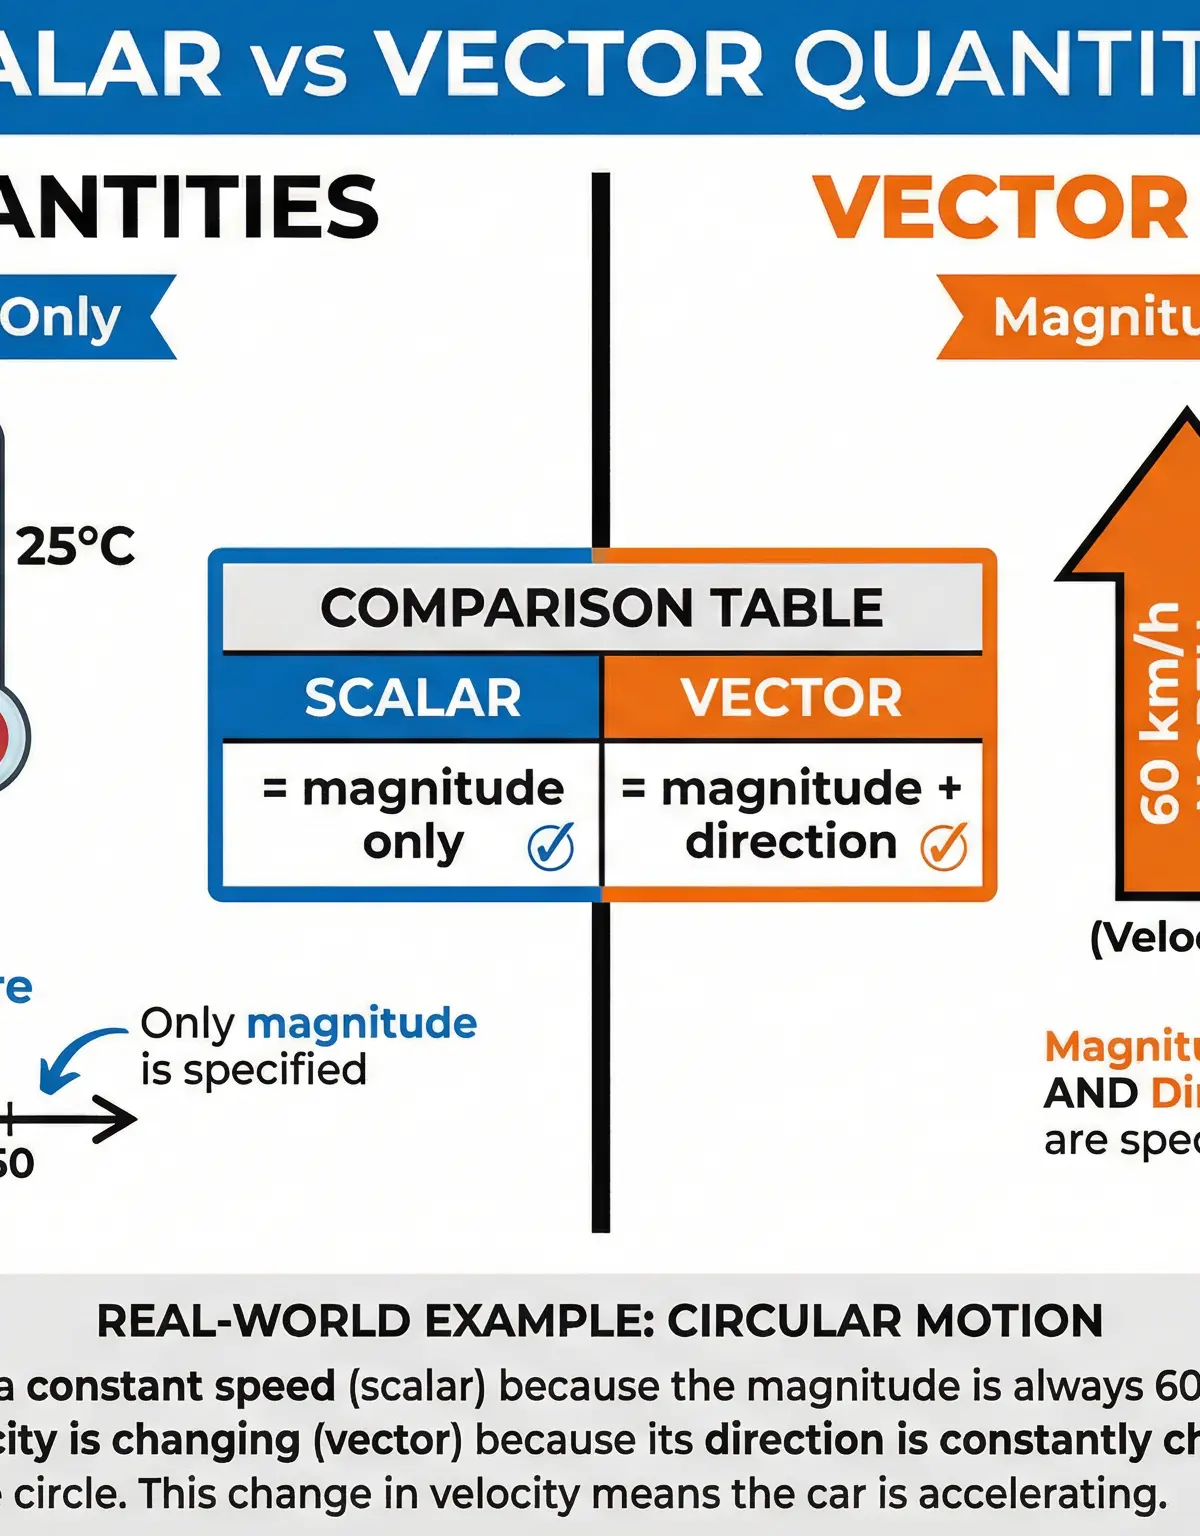
A scalar quantity possesses magnitude (size) only. No directional information is associated with it. Common examples include distance (e.g., 50 metres), speed (e.g., 20 m/s), mass (e.g., 5 kg), time (e.g., 10 seconds), temperature, and energy.
A vector quantity possesses both magnitude AND direction. The direction is an inseparable part of the quantity's definition. Common examples include displacement (e.g., 50 metres North), velocity (e.g., 20 m/s East), acceleration (e.g., 9.8 m/s² downwards), force (e.g., 100 N upwards), and momentum.
The OCR mark scheme awards 1 mark specifically for stating that velocity is a vector quantity with both magnitude and direction. If a candidate writes only 'velocity is speed with direction' without explicitly mentioning magnitude, the mark may not be awarded. Precision in language is essential.
Real-World Example: A car driving around a roundabout at a constant speed of 30 km/h has a constant speed (scalar), but its velocity is continuously changing because its direction of travel is constantly changing. This means the car is technically always accelerating, even though its speed is constant. This is a concept that examiners use to test deeper understanding.
Concept 2: Distance vs. Displacement
Linked directly to the scalar/vector distinction is the difference between distance and displacement. These two terms are frequently confused, and this confusion costs candidates marks every year.
Distance is a scalar quantity. It measures the total length of the path travelled by an object, regardless of the direction of travel. If you walk 3 metres North and then 4 metres East, your total distance is 7 metres.
Displacement is a vector quantity. It measures the straight-line distance from the starting point to the finishing point, and it includes the direction. In the same example above, your displacement is 5 metres in a direction North-East of your starting point (calculated using Pythagoras: √(3² + 4²) = 5 m).
The key insight is that distance and displacement are only equal when an object travels in a perfectly straight line without changing direction. As soon as an object changes direction, the two values diverge.
Concept 3: Analysing Motion with Graphs
Graphical analysis is one of the most heavily examined skills in this topic. Candidates must be fluent in reading, interpreting, and calculating from both distance-time and velocity-time graphs.
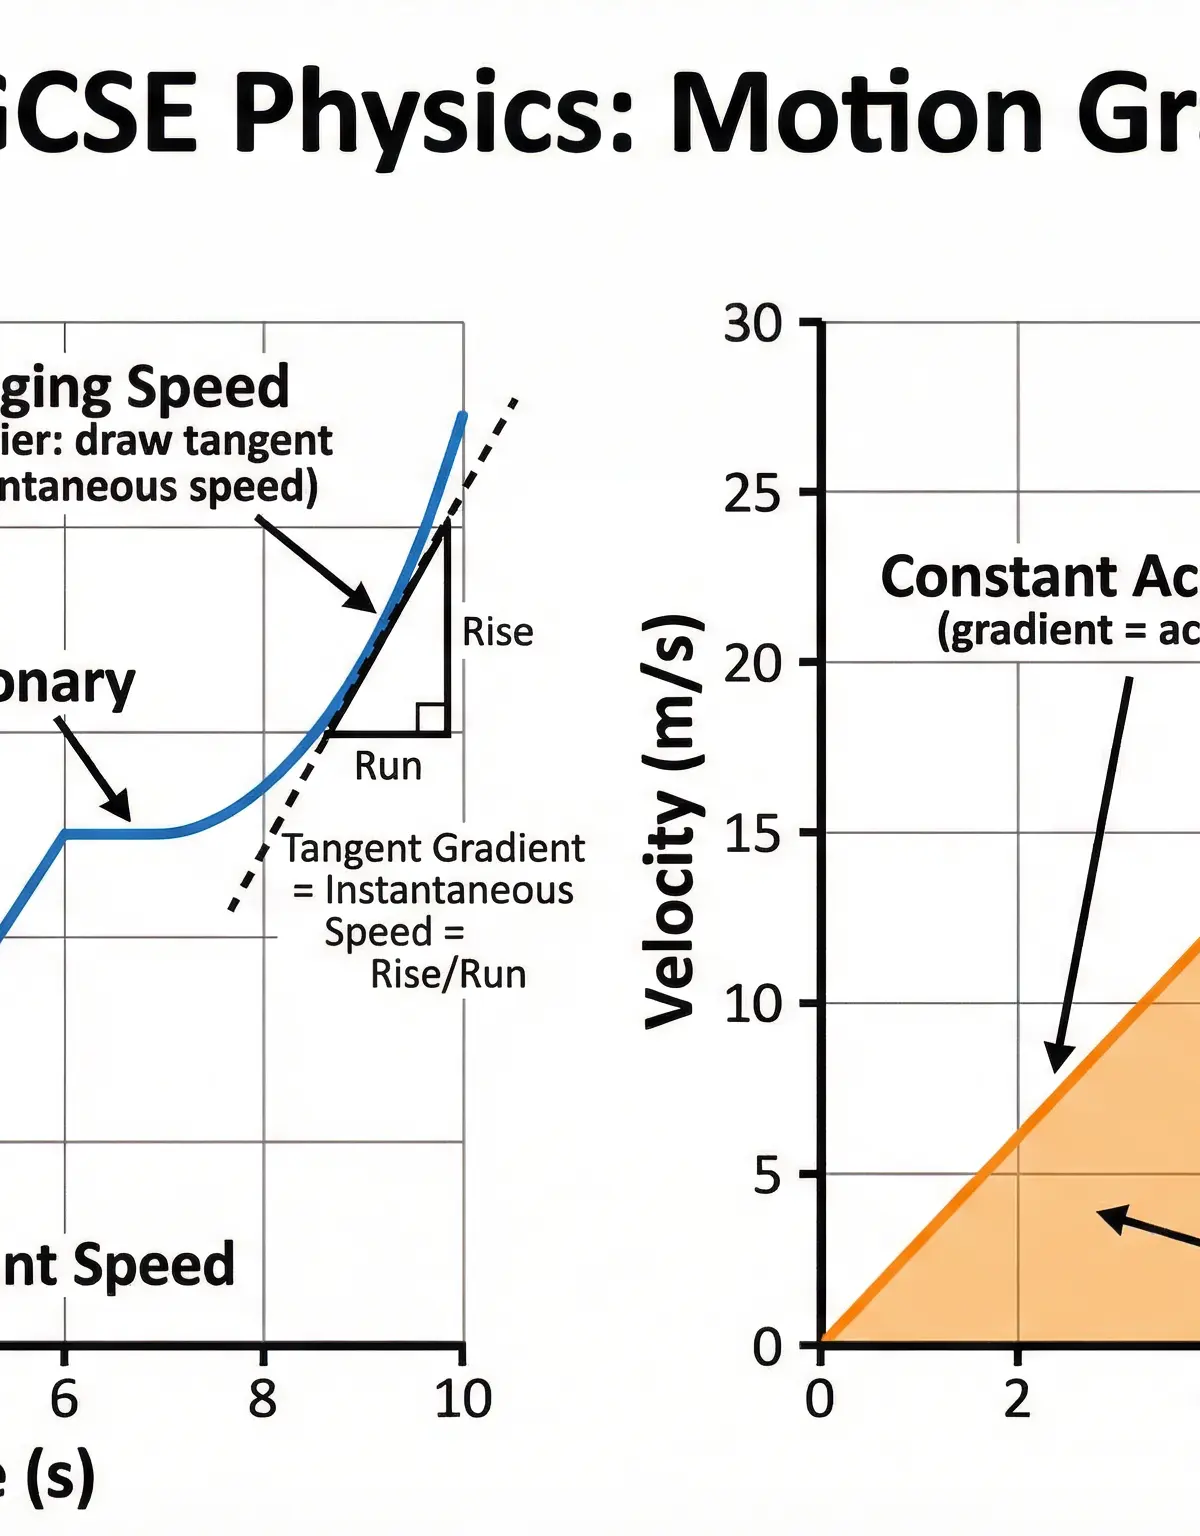
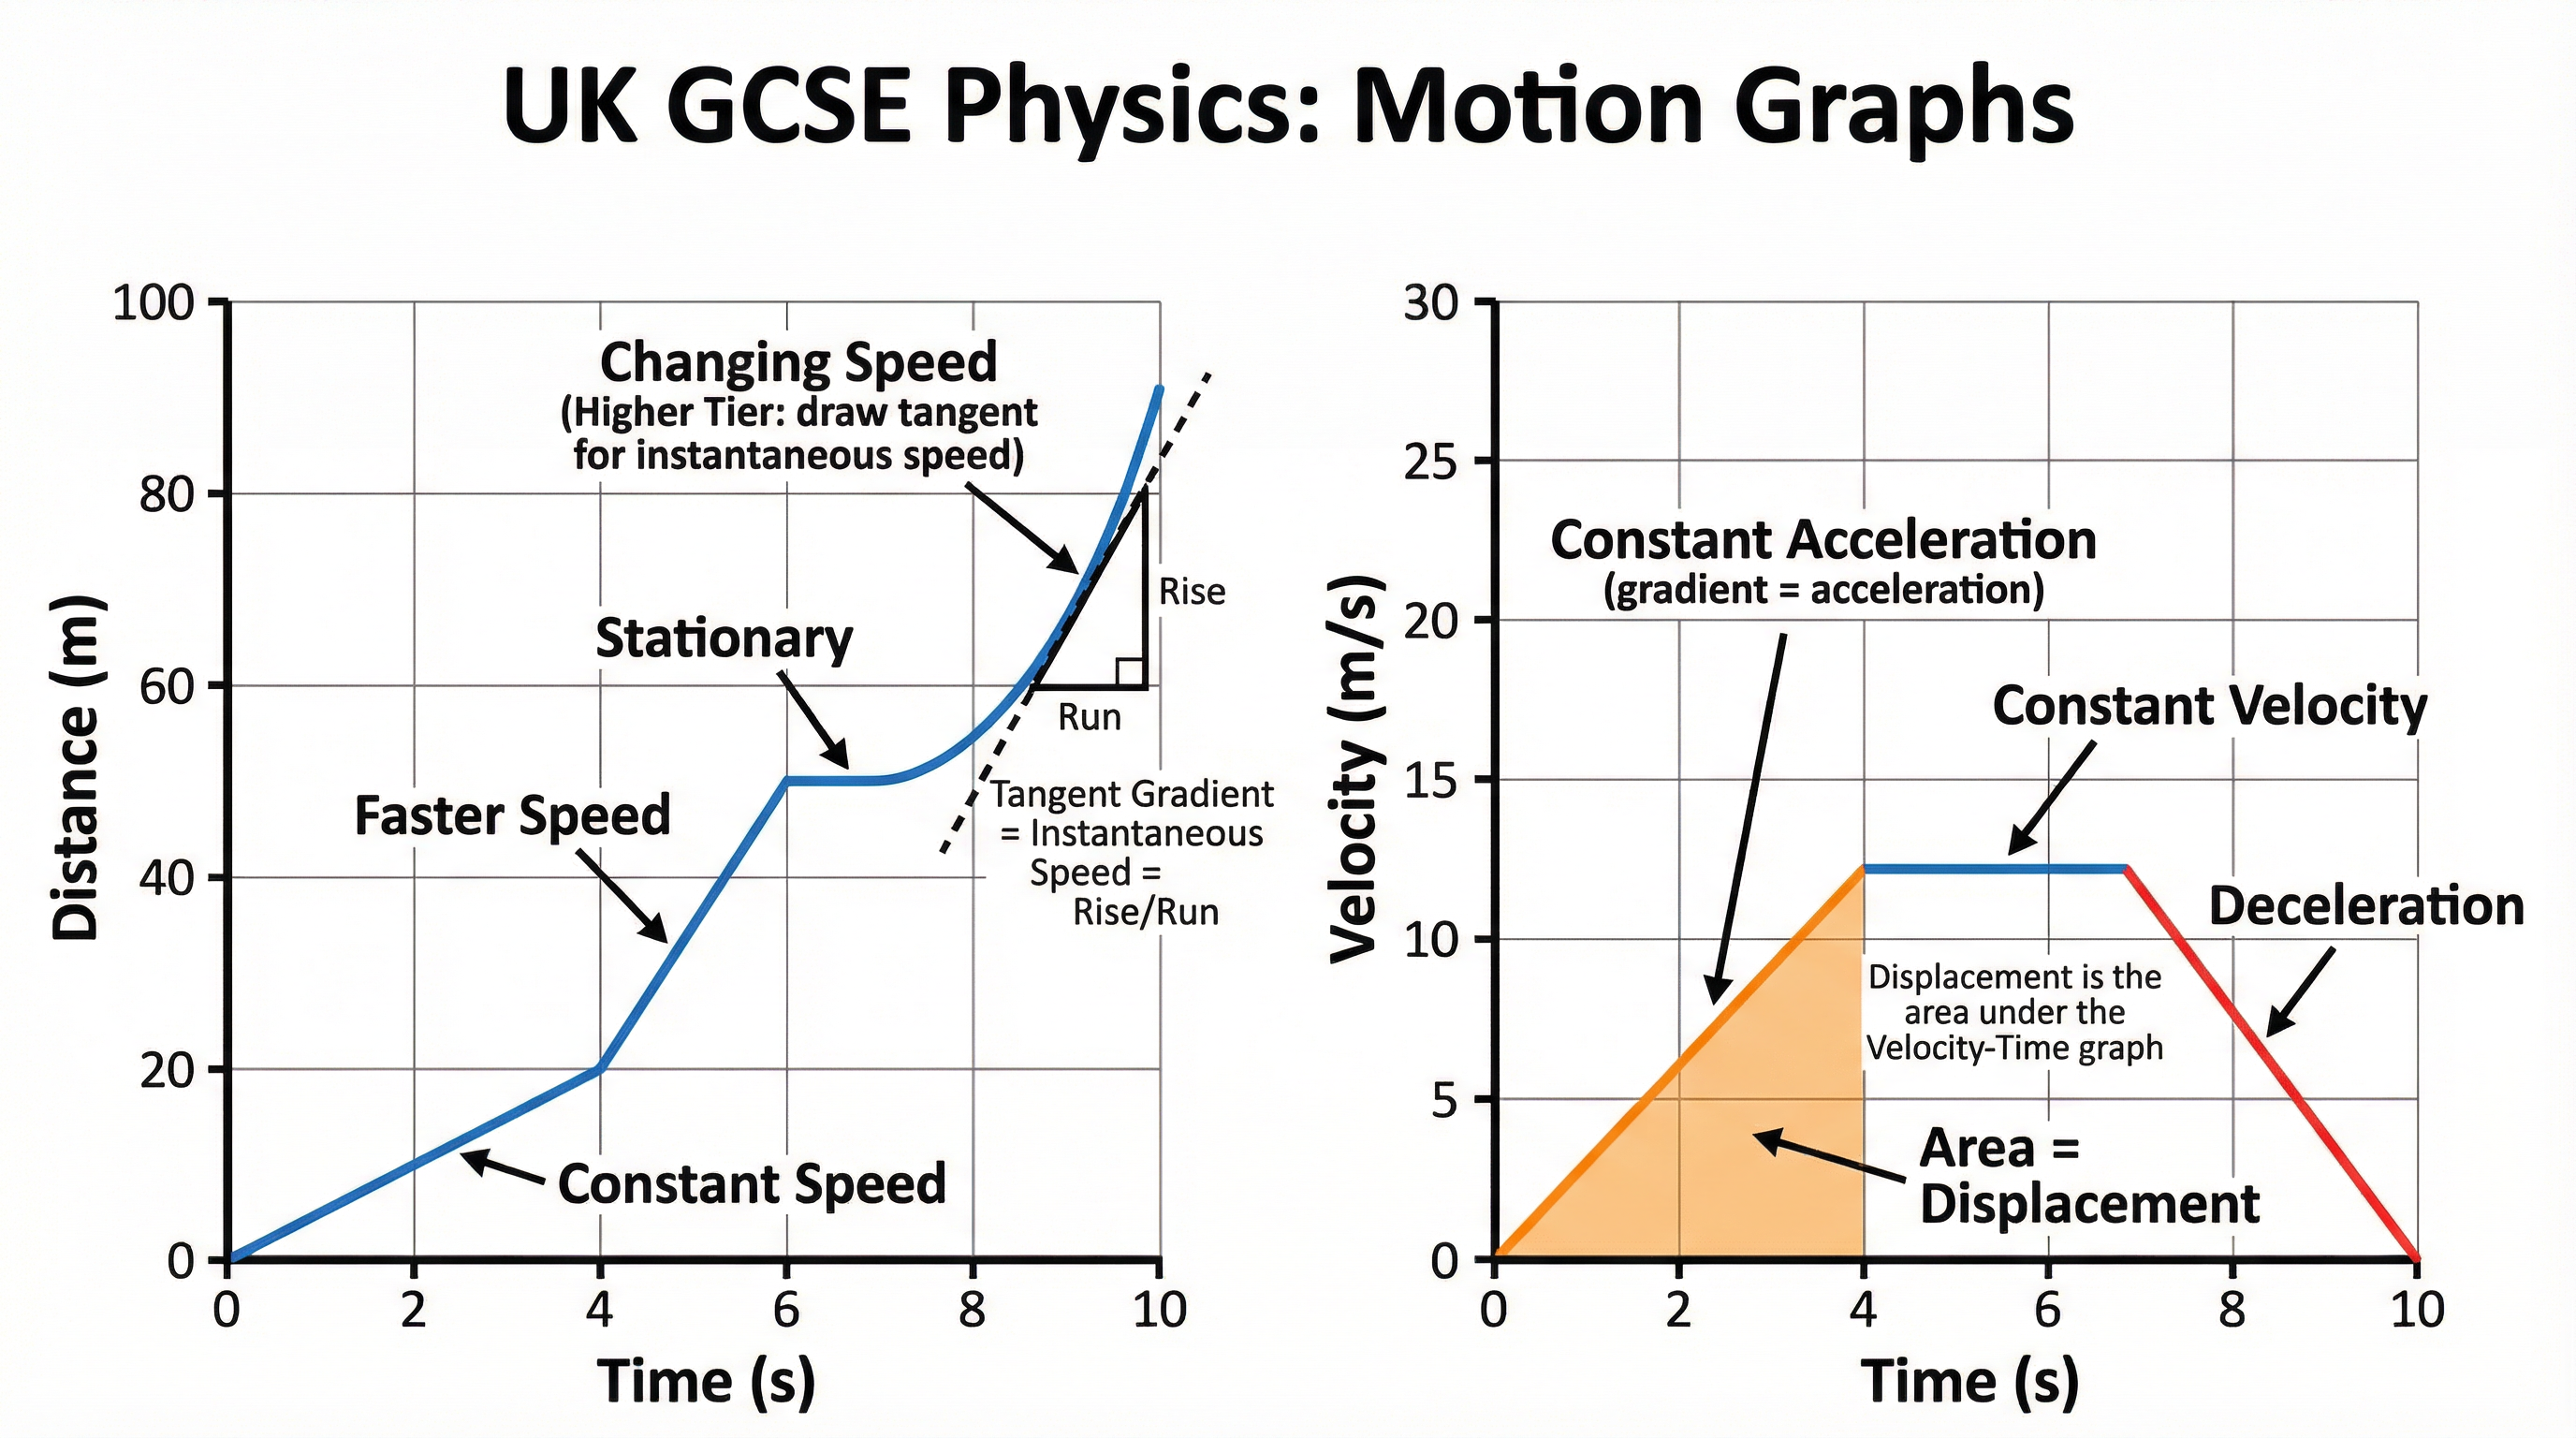
**Distance-Time Graphs (d-t graphs)**The gradient (steepness) of a distance-time graph represents the speed of the object. A steeper gradient indicates a faster speed. The key features to recognise are as follows. A straight, diagonal line indicates constant speed. A horizontal line (gradient = 0) indicates that the object is stationary — the distance is not changing. A curved line indicates that the speed is changing (the object is accelerating or decelerating).
For Higher Tier candidates, when the graph shows a curve, the question may ask for the instantaneous speed at a specific moment. This requires drawing a tangent to the curve at that point and calculating the gradient of the tangent (rise ÷ run). The larger the triangle drawn, the more accurate the result.
**Velocity-Time Graphs (v-t graphs)**The gradient of a velocity-time graph represents the acceleration of the object. The area under a velocity-time graph represents the displacement of the object. The key features are as follows. A straight, upward-sloping line indicates constant acceleration. A horizontal line indicates constant velocity (acceleration = 0, but the object is still moving). A straight, downward-sloping line indicates constant deceleration. A line crossing the time axis indicates the object has reversed direction.
A critical and frequently tested point: a horizontal line on a velocity-time graph does NOT mean the object is stationary. It means the object is travelling at a constant velocity. This is one of the most common errors in OCR examinations.
Concept 4: The Equations of Motion (SUVAT)
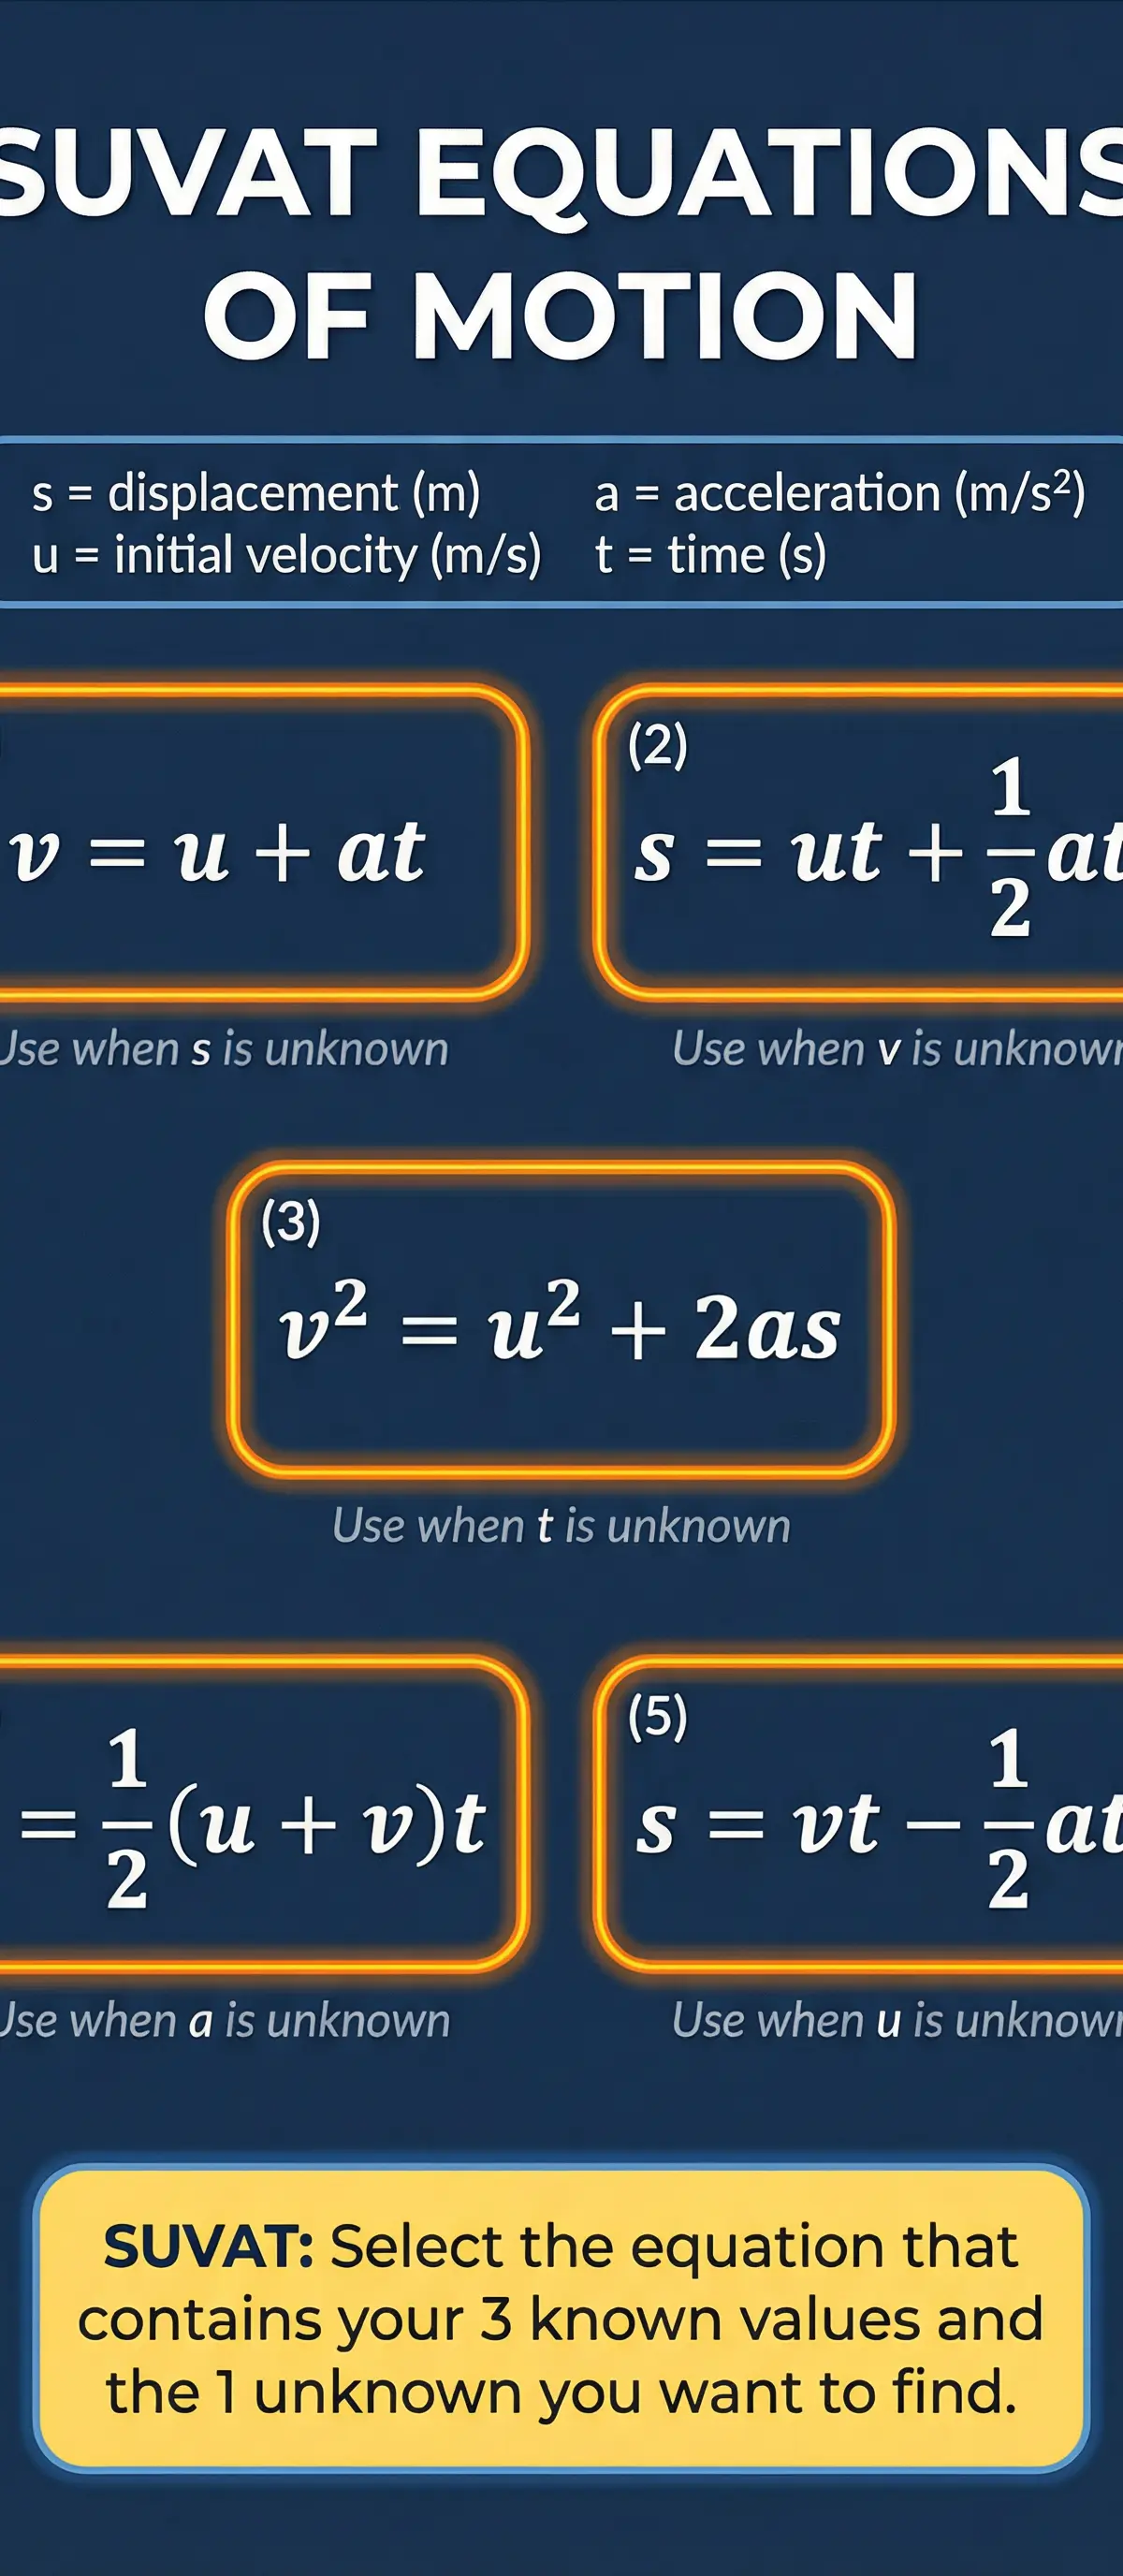
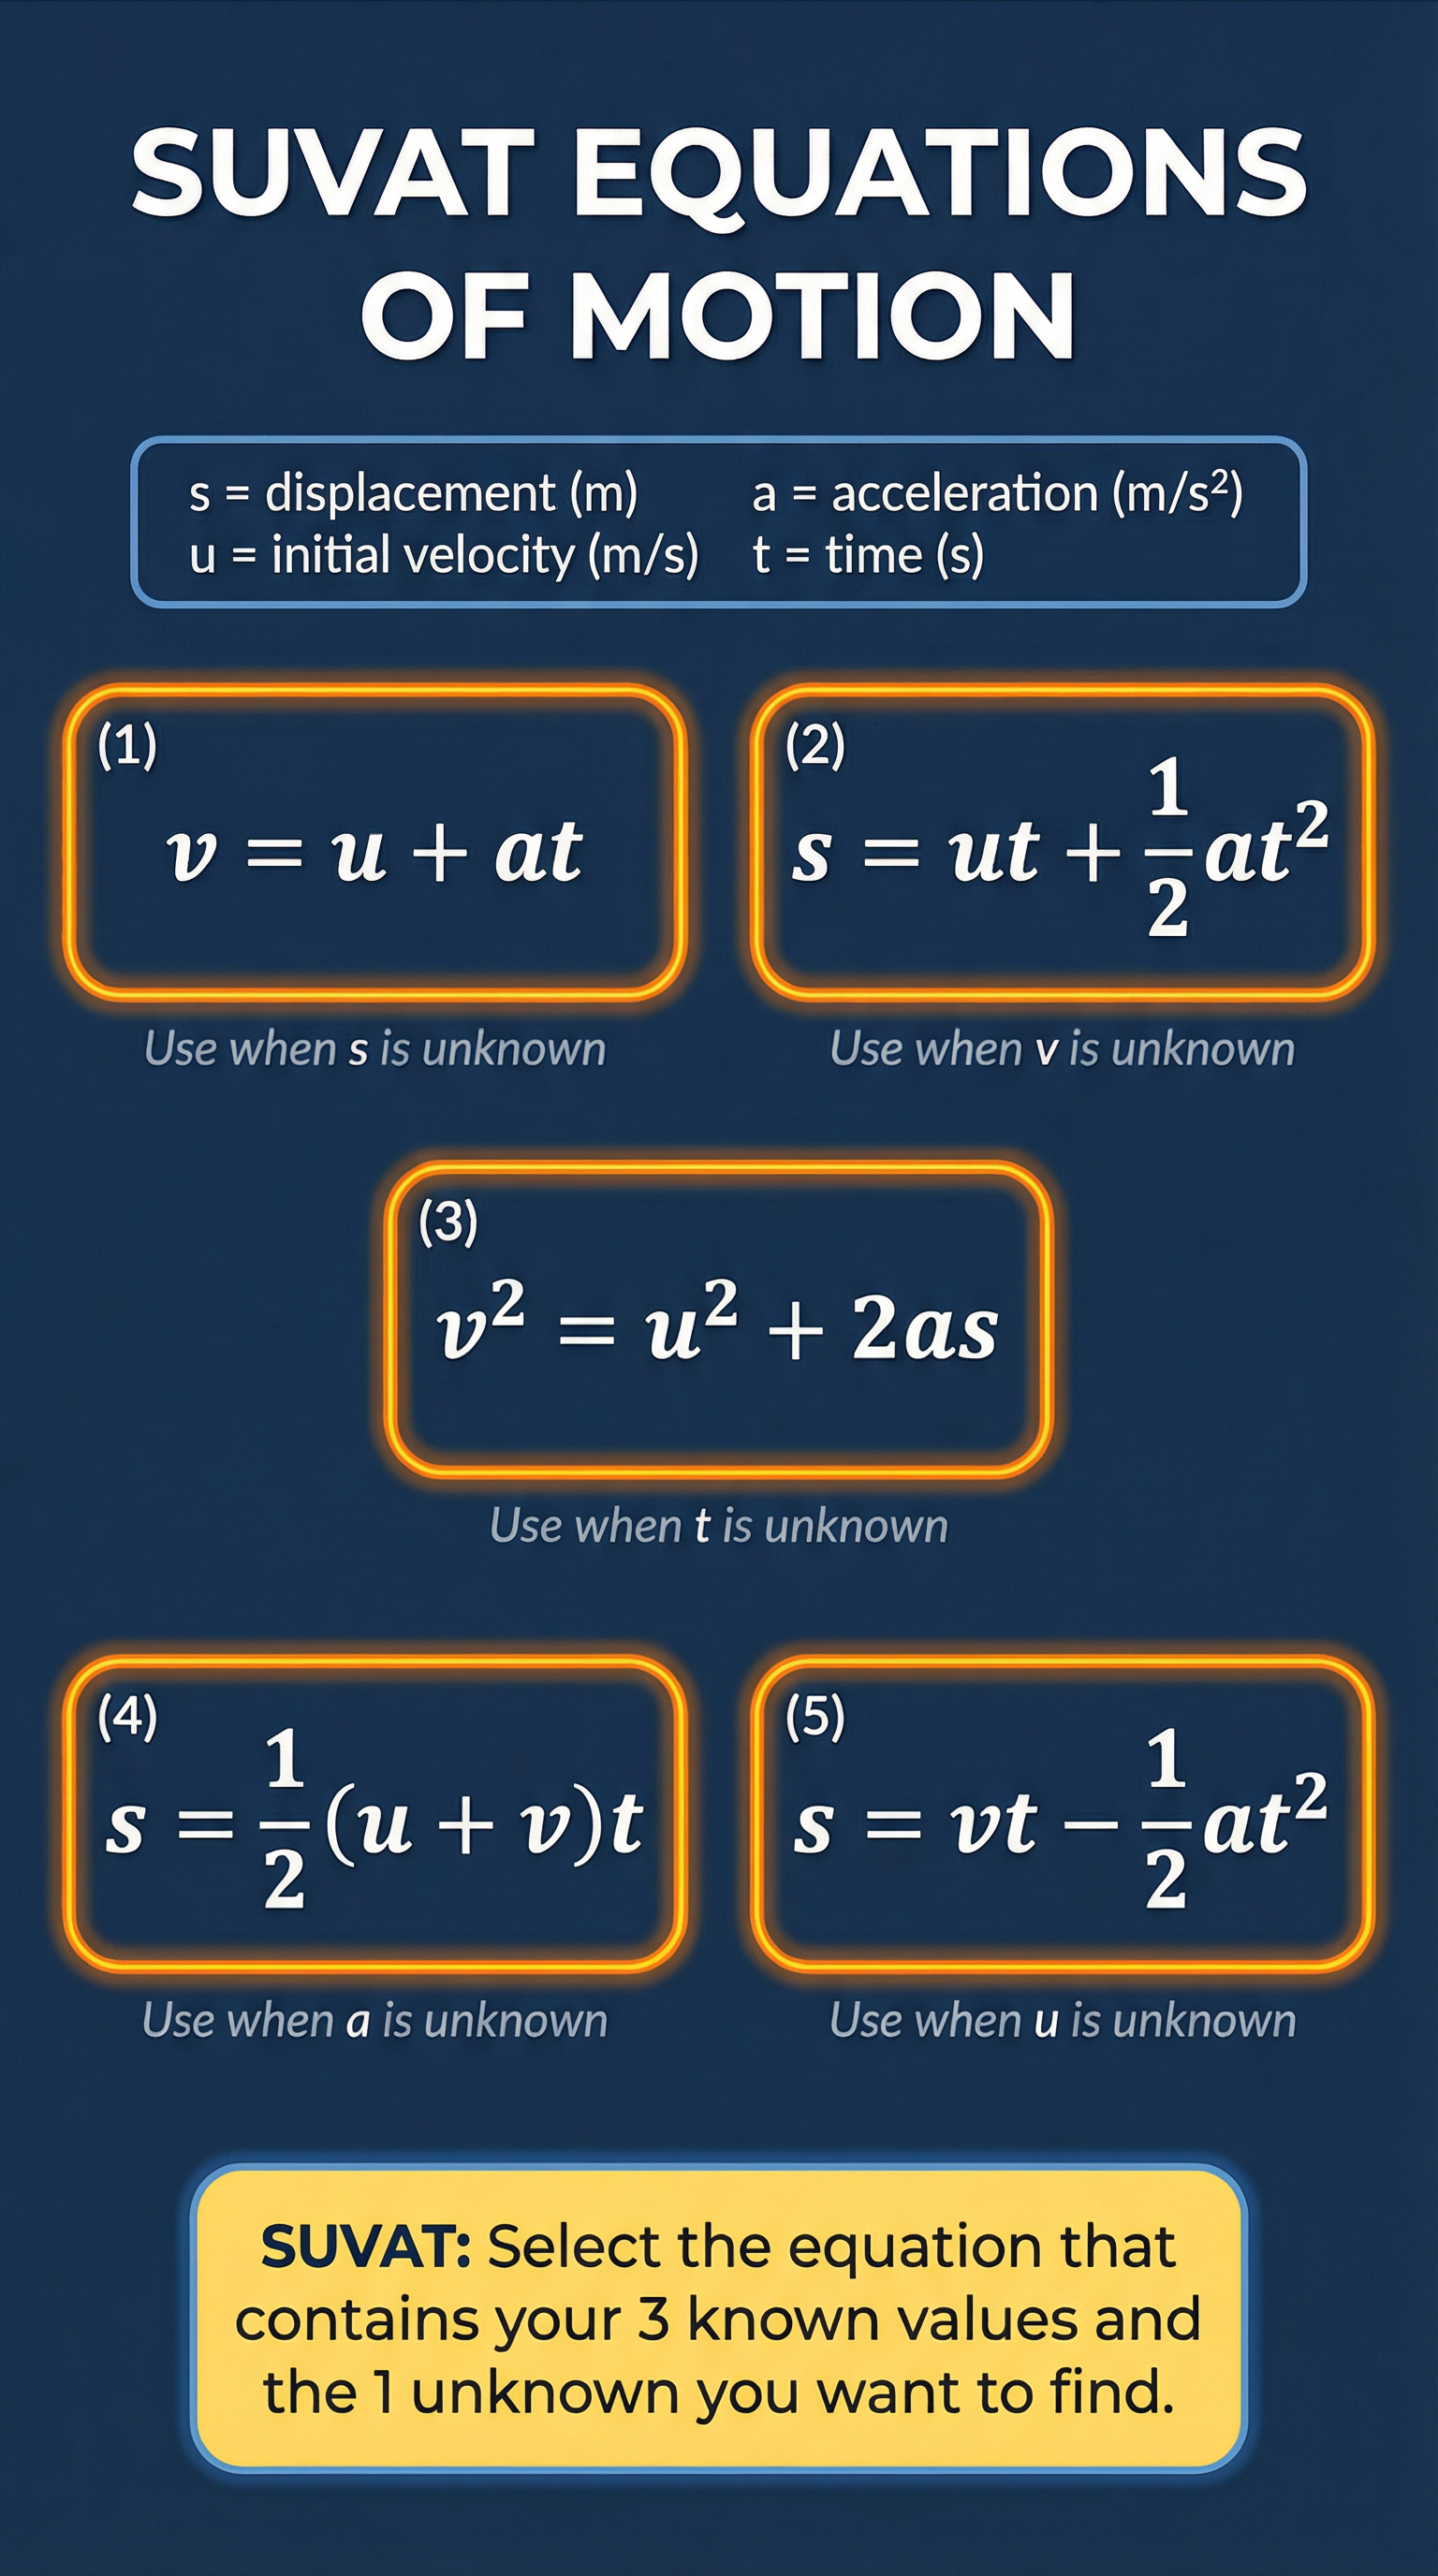
The equations of motion, commonly referred to as the SUVAT equations, are the mathematical toolkit for solving problems involving objects moving with constant (uniform) acceleration. They link five key kinematic variables.
The SUVAT Variables:
- s = displacement (metres, m)
- u = initial velocity (metres per second, m/s)
- v = final velocity (metres per second, m/s)
- a = acceleration (metres per second squared, m/s²)
- t = time (seconds, s)
The Key Equations:
v = u + at— Must memorisev² = u² + 2as— Given on formula sheets = ut + ½at²— Must memorises = ½(u + v)t— Must memorise
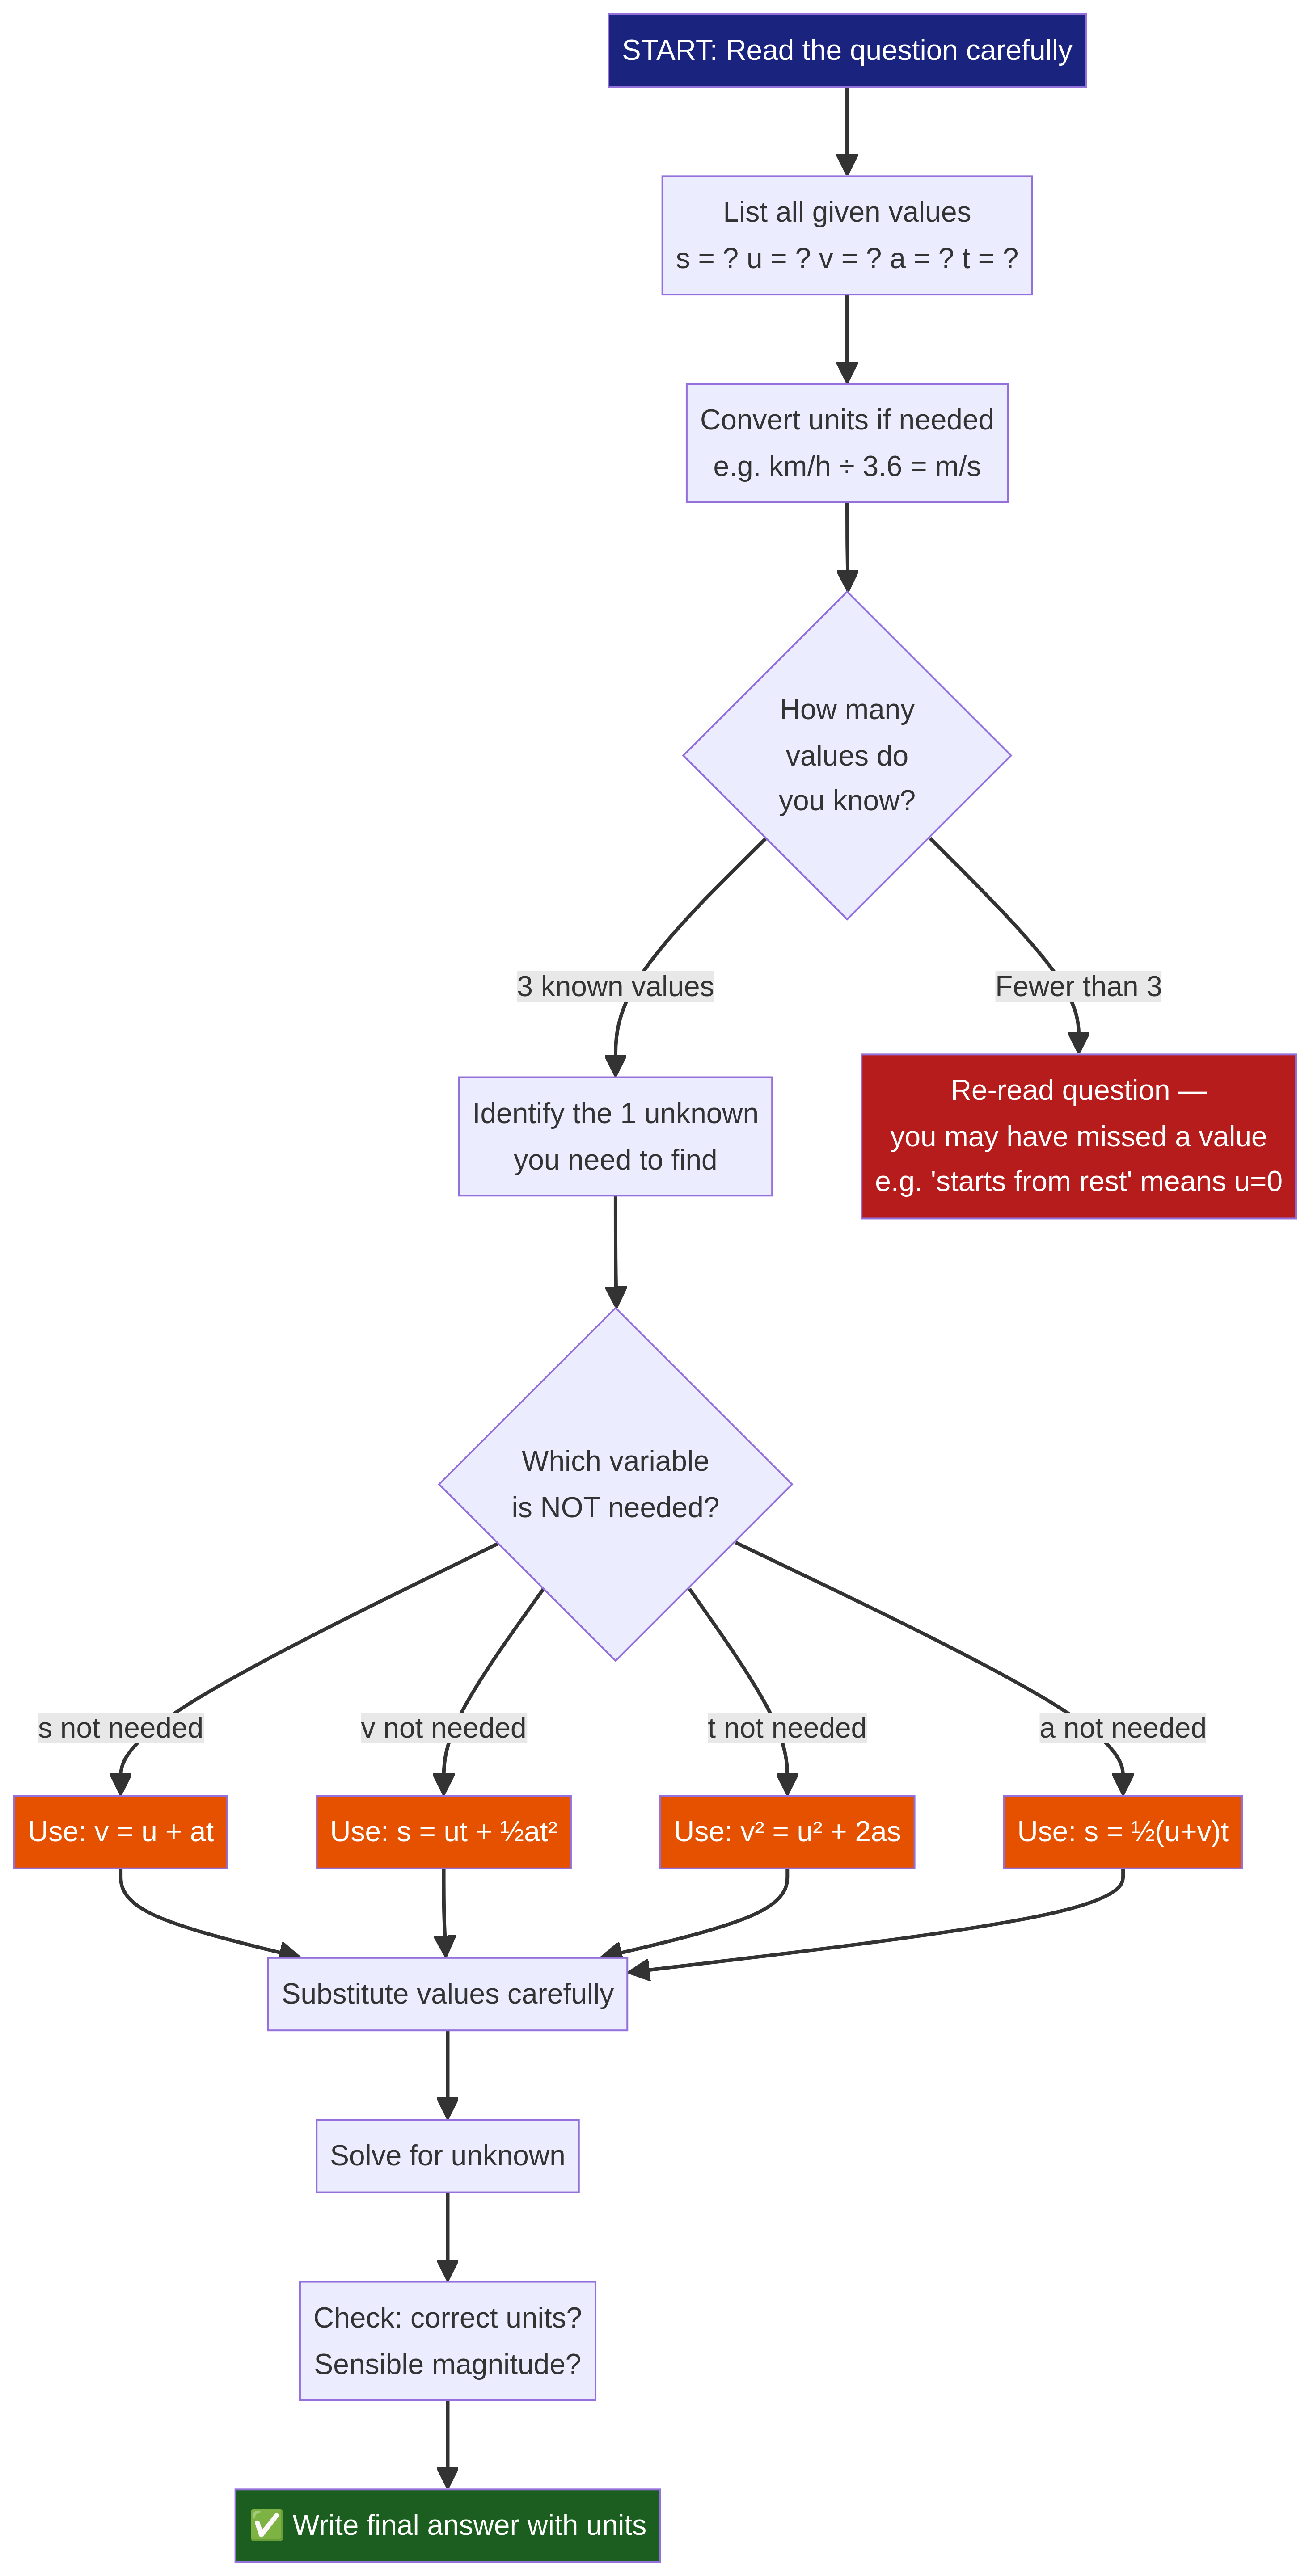
The strategy for selecting the correct equation is straightforward. First, list all five SUVAT variables and write down the values you know. Then, identify the one variable you need to find. Finally, select the equation that contains your three known values and your one unknown. The variable that does not appear in the equation you choose is the one you do not need.
Mathematical Relationships and Unit Conversions
Before substituting any values into SUVAT equations, it is essential to ensure all quantities are in standard SI units. The most common conversion error involves speed and velocity.
| Conversion | Method | Example |
|---|---|---|
| km/h to m/s | Divide by 3.6 | 72 km/h ÷ 3.6 = 20 m/s |
| m/s to km/h | Multiply by 3.6 | 20 m/s × 3.6 = 72 km/h |
Always show the unit conversion as a separate step in your working. Examiners can award a method mark for the conversion even if the subsequent calculation contains an error.
Practical Applications
This topic is directly linked to the required practical on investigating motion. A common experimental setup uses a toy car or trolley rolling down a ramp, passing through two light gates connected to a data logger. The data logger records the time taken for the object to pass through each gate and the time to travel between them. By measuring the length of the card attached to the trolley and the distance between the gates, candidates can calculate initial velocity, final velocity, and acceleration.
Examiners test this practical by asking about sources of error (e.g., friction on the ramp, parallax error in measuring distances), improvements (e.g., using a data logger instead of a stopwatch to eliminate reaction time), and how to ensure reliability (e.g., repeating the experiment and calculating a mean). Candidates should also be able to describe how to use a motion sensor or ticker tape to produce a velocity-time graph.
Visual Resources
5 diagrams and illustrations
Interactive Diagrams
2 interactive diagrams to visualise key concepts
Conceptual Flow Outline
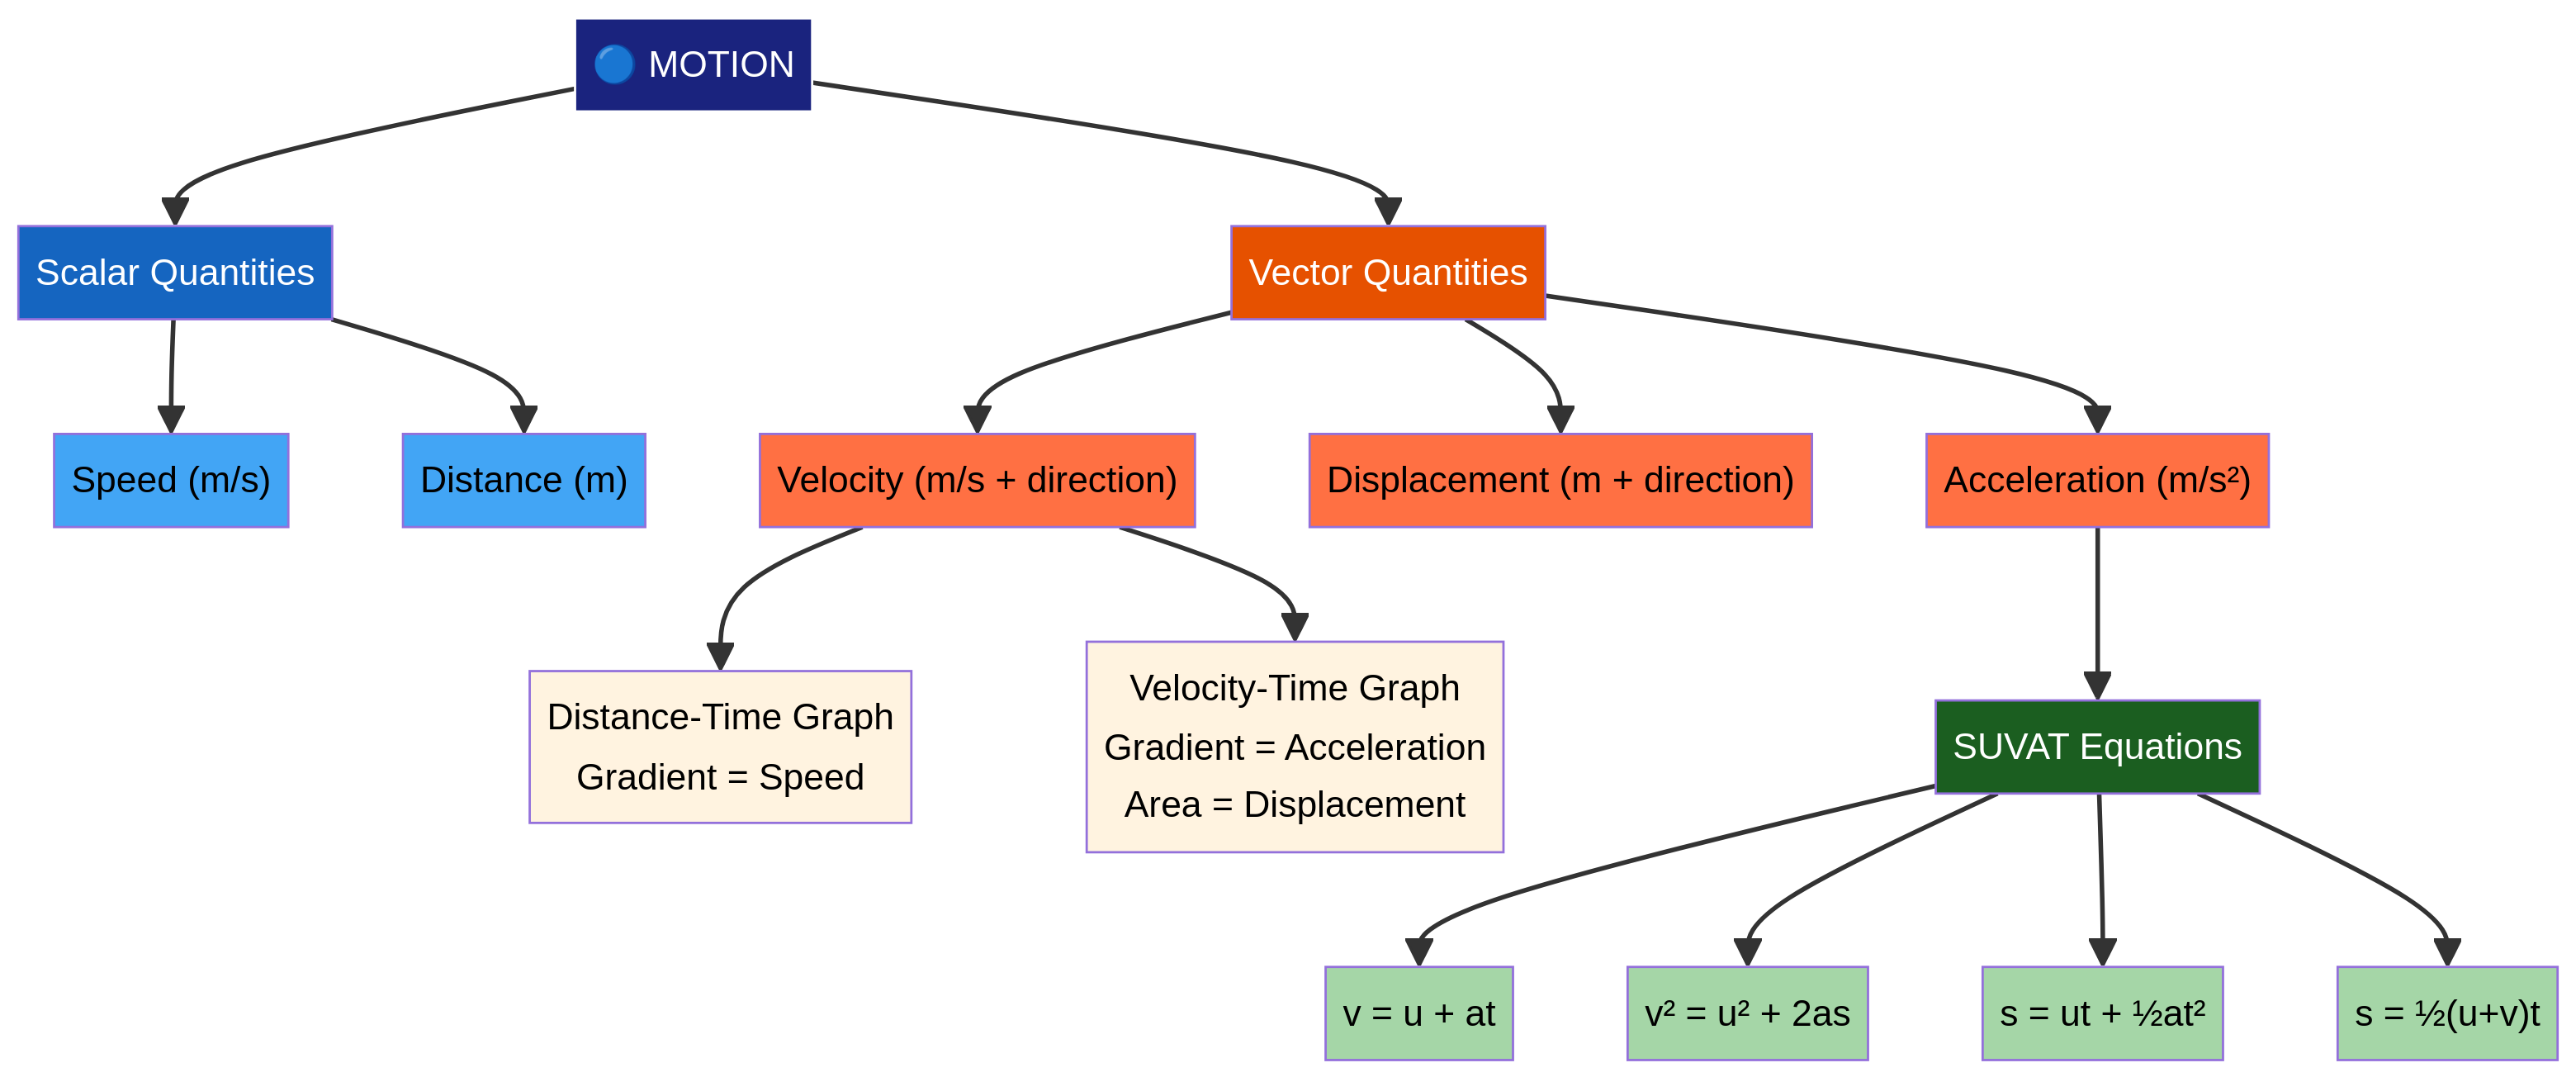
A concept map showing the hierarchical relationships between scalar and vector quantities, the two types of motion graph, and the SUVAT equations of motion.
Conceptual Flow Outline
A step-by-step decision flowchart for solving any problem involving the SUVAT equations of motion, from reading the question to writing the final answer.
Worked Examples
3 worked examples — open one to explore the question and available guidance.
Practice Questions
Test your understanding — click to reveal model answers
A sprinter runs a 100 m race in 10.2 seconds. Calculate their average speed. [2 marks]
Hint: Use the formula: average speed = total distance / total time.
A velocity-time graph shows an object moving at 8 m/s for 5 seconds, then decelerating to rest over the next 4 seconds. Describe the motion of the object between t = 5 s and t = 9 s. [2 marks]
Hint: Look at what happens to the velocity in this time period. What does the gradient of the line represent?
A ball is thrown vertically upwards with an initial velocity of 15 m/s. Calculate the maximum height reached by the ball. (Take the acceleration due to gravity as 9.8 m/s² downwards.) [4 marks]
Hint: At the maximum height, what is the instantaneous vertical velocity of the ball? This is a key hidden value.
Explain the difference between distance and displacement. Use an example in your answer. [3 marks]
Hint: Think about a journey that does not end at the starting point, or one that involves a change of direction.
A car accelerates from 10 m/s to 25 m/s over a distance of 120 m. Calculate the time taken for this acceleration. [5 marks]
Hint: You cannot find time directly from the given information. What can you calculate first using the three values you have?
Test your understanding of Velocity
Active recall beats re-reading. Take an instant quiz now to test what you’ve learned and lock it into long-term memory.
7 days Premium · Then free forever · No card, no charge