Master the Sign Test Psychology Guide for 2026
You're probably here for one of two reasons. Either you've got an exam creeping closer than you'd like, and “inferential statistics” still sounds like a threat. Or you're the kind of student who wants every easy method nailed down so you can grab marks fast. Both are sensible.
The good news is that sign test psychology is one of the more manageable stats topics in A-Level Psychology. The bad news is that students still lose marks on it all the time, usually for very avoidable reasons. They mix up the calculated value and the critical value, forget to remove ties, or write a conclusion that says far more than the test can prove. Examiners love those slip-ups. We do not.
Your Guide to Nailing the Sign Test
You are halfway through a methods exam, you spot a table with scores from the same people measured twice, and the question says, “Use an appropriate inferential statistical test.” For a lot of students, that is the exact moment confidence falls off a cliff.
The good news is that the sign test is usually one of the friendlier options on the paper. From an examiner's point of view, though, it is also a reliable way to separate students who know the routine from students who panic, pick the wrong test, or muddle up their final decision.
At A-Level, the sign test is used for related data, usually from a repeated measures design or matched pairs. You are looking at whether the pattern of change goes mostly one way rather than the other. The exam skill is not fancy maths. It is choosing the test correctly, showing tidy working, and making the judgement in the right direction.
That last part catches people out all the time.
The sign test uses S as the test statistic, and smaller values of S are the ones that can be significant. Students often expect a bigger number to look more impressive, because that is how marks, percentages, and test scores usually work. The sign test works more like a penalty count in football. Fewer against you is better.
Examiners also watch for a second common error. Students may compare their calculated S with the critical value and then write the rule backwards. Keep the examiner-friendly version in your head: if your calculated S is equal to or less than the critical value, the result is significant. If it is higher, it is not.
If you want more structured Online Revision for A-Level practice beyond this article, focus on questions that make you justify your choice of test as well as calculate it. That is where a lot of easy marks sit.
Practical rule: In the sign test, a smaller S gives you a better chance of significance. If that feels a bit odd, good. Spotting that oddity early is exactly what prevents exam mistakes.
What a Sign Test Actually Measures
At heart, the sign test is just checking direction of change.

If a participant's score goes up after a treatment, that's a plus. If it goes down, that's a minus. If it stays the same, that result gets ignored. The test doesn't care whether the change was tiny or huge. It only cares which way it went.
That's why this test feels almost suspiciously simple. It's not trying to measure size. It's asking whether the overall pattern of changes is unlikely to be due to chance.
Think of it as a vote
Say a psychologist tests a revision app. Students complete a memory task before using it, then complete another after using it. For each student, you ask one question: better or worse?
That makes the sign test ideal when you only need the direction of paired change. A psychology revision source explains it as a non-parametric test used with related or paired data, where the test statistic S is the smaller of the number of plus and minus signs after removing zero differences. It also explains why ties are removed. They reduce the effective sample size and don't fit the underlying idea that, under the null hypothesis, plus and minus are equally likely (Study.com sign test explanation).
When it fits psychology well
The sign test works nicely when:
- The design is related or paired. The same people do both conditions, or participants are matched.
- You only need direction. Better, worse, preferred, not preferred.
- The data are nominal or have been reduced to categories. You're not using full score detail.
- You can't assume normality. That's one reason it's classed as non-parametric.
A common confusion is thinking “paired data” automatically means “use a related t-test”. Not always. If the question gives you data where the key issue is primarily whether scores went up or down, the sign test may be the safer choice.
For a quick visual walkthrough, this video can help cement the logic before you practise it on paper.
The sign test tells you whether one direction happens more often than you'd expect by chance. It does not tell you how big the change was.
How to Calculate the Sign Test Step-by-Step
You are in an exam, you have paired scores in front of you, and your brain suddenly decides that the smaller number looks suspiciously too easy.
That is the exact moment students mix up S and the critical value.
The good news is that the sign test is one of the most manageable methods questions in A-Level Psychology if you follow the same routine every time. Examiners are looking for clear method, correct notation, and a decision that matches the table. If your working is tidy, you pick up marks even before the final conclusion.
A worked example with study scores
A psychologist wants to find out whether listening to classical music while revising changes test scores. 10 students take one test without music, then a similar test with music. Because each student appears in both conditions, you compare each person with themselves.
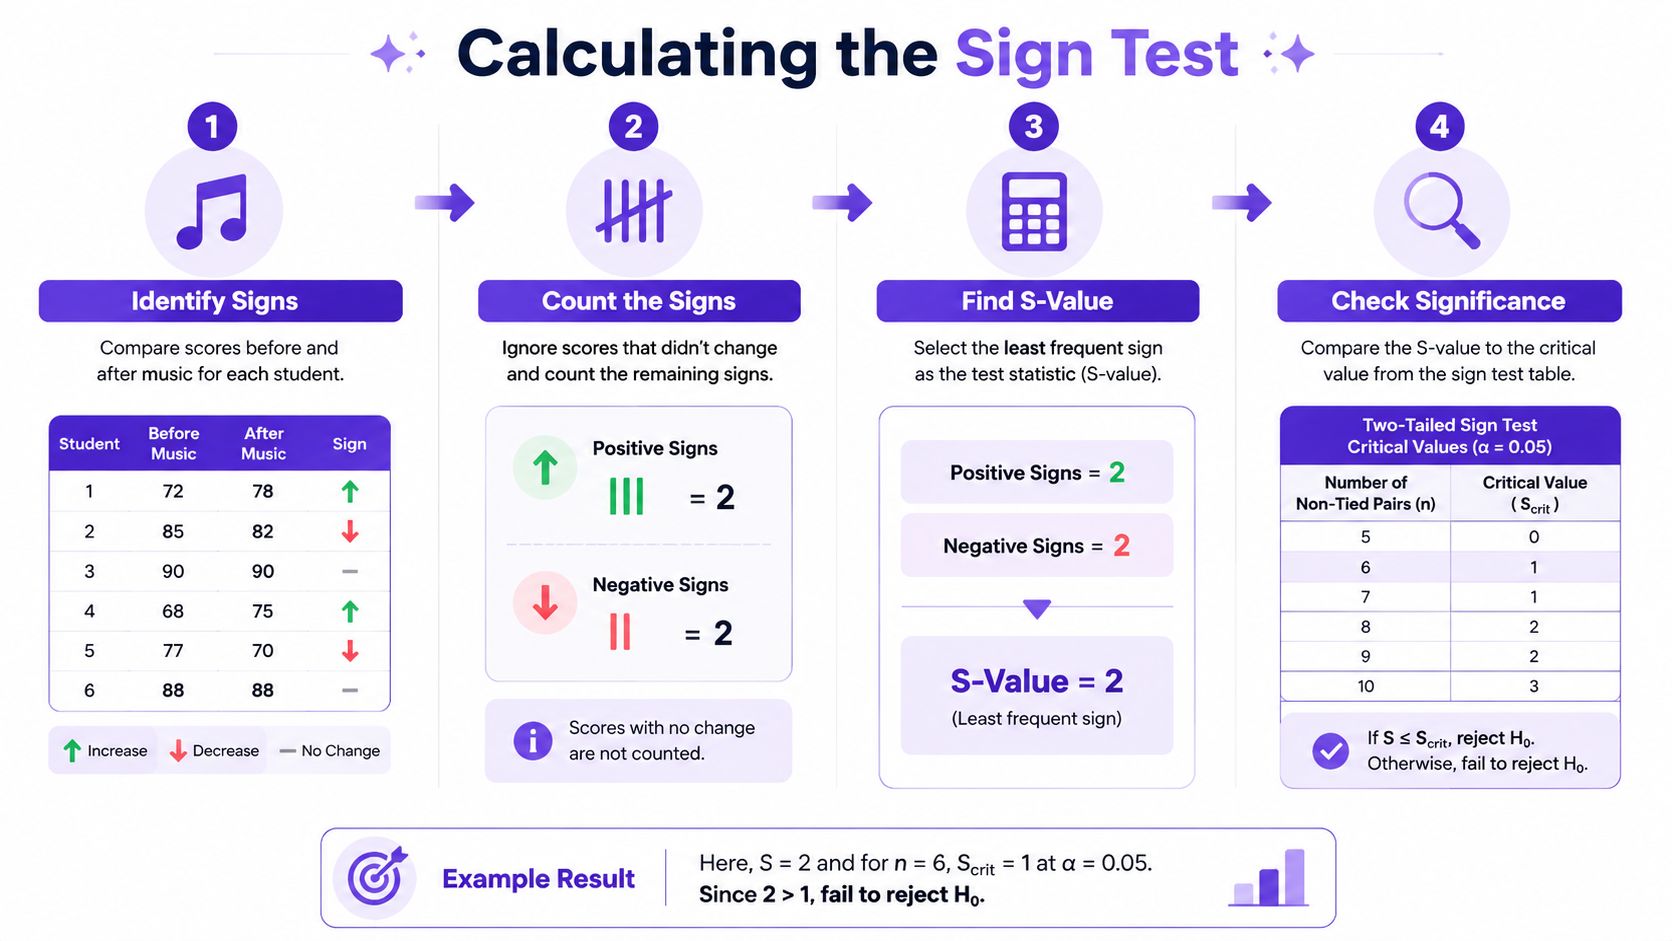
Here are the paired outcomes after comparing the two scores:
| Student | With music minus without music | Sign |
|---|---|---|
| 1 | positive | + |
| 2 | positive | + |
| 3 | negative | - |
| 4 | positive | + |
| 5 | positive | + |
| 6 | negative | - |
| 7 | positive | + |
| 8 | positive | + |
| 9 | negative | - |
| 10 | positive | + |
So the signs are easy to count. There are 7 pluses and 3 minuses.
The sequence examiners want to see
Students often lose marks because they know the rule but present it in a muddled order. A safer approach is to write the method almost like a recipe.
Write the hypothesis
If the researcher predicts that music will improve performance, a directional hypothesis is appropriate:
There will be a significant difference in test scores when students revise with classical music compared with without classical music, with scores being higher in the music condition.
If no direction is predicted, write a non-directional hypothesis instead, as this affects which critical value you use.
Work out the direction of each paired difference
Compare each participant's score in condition one with their score in condition two.
Higher second score = +
Lower second score = -
Same score = 0Cross out any zeros
This is a classic exam trap. A zero means no difference, so it is removed before you count signs and before you decide the value of N.
Count the remaining pluses and minuses
In this example:
Pluses = 7
Minuses = 3Find the test statistic, S
S is the smaller number.
That means:
S = 3Students sometimes circle the larger count because it feels more important. Don't. The sign test uses the less frequent sign.
Check the critical value table
Use the correct N after removing any zeros, then find the critical value for the significance level given in the question. In many exam questions, that will be the 5% level.
If you are practising calculations in spreadsheets as well as by hand, Excel T-test calculations can be a useful comparison point for how different tests are set up, even though the sign test itself uses a different decision table.
Make the decision correctly
This is the line that separates a decent answer from a top-band one:
The result is significant only if calculated S is equal to or less than the critical value.
Small S values support significance. That feels backwards at first, which is why students reverse it under pressure.
The part students most often get wrong
Suppose your calculated S is 3. If the critical value in the table is smaller than that, your result is not significant. If your S is equal to or below the critical value, it is significant.
A good memory aid is this: S has to be small enough to squeeze under the table value.
That sounds a bit silly, but silly memory tricks are surprisingly useful in exams.
What a strong exam answer looks like on the page
You do not need a long paragraph. Examiners usually prefer a neat layout they can scan quickly.
Hypothesis
There will be a significant difference in test scores, with higher scores when revising with classical music.Signs
+, +, -, +, +, -, +, +, -, +Counts
Pluses = 7
Minuses = 3Test statistic
S = 3Decision
Compare S with the critical value for the correct N and whether the test is one-tailed or two-tailed.Conclusion
If S is equal to or less than the critical value, reject the null hypothesis. If not, accept the null hypothesis.
That format works well across AQA, Edexcel, and OCR because it shows each mark-bearing step clearly.
What if there are ties
Now add a complication. Two students get exactly the same score with and without music.
Those are zero differences, and they must be removed.
So your method becomes:
- Start with all paired scores
- Convert each pair to +, -, or 0
- Cross out the 0s
- Count only the remaining + and -
- Use that reduced total as N
- Take the smaller sign count as S
- Compare S with the critical value
If you leave the zeros in, your N is wrong. Then your critical value is wrong. Then the final decision is wrong, even if your counting was perfect.
That is exactly the sort of chain error examiners notice straight away.
A quick student-friendly rule used in revision materials is: remove ties first, then count signs, then take the smaller count as S, and only after that compare with the table value. Keep that order and the whole method stays under control.
Sign Test Versus Other Key Statistical Tests
Choosing a test in psychology is a bit like choosing transport. Some methods are fast but fussy. Some are slower but reliable on messy ground.
The sign test belongs in the second group.
Why not always use a stronger test
The sign test is useful because it's simple and reliable. But it doesn't use much information. It ignores the size of differences and keeps only the direction. That means it's usually less powerful than alternatives that use more detail.
A technical summary of the sign test notes that compared with the paired t-test, its asymptotic relative efficiency is about 64%, and it is also typically less powerful than the Wilcoxon signed-rank test because Wilcoxon uses rank information as well as direction (Wikipedia overview of the sign test).
That doesn't make the sign test bad. It just means it's the right tool for the right data, not the flashy option you force into every question.
Choosing the right test for paired data
| Test | When to Use It | Data Level Required |
|---|---|---|
| Sign test | Related or paired design, and you only need the direction of change | Nominal or dichotomised paired outcomes |
| Wilcoxon signed-rank test | Related design, and you want to use ordered differences rather than just direction | Ordinal data |
| Related t-test | Related design with interval data when parametric assumptions can be justified | Interval data |
This table is the exam shortcut. If the scenario gives you same participants, basic directional outcomes, and no good reason to assume a parametric test, sign test psychology is often the sensible answer.
A practical way to decide under pressure
Ask yourself three quick questions:
Are the data paired or related?
If no, stop. The sign test isn't for independent groups.Do I only need direction, not magnitude?
If yes, the sign test becomes a strong candidate.Is the data level basic or heavily reduced?
If yes, sign test is often safer than a related t-test.
If you're also revising other paired-data methods, it can help to compare them in a spreadsheet so you can see how assumptions affect the choice. This guide to Excel T-test calculations is useful when you want to contrast a parametric paired test with the simpler sign test logic.
Exam Tips and How to Avoid Common Mistakes
Students usually don't lose sign test marks because the test is impossible. They lose them because they rush, overstate, or trust their first instinct when their first instinct is being wildly unhelpful.
The three mistakes that show up again and again
Reversing the decision rule
Students see a bigger number and assume it looks more impressive. For the sign test, that's wrong. A result is significant when the calculated value is small enough compared with the critical value.Keeping the zero scores in N
If a participant shows no change, that pair doesn't contribute to the test. Leave it in, and your table lookup becomes wrong.Writing a dramatic conclusion
A significant result does not mean the effect was huge, powerful, impressive, dramatic, life-changing, or the reason your flashcards finally started behaving.
What a significant result really means
A common misunderstanding in sign test psychology is the meaning of a significant result. A significant sign test shows a directional difference, such as one condition being preferred or scores tending to move one way, but it says nothing about the magnitude of that difference. Psychology teaching on interpretation highlights that over-claiming, such as saying the effect was large, is a frequent error and mark schemes reward precise wording (PMC discussion of sign test interpretation).
That's exam gold because it tells you exactly what not to write.
Don't say “the treatment caused a large improvement” if you only used a sign test. You haven't measured “large”.
A better conclusion formula
Use this shape:
- State significance
- Refer to the null hypothesis
- Put the finding back into the study context
- Avoid claims about size
For example:
The result is significant at the stated level, so the null hypothesis can be rejected. There is evidence of a difference in recall between the two conditions, with participants tending to recall more after using the memory technique.
That works because it's accurate and restrained. Examiners like restrained. Restrained gets marks.
A fast checklist before you move on
- Design check. Is it repeated measures or matched pairs?
- Data check. Are you using direction only?
- Zeros removed. Did you cross out ties before counting?
- S identified. Did you choose the smaller sign count?
- Decision rule correct. Is S ≤ critical value for significance?
- Conclusion precise. Did you avoid claiming the effect was big?
If you want timed drills on this sort of method question, Exam Practice for A-Level can be useful because it mirrors the pressure point that causes most sign test mistakes. Under no pressure, nearly everyone “knows” the rule. Under timed conditions, that confidence can mysteriously leave the room.
A-Level Practice Question and Model Answer
Here's a realistic sign test psychology question in exam style.
A psychologist wanted to investigate whether a new memory-improvement technique was effective. 10 participants were given a list of words to memorise and tested on how many they could recall. They were then taught the new technique and given a different list of words, and tested again.
Use the data below to carry out a sign test. State your hypothesis, show your calculations, and state your conclusion.
| Participant | Before technique | After technique |
|---|---|---|
| 1 | 8 | 10 |
| 2 | 9 | 11 |
| 3 | 10 | 9 |
| 4 | 7 | 8 |
| 5 | 11 | 12 |
| 6 | 6 | 6 |
| 7 | 12 | 14 |
| 8 | 9 | 8 |
| 9 | 8 | 10 |
| 10 | 10 | 11 |
Model answer
Hypothesis
There will be a significant difference in word recall after participants use the memory-improvement technique, with recall scores being higher after the technique than before it.
Step 1: Work out the difference for each participant
After minus before gives:
| Participant | Difference | Sign |
|---|---|---|
| 1 | positive | + |
| 2 | positive | + |
| 3 | negative | - |
| 4 | positive | + |
| 5 | positive | + |
| 6 | zero | 0 |
| 7 | positive | + |
| 8 | negative | - |
| 9 | positive | + |
| 10 | positive | + |
Step 2: Remove zero differences
Participant 6 had no change, so that score is removed.
Step 3: Count the remaining signs
Pluses = 7
Minuses = 2
Step 4: Find S
The test statistic S is the smaller value.
So, S = 2
How to write the decision
Now compare S with the relevant critical value from the sign test table using the corrected N after removing the tie.
Presentation matters. Even if the table is given separately in the exam, your wording should stay crisp:
- If S is equal to or less than the critical value, the result is significant and the null hypothesis is rejected.
- If S is greater than the critical value, the result is not significant and the null hypothesis is accepted.
Notice what this answer does well. It doesn't waffle about confidence intervals, doesn't claim the effect is large, and doesn't accidentally use the original sample size after one zero difference was removed.
Why this answer scores well
It hits the marks examiners want:
- Correct test chosen for related data
- Directional hypothesis written in context
- Signs shown clearly
- Tie removed properly
- S calculated correctly
- Conclusion linked to significance and the hypothesis
Answer-writing habit: If your final sentence could fit any study in the world, it's too vague. Always name the actual variable or context, such as memory recall, mood, preference, or anxiety scores.
For extra timed questions like this, working through A-Level Past papers helps because the wording changes across papers, but the logic of the sign test doesn't.
If you want more support with Psychology research methods, MasteryMind offers curriculum-aligned revision and exam practice for UK learners, including question styles that match AQA, Edexcel, and OCR. It's a practical way to rehearse methods like the sign test until the steps feel automatic rather than alarming.
Ready to master this topic?
Practise with quizzes, blurt exercises and exam questions on MasteryMind.
7 days Premium · Then free forever · No card, no charge