AQA · A-Level · Biology
Course version: 7402 · Version from Sept 2016
Required practical 12: Investigation into the effect of a named…
Full specification wording
Populations in ecosystems (A-level only): Required practical 12: Investigation into the effect of a named environmental factor on the distribution of a given species.
This practical investigates how an environmental factor affects species distribution.
Checked against the AQA 7402 specification (opens in a new tab) on .
- Point 14 of 14
- 4 key terms
Study notes
From the checked teaching notes for this specification point.
The idea
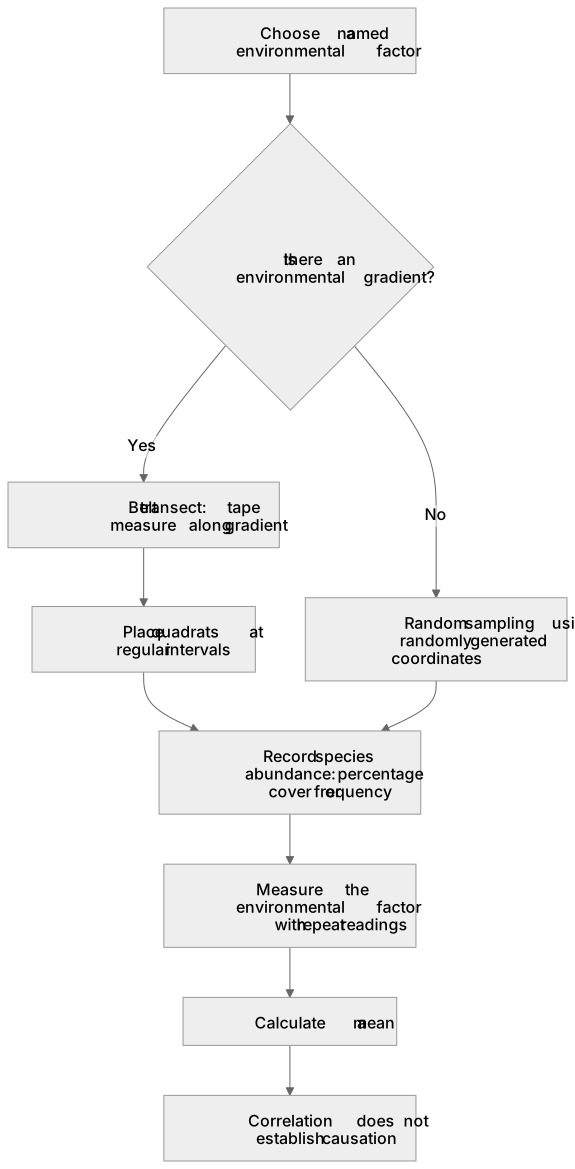
This practical investigates how an environmental factor affects species distribution. Choose a measurable factor: light intensity, soil moisture, pH, or temperature. Where the factor changes along a gradient, use a belt transect by running a tape measure along the gradient and placing quadrats at regular intervals to capture the pattern. At each quadrat, record species abundance (e.g., percentage cover or frequency) and measure the environmental factor, taking repeat readings to calculate a mean. If comparing two uniform areas without a gradient, sample randomly within each area using coordinates generated by a random number calculator to avoid bias.
What earns the marks
- Name the environmental factor being investigated and state suitable apparatus to measure it accurately.
- Specify a belt transect with quadrats placed at regular intervals when sampling along an environmental gradient.
- Specify random sampling using randomly generated coordinates when comparing areas without an environmental gradient.
- State a valid measure of abundance, such as percentage cover or frequency, ensuring repeats are taken to calculate a mean.
- State clearly that a correlation between the environmental factor and species distribution does not establish causation.
Common mistakes and how to put them right
Concluding that the measured factor causes the distribution.
Put it right: State that other abiotic or biotic factors may change along the same transect and influence distribution.
Using random quadrats where there is an obvious environmental gradient.
Put it right: Use systematic sampling (a belt transect) to observe changes along a gradient.
Taking a single reading of the environmental factor.
Put it right: Take multiple repeat readings at each sampling site to calculate a reliable mean.
Exam tips
- When asked for conclusions about distribution, give one specific statement per species and tie each to a feature shown on the provided map or figure.
- Name the specific statistical test used (e.g., Spearman's rank correlation) and state exactly what it tests for, rather than just saying 'do a stats test'.
Try the lesson
The start of the Populations in ecosystems (A-level only): Required practical 12: Investigation into the effect of a named environmental factor on the distribution of a given species. lesson, made from checked teaching notes for this specification point.
Have a go first
A student investigated the effect of light intensity on the distribution of daisies in a field. Which piece of apparatus is most suitable for placing quadrats at regular intervals along a transect line?
Listen
This practical investigates how an environmental factor affects species distribution. Choose a measurable factor: light intensity, soil moisture, pH, or temperature. Where the factor changes along a gradient, use a belt transect by running a tape measure along the gradient and placing quadrats at regular intervals to capture the pattern. At each quadrat, record species abundance (e.g., percentage cover or frequency) and measure the environmental factor, taking repeat readings to calculate a mean. If comparing two uniform areas without a gradient, sample randomly within each area using coordinates generated by a random number calculator to avoid bias. A strong answer earns marks for these points. Name the environmental factor being investigated and state suitable apparatus to measure it accurately. Specify a belt transect with quadrats placed at regular intervals when sampling along an environmental gradient. Specify random sampling using randomly generated coordinates when comparing areas without an environmental gradient. State a valid measure of abundance, such as percentage cover or frequency, ensuring repeats are taken to calculate a mean. A common slip: Concluding that the measured factor causes the distribution. Instead, state that other abiotic or biotic factors may change along the same transect and influence distribution. Exam tip: When asked for conclusions about distribution, give one specific statement per species and tie each to a feature shown on the provided map or figure.
See it
Key words
Say what each word means before you turn the card.
belt transect
Try answering aloud or in your head before turning the card.
systematic sampling
Try answering aloud or in your head before turning the card.
abundance and percentage cover
Try answering aloud or in your head before turning the card.
correlation not causation
Try answering aloud or in your head before turning the card.
See every definition
- belt transect
- Running a tape measure along the gradient and placing quadrats at regular intervals to capture the pattern.
- systematic sampling
- A belt transect used where there is an obvious environmental gradient to observe changes along it.
- abundance and percentage cover
- A valid measure of abundance, such as percentage cover or frequency, with repeats taken to calculate a mean.
- correlation not causation
- A correlation between the environmental factor and species distribution does not establish causation.
There is more to this lesson
The full lesson goes on to check your understanding and help you earn the marks. Create a free account to carry on, with your progress saved.
A week of Premium from your first lesson · Then the free plan continues · No card, no charge
Test your understanding of Populations in ecosystems (A-level only): Required practical 12: Investigation into the effect of a named environmental factor on the distribution of a given species.
Active recall beats re-reading. Take an instant quiz now to test what you’ve learned and lock it into long-term memory.
A week of Premium from your first lesson · Then the free plan continues · No card, no charge