Subject: Business | Level: GCSE | Exam Board: AQA
Master the financial foundations of business decision-making. This guide covers essential calculations from break-even analysis to investment appraisal, equipping you with the precise knowledge examiners demand.
Revision Notes & Key Concepts
Key Terms & Definitions
- Fixed Costs
- Costs that do not change with the level of output.
- Variable Costs
- Costs that change directly with the level of output.
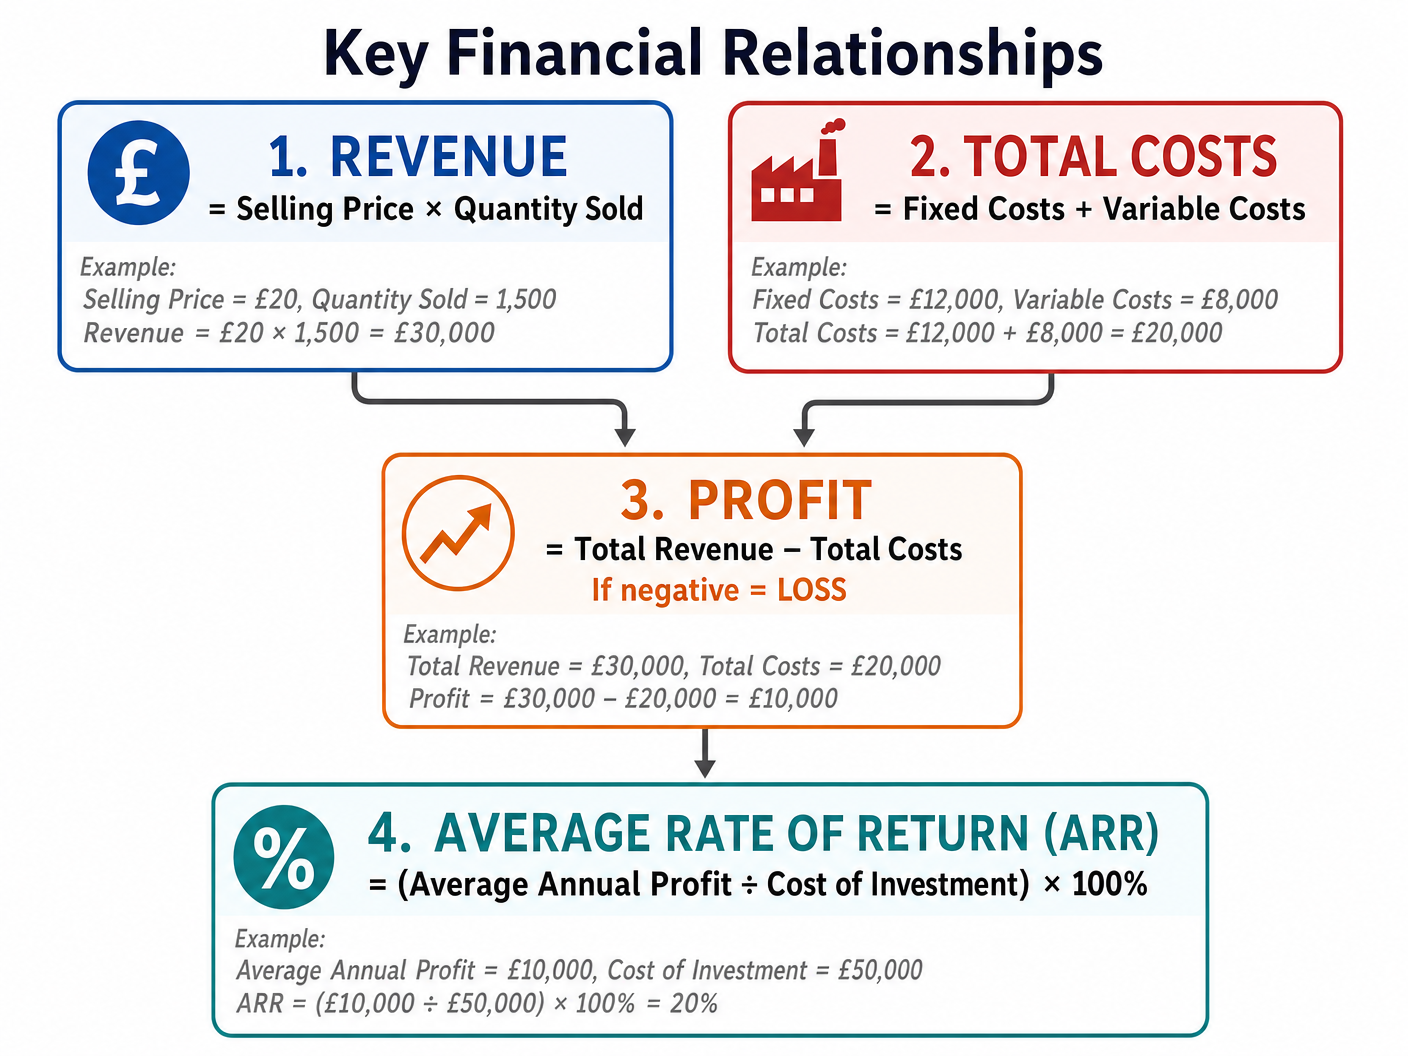
- Revenue
- The total money brought in by sales (Price x Quantity).
- Break-Even Point
- The level of output where total revenue equals total costs.
- Margin of Safety
- The difference between current output and break-even output.
- Average Rate of Return (ARR)
- The average annual profit of an investment expressed as a percentage of the initial cost.
Worked Examples
Worked Example
Question: A business sells 2,000 units at £15 each. Its fixed costs are £10,000 and variable costs are £5 per unit. Calculate the profit made by the business. Show your working. (4 marks)
Solution: **Step 1: Calculate Total Revenue** Revenue = Selling Price × Quantity Sold Revenue = £15 × 2,000 = £30,000 **Step 2: Calculate Total Variable Costs** Total Variable Costs = Variable Cost per unit × Quantity Total Variable Costs = £5 × 2,000 = £10,000 **Step 3: Calculate Total Costs** Total Costs = Fixed Costs + Total Variable Costs Total Costs = £10,000 + £10,000 = £20,000 **Step 4: Calculate Profit** Profit = Total Revenue - Total Costs Profit = £30,000 - £20,000 = £10,000
Worked Example
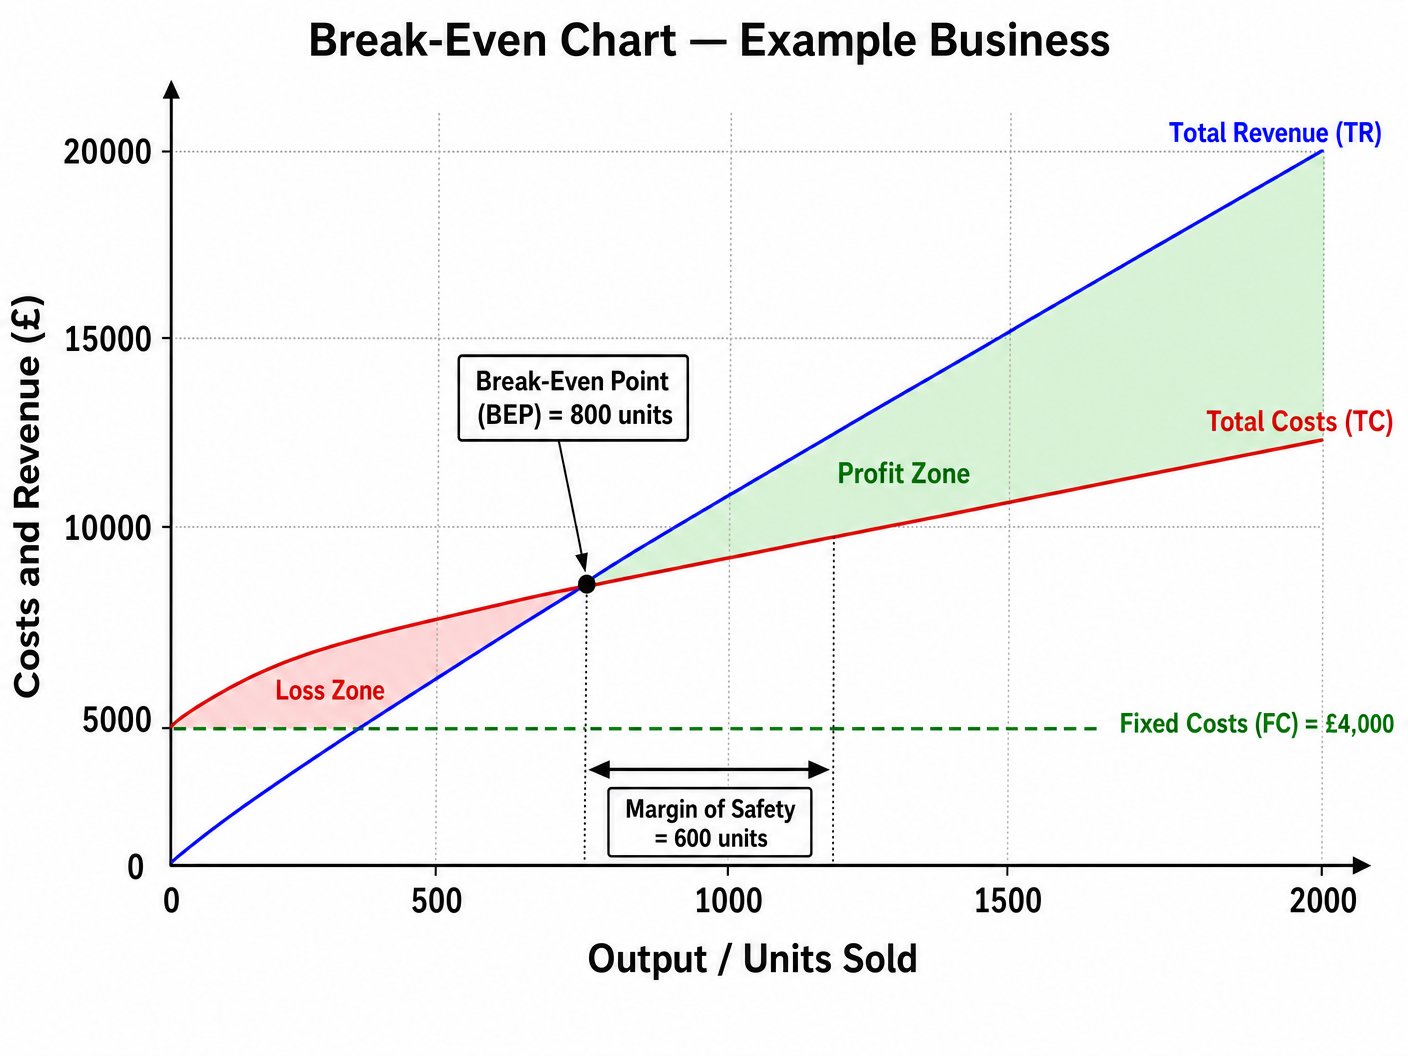
Question: Using the break-even chart provided {{asset:break_even_chart.png}}, identify the break-even output and calculate the margin of safety if current output is 1,400 units. (3 marks)
Solution: **Break-Even Output**: Looking at the chart where the Total Revenue (blue) and Total Costs (red) lines intersect, the output on the x-axis is 800 units. **Margin of Safety Calculation**: Margin of Safety = Current Output - Break-Even Output Margin of Safety = 1,400 units - 800 units = 600 units.
Worked Example
Question: Evaluate the usefulness of break-even analysis to a start-up business. (9 marks)
Solution: **Introduction**: Break-even analysis calculates the output needed for total revenue to equal total costs. For a start-up, it is a vital planning tool but has significant limitations. **Point 1 (Usefulness)**: Break-even analysis is highly useful because it provides a clear target for the start-up. By knowing the exact number of units they must sell to avoid a loss, the entrepreneur can set realistic sales targets and secure bank loans by demonstrating financial viability in their business plan. **Point 2 (Limitation)**: However, its usefulness is limited because it relies on assumptions. It assumes that all output produced is sold at the same price, which is unlikely for a start-up that may need to offer discounts to attract initial customers or may have unsold stock. **Conclusion/Judgement**: Overall, break-even analysis is very useful as an initial forecasting tool to assess risk. However, its value decreases in reality because the dynamic nature of a start-up means costs and prices will constantly fluctuate, making the static break-even chart quickly outdated.
Practice Questions
Question: A bakery sells cakes for £3 each. Fixed costs are £500 per month. Variable costs are £1 per cake. Calculate the profit or loss if the bakery sells 400 cakes in a month. (4 marks)
Answer:
Question: Explain one impact on a business's break-even point if its fixed costs increase. (3 marks)
Answer:
Question: A business is considering a £40,000 investment that will generate £15,000 profit in total over 3 years. Calculate the Average Rate of Return (ARR). (3 marks)
Answer:
Question: Identify the margin of safety if a business breaks even at 500 units and is currently producing 750 units. (1 mark)
Answer:
Question: Assess whether a business should proceed with an investment that has an ARR of 4%, when the bank interest rate is 5%. (6 marks)
Answer: