Interpretation Revision Notes

    Subject: Business | Level: GCSE | Exam Board: AQA

    Master the art of Data Interpretation, a crucial skill across all GCSE Business exam boards. Learn how to translate financial figures, market research, and graphs into strategic business decisions that secure top marks.

    Revision Notes & Key Concepts

    ![Business Data Interpretation Overview](https://xnnrgnazirrqvdgfhvou.supabase.co/storage/v1/object/public/study-guide-assets/guide_0833dd4d-6e3e-4af5-9f3d-770b1fd2b8a8/header_image.png) ## Overview Data interpretation is the cornerstone of business analysis and a highly rewarded skill in GCSE Business examinations. Examiners expect candidates not just to read numbers from a page, but to understand what those figures mean for a business's health, strategy, and future prospects. This study guide covers the five essential pillars of data interpretation: financial data, profitability ratios, market data, marketing research, and graphical analysis. Mastering these areas will enable you to confidently tackle quantitative questions, evaluate business performance, and justify strategic decisions using hard evidence. ![Business Boost Podcast: Mastering Data Interpretation](https://xnnrgnazirrqvdgfhvou.supabase.co/storage/v1/object/public/study-guide-assets/guide_0833dd4d-6e3e-4af5-9f3d-770b1fd2b8a8/interpretation_podcast.mp3) ## Core Analytical Pillars ### 1. Graphs and Charts **Focus Areas**: Bar charts, pie charts, line graphs, and data tables. **Key Skills**: Candidates must extract precise figures to identify trends, comparisons, and anomalies. For instance, recognising a consistent upward trend in a line graph representing sales revenue over five years indicates growth, but candidates must calculate the percentage increase to secure higher-level marks. **Examiner Expectation**: Never describe a trend without quoting the specific data points that demonstrate it. ### 2. Profitability Ratios **Focus Areas**: Gross Profit Margin (GPM) and Net Profit Margin (NPM). ![Profitability Ratios Explained](https://xnnrgnazirrqvdgfhvou.supabase.co/storage/v1/object/public/study-guide-assets/guide_0833dd4d-6e3e-4af5-9f3d-770b1fd2b8a8/profitability_ratios_diagram.png) **Key Skills**: Understanding the distinction between production efficiency (GPM) and overall business efficiency (NPM). A high GPM with a low NPM suggests excessive overhead costs (such as marketing or administrative expenses) that need immediate management attention. **Examiner Expectation**: Candidates must not only calculate these ratios accurately but also explain their implications. A falling NPM over two years requires an explanation of potential causes, such as rising fixed costs or increased competition forcing price reductions. ### 3. Financial Data Interpretation **Focus Areas**: Cash flow forecasts, Average Rate of Return (ARR), and Profit & Loss accounts. **Key Skills**: Identifying liquidity issues before they become critical. In a cash flow forecast, a negative closing balance is a red flag indicating potential insolvency. Candidates must be able to suggest viable solutions, such as negotiating longer payment terms with suppliers or arranging an overdraft facility. **Examiner Expectation**: When evaluating an investment using ARR, candidates should compare the calculated percentage against alternative investments or current interest rates to justify whether the investment is worthwhile. ### 4. Marketing Research Findings **Focus Areas**: Primary and secondary data analysis. **Key Skills**: Evaluating the validity and reliability of market research. If a survey shows 80% customer satisfaction, candidates should question the sample size and demographic before accepting the data as a basis for a national product launch. **Examiner Expectation**: Use market research data to justify marketing mix (4Ps) decisions. For example, using demographic data to justify a targeted promotional campaign. ### 5. Market Data Analysis **Focus Areas**: Market share, market size, and the impact of price/cost changes. ![The Data Interpretation Framework](https://xnnrgnazirrqvdgfhvou.supabase.co/storage/v1/object/public/study-guide-assets/guide_0833dd4d-6e3e-4af5-9f3d-770b1fd2b8a8/data_interpretation_framework.png) **Key Skills**: Calculating market share to determine competitive position. A business may see its sales revenue increase, but if the overall market size is growing faster, its market share is actually declining. **Examiner Expectation**: Link changes in costs (e.g., raw materials) to potential impacts on pricing strategy and subsequent effects on demand and revenue.

    Key Terms & Definitions
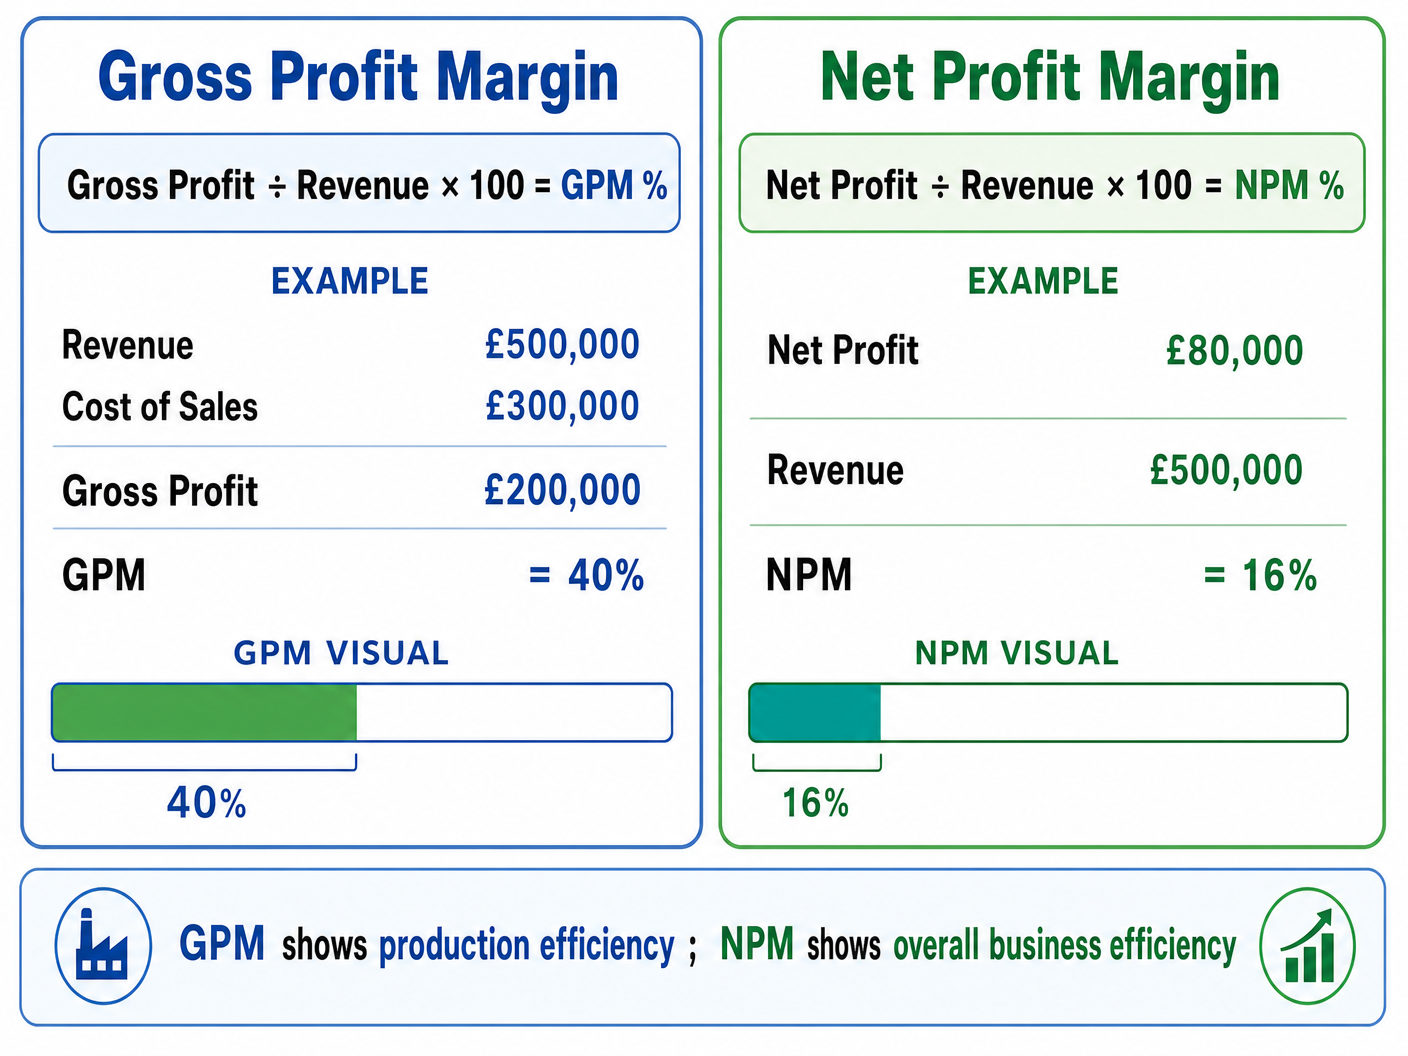
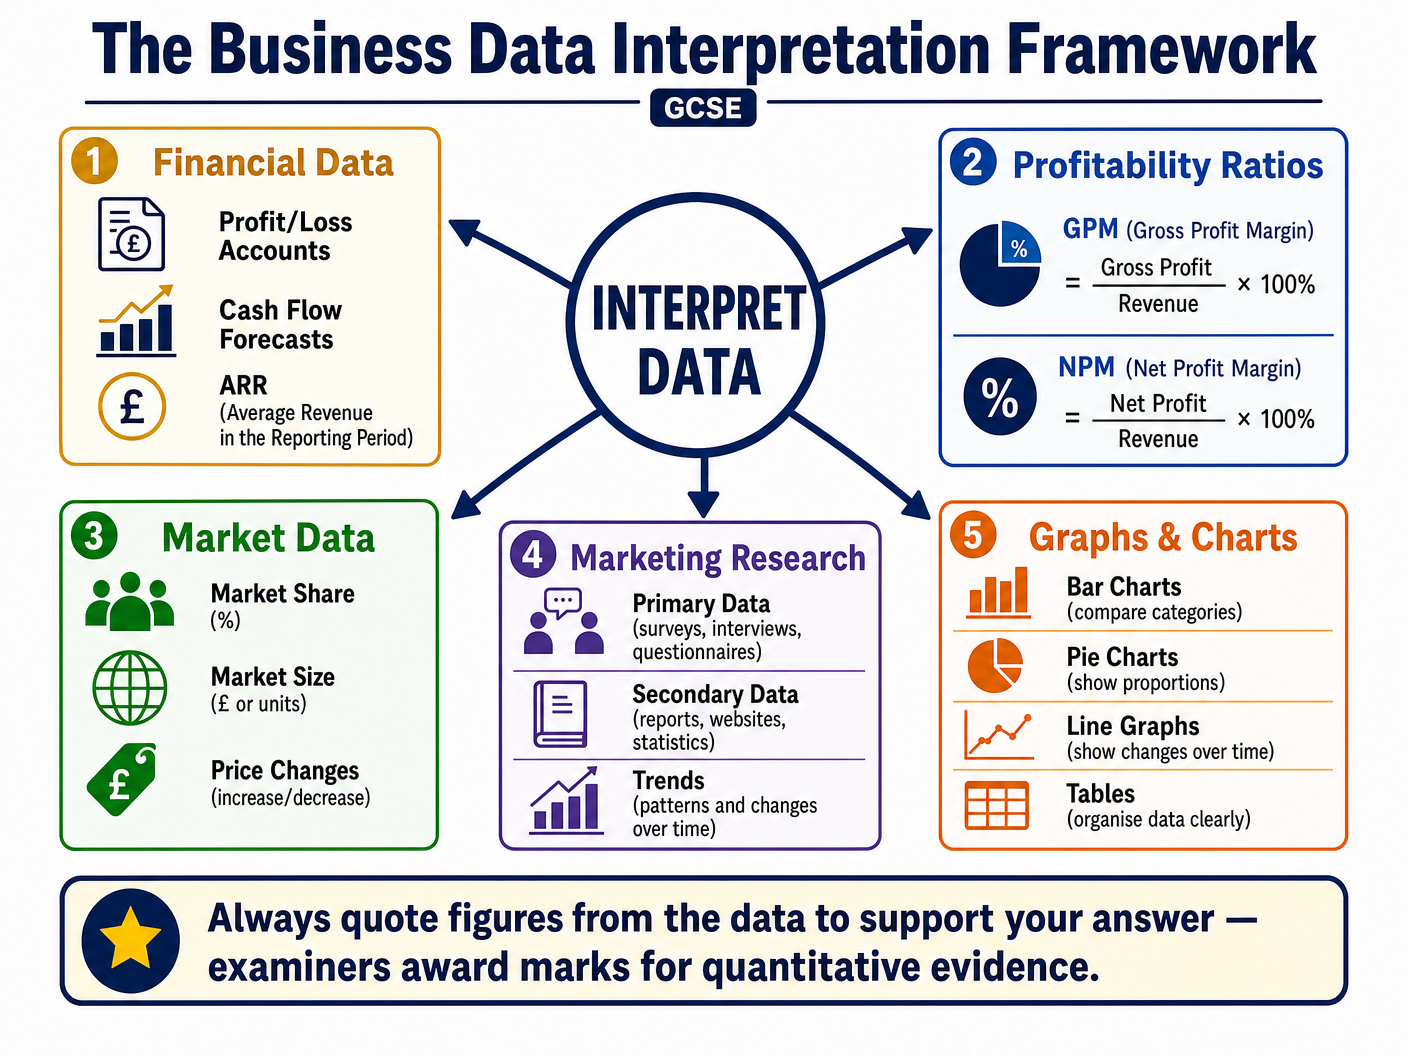
    Gross Profit Margin
    A profitability ratio that measures the percentage of revenue left after deducting the direct costs of producing goods or services (Cost of Sales).
    Net Profit Margin
    A profitability ratio that measures the percentage of revenue remaining after all operating expenses, interest, and taxes have been deducted.
    Average Rate of Return (ARR)
    A method of evaluating investment appraisal that calculates the average annual profit of an investment as a percentage of its initial cost.
    Cash Flow Forecast
    A forward-looking financial document that estimates the cash inflows and outflows of a business over a specific period, usually monthly.
    Market Share
    The proportion of total sales in a particular market held by one specific business or brand, expressed as a percentage.
    Quantitative Data
    Information that can be measured and written down with numbers.

    Worked Examples

    Practice Questions

    Interpretation

    AQA
    GCSE
    Business

    Master the art of Data Interpretation, a crucial skill across all GCSE Business exam boards. Learn how to translate financial figures, market research, and graphs into strategic business decisions that secure top marks.

    4
    Min Read
    3
    Examples
    5
    Questions
    6
    Key Terms
    🎙 Podcast Episode
    Interpretation
    0:00-0:00

    Study Notes

    Business Data Interpretation Overview

    Overview

    Data interpretation is the cornerstone of business analysis and a highly rewarded skill in GCSE Business examinations. Examiners expect candidates not just to read numbers from a page, but to understand what those figures mean for a business's health, strategy, and future prospects. This study guide covers the five essential pillars of data interpretation: financial data, profitability ratios, market data, marketing research, and graphical analysis. Mastering these areas will enable you to confidently tackle quantitative questions, evaluate business performance, and justify strategic decisions using hard evidence.

    Business Boost Podcast: Mastering Data Interpretation

    Core Analytical Pillars

    1. Graphs and Charts

    Focus Areas: Bar charts, pie charts, line graphs, and data tables.

    Key Skills: Candidates must extract precise figures to identify trends, comparisons, and anomalies. For instance, recognising a consistent upward trend in a line graph representing sales revenue over five years indicates growth, but candidates must calculate the percentage increase to secure higher-level marks.

    Examiner Expectation: Never describe a trend without quoting the specific data points that demonstrate it.

    2. Profitability Ratios

    Focus Areas: Gross Profit Margin (GPM) and Net Profit Margin (NPM).

    Profitability Ratios Explained

    Key Skills: Understanding the distinction between production efficiency (GPM) and overall business efficiency (NPM). A high GPM with a low NPM suggests excessive overhead costs (such as marketing or administrative expenses) that need immediate management attention.

    Examiner Expectation: Candidates must not only calculate these ratios accurately but also explain their implications. A falling NPM over two years requires an explanation of potential causes, such as rising fixed costs or increased competition forcing price reductions.

    3. Financial Data Interpretation

    Focus Areas: Cash flow forecasts, Average Rate of Return (ARR), and Profit & Loss accounts.

    Key Skills: Identifying liquidity issues before they become critical. In a cash flow forecast, a negative closing balance is a red flag indicating potential insolvency. Candidates must be able to suggest viable solutions, such as negotiating longer payment terms with suppliers or arranging an overdraft facility.

    Examiner Expectation: When evaluating an investment using ARR, candidates should compare the calculated percentage against alternative investments or current interest rates to justify whether the investment is worthwhile.

    4. Marketing Research Findings

    Focus Areas: Primary and secondary data analysis.

    Key Skills: Evaluating the validity and reliability of market research. If a survey shows 80% customer satisfaction, candidates should question the sample size and demographic before accepting the data as a basis for a national product launch.

    Examiner Expectation: Use market research data to justify marketing mix (4Ps) decisions. For example, using demographic data to justify a targeted promotional campaign.

    5. Market Data Analysis

    Focus Areas: Market share, market size, and the impact of price/cost changes.

    The Data Interpretation Framework

    Key Skills: Calculating market share to determine competitive position. A business may see its sales revenue increase, but if the overall market size is growing faster, its market share is actually declining.

    Examiner Expectation: Link changes in costs (e.g., raw materials) to potential impacts on pricing strategy and subsequent effects on demand and revenue.

    Visual Resources

    2 diagrams and illustrations

    Profitability Ratios Explained
    Profitability Ratios Explained
    The Data Interpretation Framework
    The Data Interpretation Framework

    Interactive Diagrams

    1 interactive diagram to visualise key concepts

    The Data Interpretation Process Flow

    Worked Examples

    3 detailed examples with solutions and examiner commentary

    Practice Questions

    Test your understanding — click to reveal model answers

    Q1

    A business has fixed costs of £50,000, variable costs of £10 per unit, and a selling price of £25 per unit. Calculate the break-even point in units. (2 marks)

    2 marks
    standard

    Hint: Break-even = Fixed Costs / (Selling Price - Variable Cost)

    Q2

    Analyse the impact on a business's Net Profit Margin if its supplier increases raw material prices by 15%, assuming the business does not change its selling price. (6 marks)

    6 marks
    hard

    Hint: Trace the impact through the income statement: Costs ↑ → Gross Profit ↓ → Net Profit ↓.

    Q3

    Using the data provided (Revenue: £1.2m, Net Profit: £180,000), calculate the Net Profit Margin. (2 marks)

    2 marks
    standard

    Hint: Net Profit / Revenue x 100

    Q4

    Explain one limitation of using a cash flow forecast for business planning. (3 marks)

    3 marks
    standard

    Hint: Think about the word 'forecast' — it's a prediction, not a certainty.

    Q5

    A business is considering investing £100,000 in a new IT system. It expects total profit over 5 years to be £60,000. Calculate the Average Rate of Return (ARR). (4 marks)

    4 marks
    hard

    Hint: First, find the average annual profit. Then divide by the investment cost.

    Explore this topic further

    View Topic PageAll Business Topics

    Key Terms

    Essential vocabulary to know