Pearson Edexcel · GCSE · Business
Topic 2.4 Making financial decisions
Master the numbers that drive business success in Topic 2.4 Making Financial Decisions. From break-even analysis to cash flow forecasting, this guide provides the calculation strategies and analytical frameworks examiners reward with top marks.
- 4 min read
- 3 worked examples
- 5 practice questions
- 6 key terms
Study Notes
Overview

Topic 2.4 focuses on the quantitative tools businesses use to make informed decisions and assess their financial health. Examiners test your ability to not only perform calculations but to interpret what those figures mean for a business's future. You will need to demonstrate competence in calculating break-even points, forecasting cash flow, and analyzing financial performance through profitability ratios. The most successful candidates are those who can link numerical answers back to the specific business context provided in the source material.
Break-Even Analysis
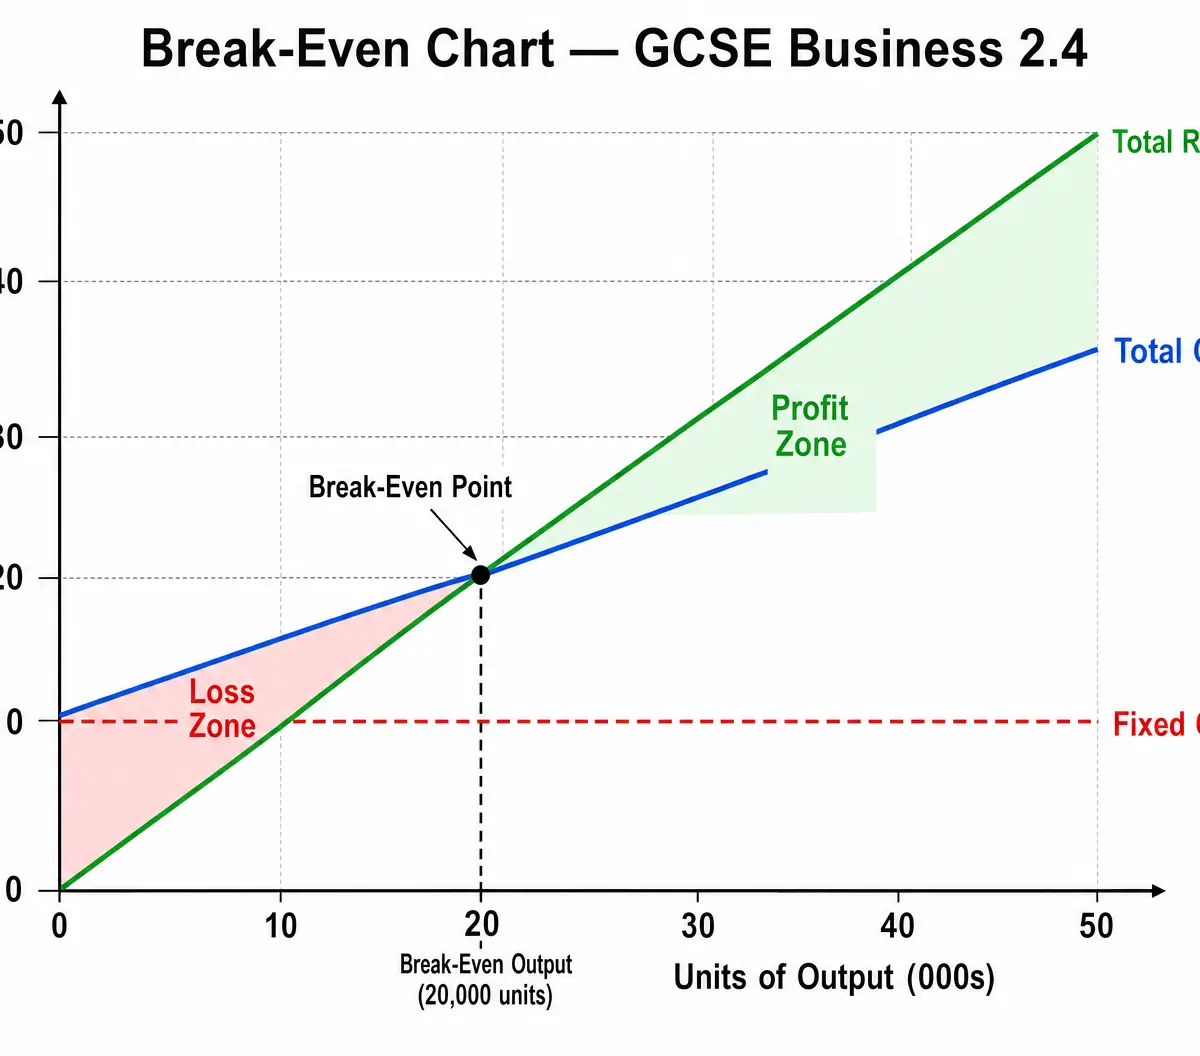
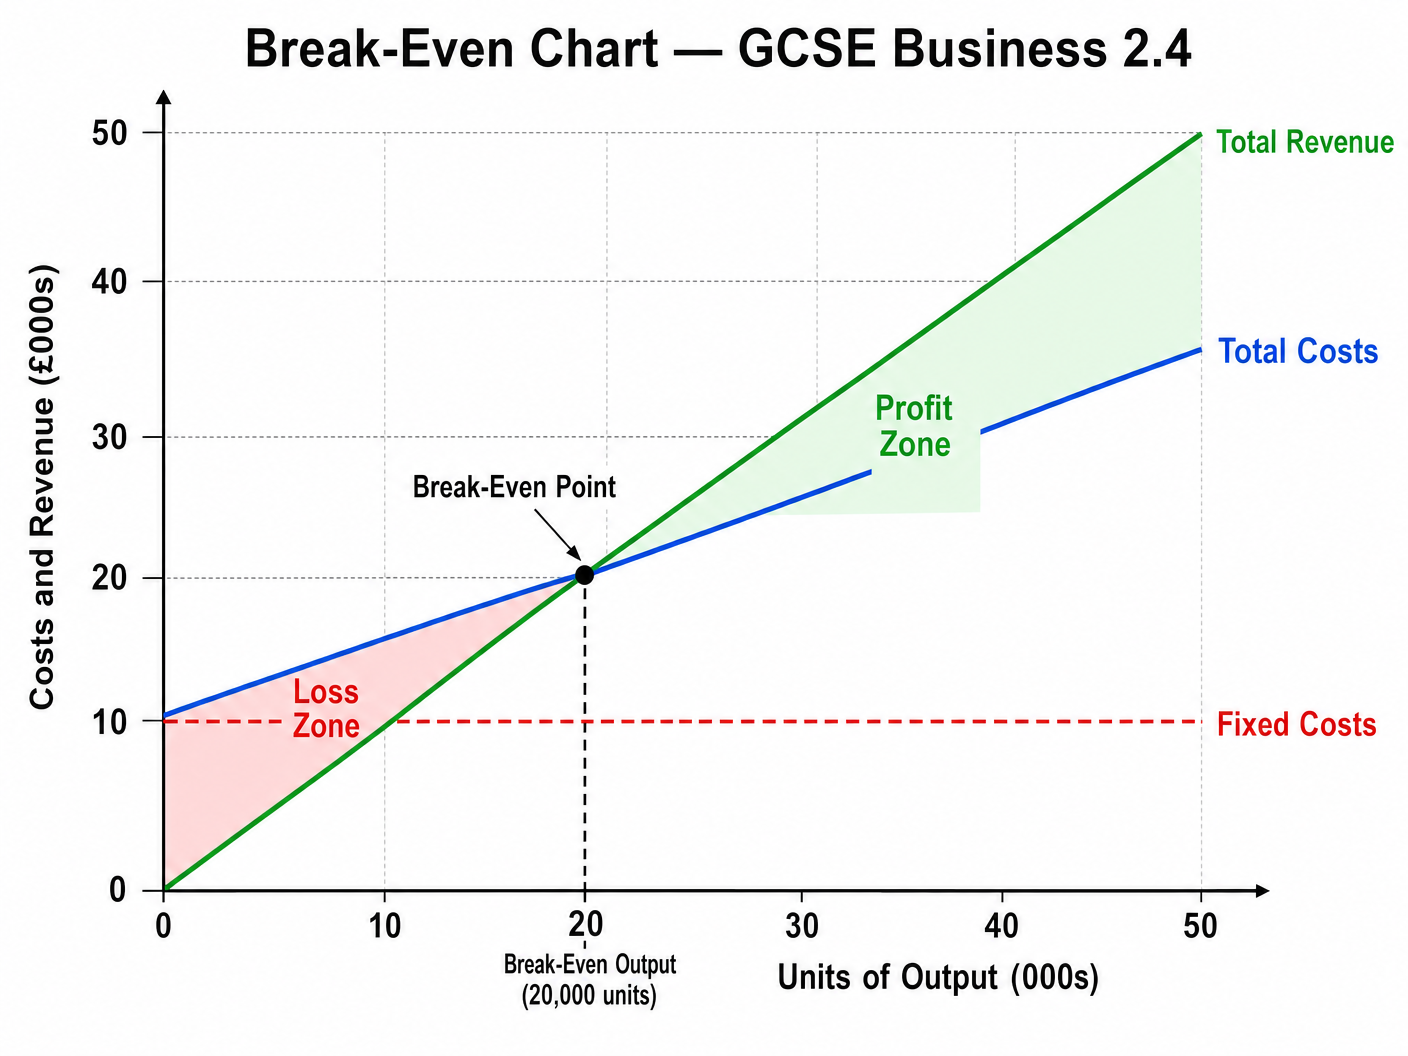
Break-even analysis helps a business determine the level of sales needed to cover all costs. It is the point where total revenue equals total costs, meaning the business makes neither a profit nor a loss.
Key Formulas
- Contribution per unit = Selling Price - Variable Cost per unit
- Break-even point = Fixed Costs / Contribution per unit
- Margin of Safety = Actual Sales - Break-even Sales
Why it matters for the exam
Examiners frequently ask candidates to calculate the break-even point from given data. Marks are awarded for showing the formula, substituting the correct figures, and stating the final answer with the correct units. You may also be asked to interpret a break-even chart, identifying the profit and loss zones, or to evaluate the limitations of break-even analysis (e.g., it assumes all output is sold at a constant price).
Cash Flow Forecasting
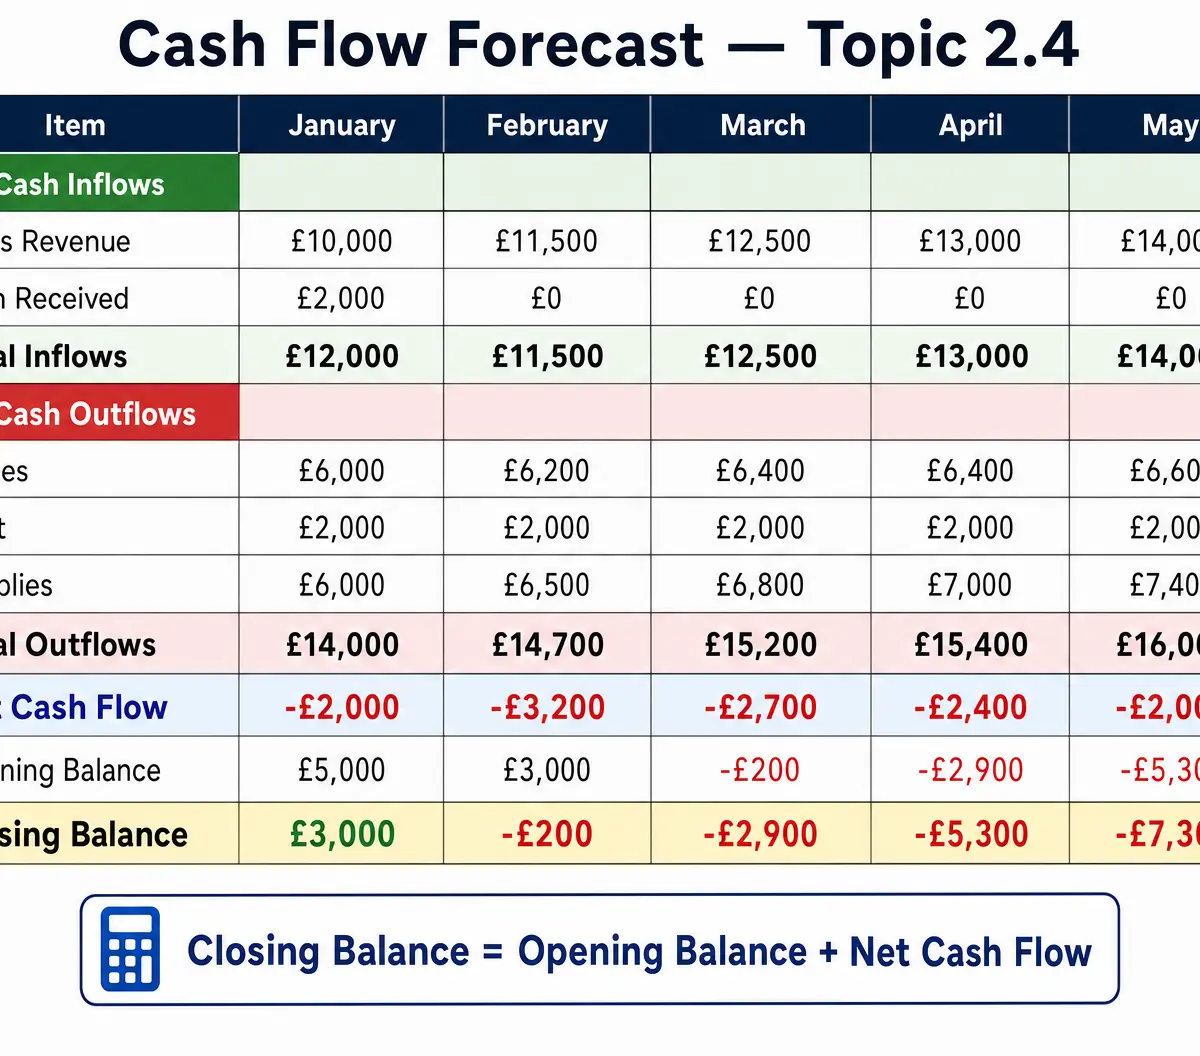
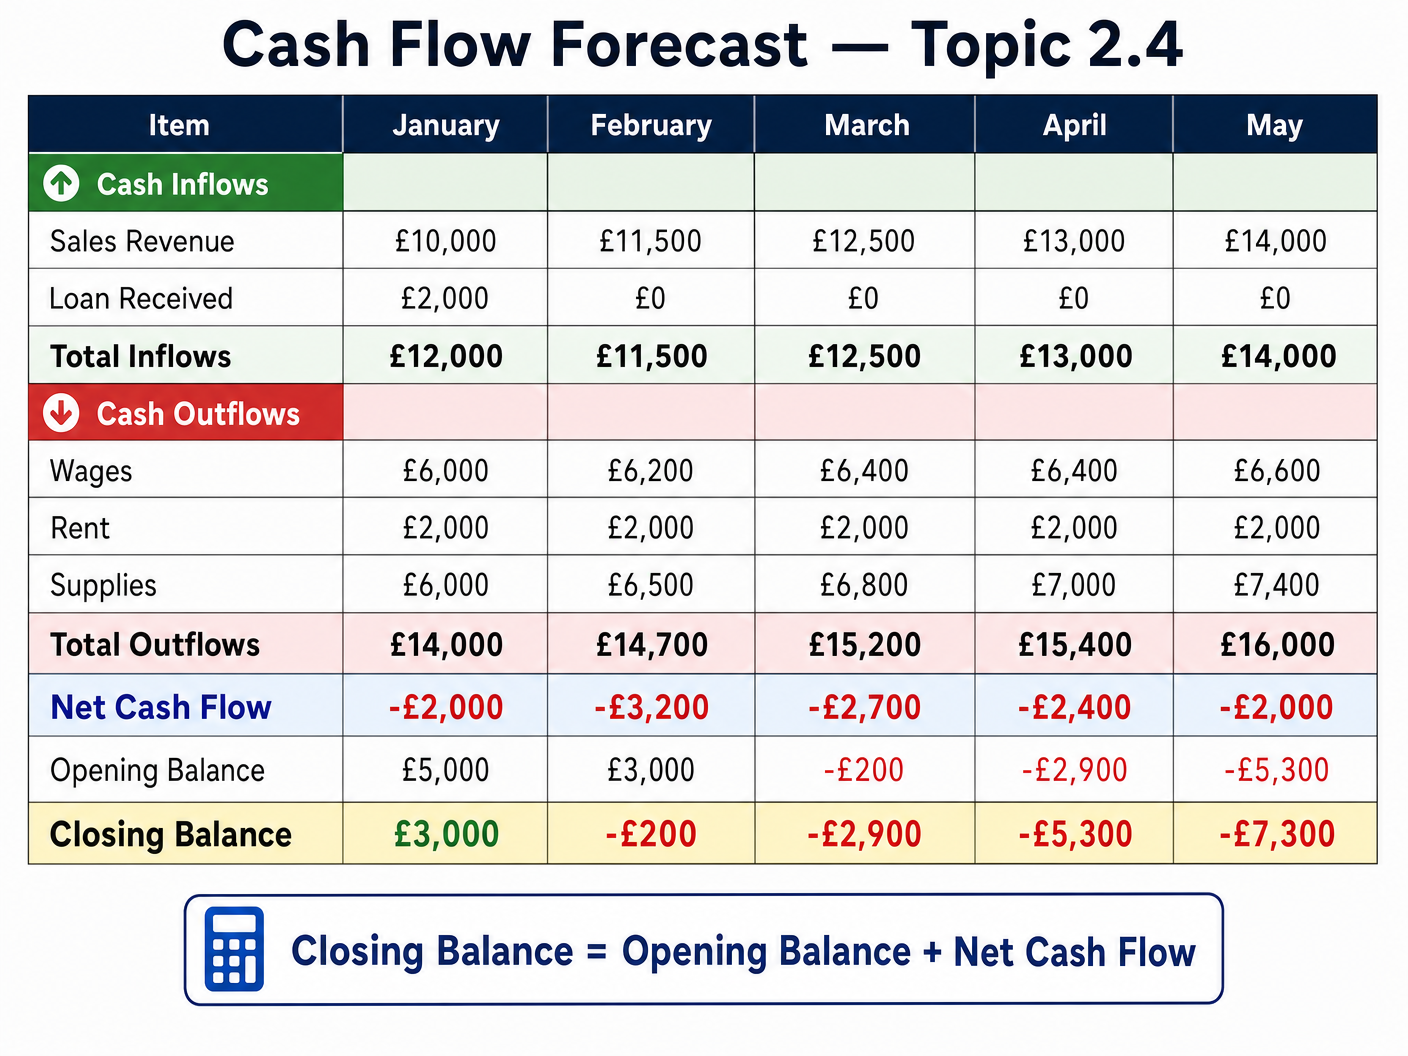
Cash flow is the movement of money into and out of a business. A cash flow forecast predicts these movements over a future period, helping a business identify potential liquidity problems before they occur.
Key Formulas
- Net Cash Flow = Total Inflows - Total Outflows
- Closing Balance = Opening Balance + Net Cash Flow
Why it matters for the exam
Candidates are often required to fill in missing figures in a cash flow forecast table. The most common error is confusing cash flow with profit. Remember, a profitable business can still fail if it runs out of cash. You must be able to suggest ways a business could improve its cash flow, such as delaying payments to suppliers, chasing debtors, or arranging an overdraft.
Financial Ratios
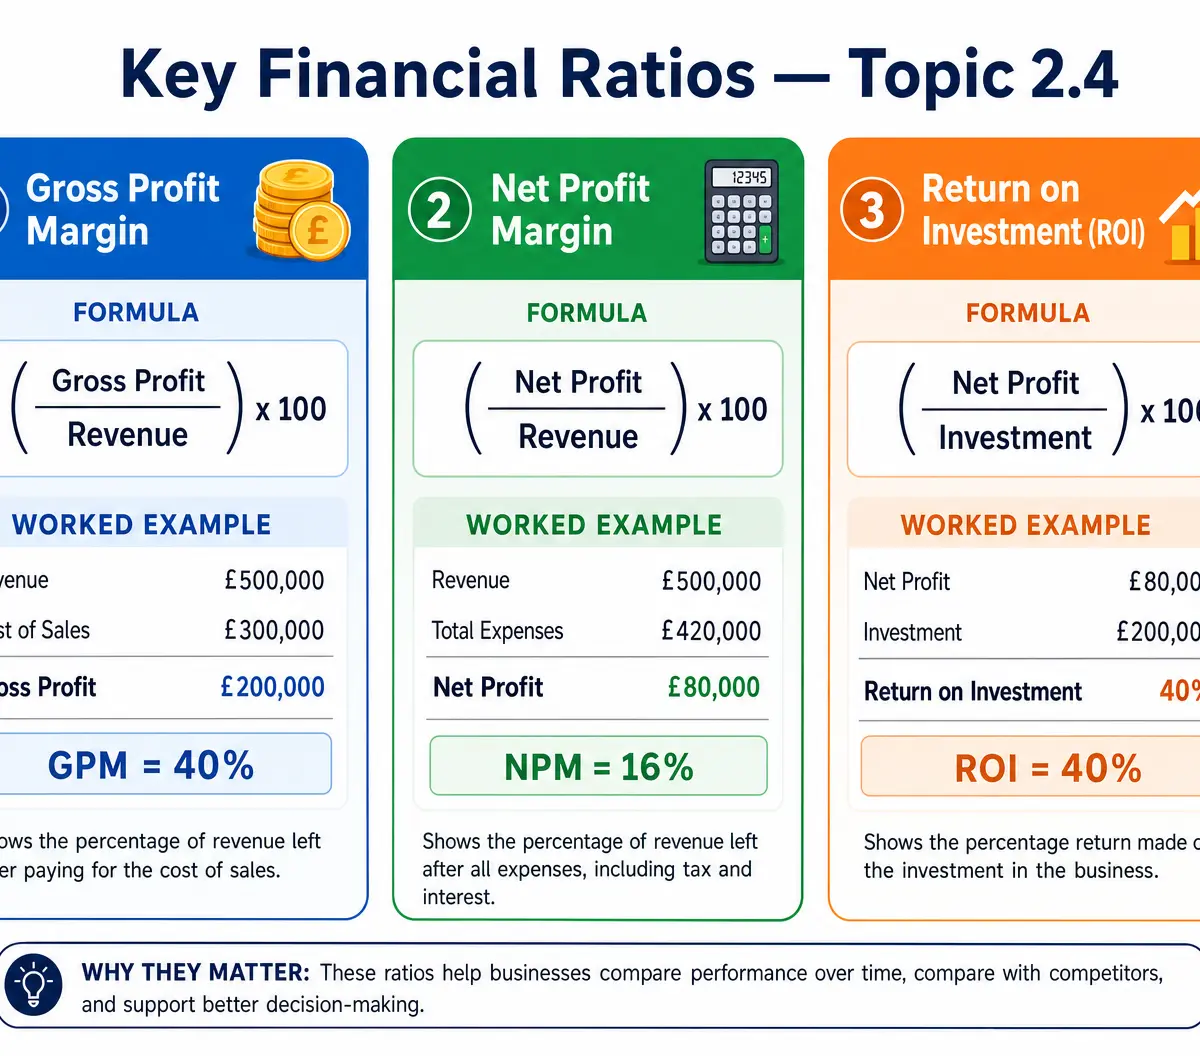
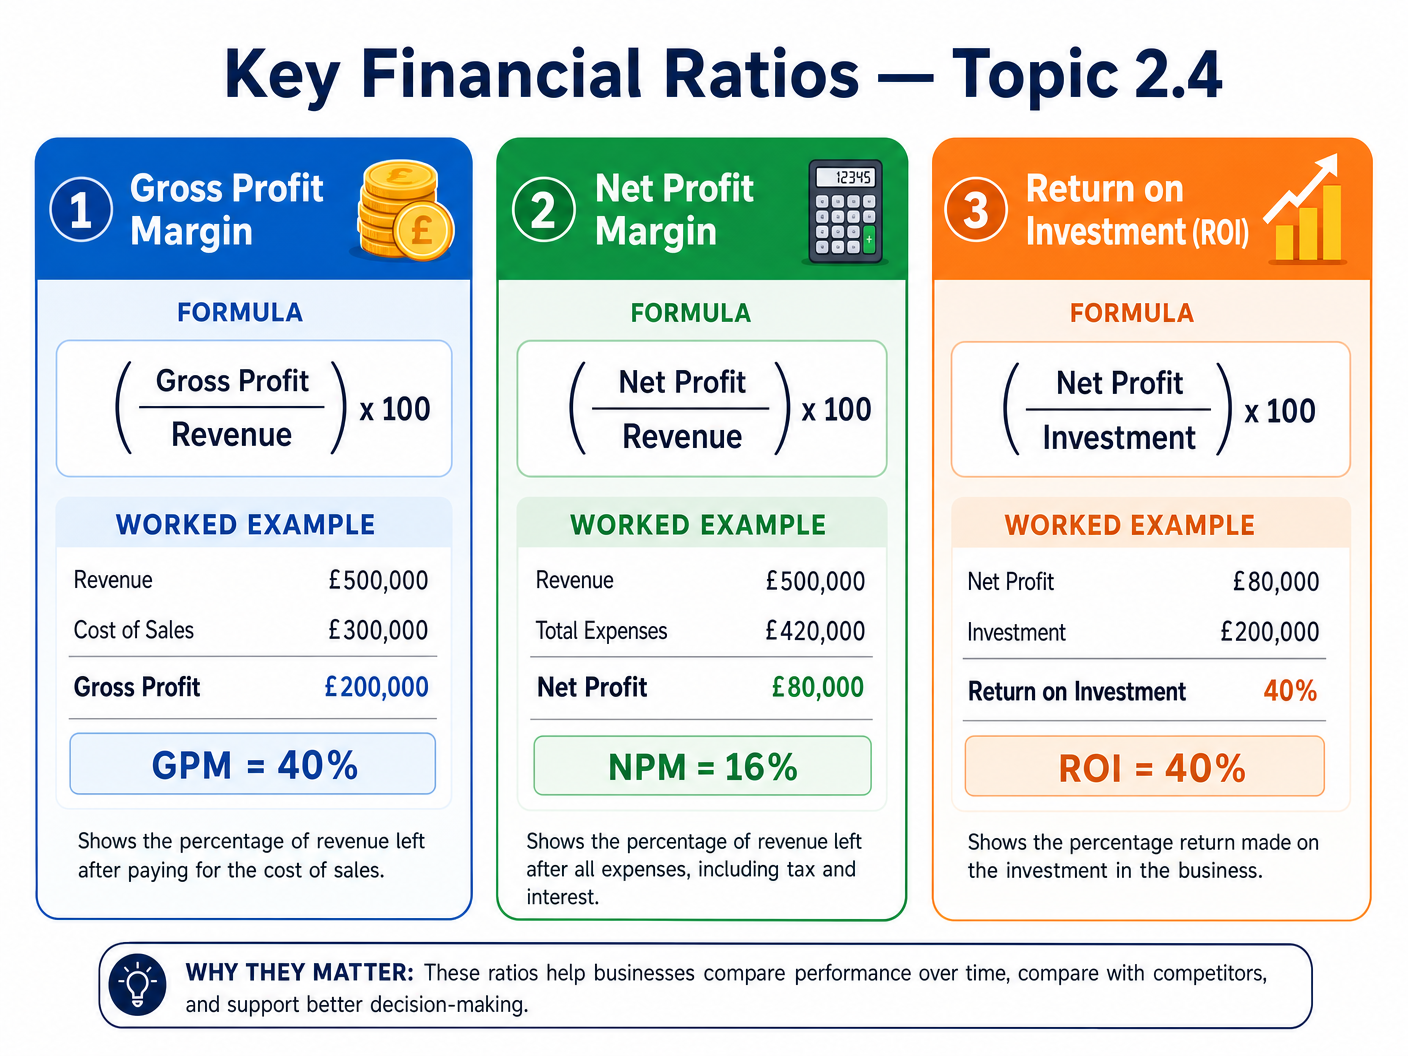
Financial ratios are used to assess a business's performance and compare it against previous years or competitors.
Key Formulas
- Gross Profit Margin = (Gross Profit / Revenue) x 100
- Net Profit Margin = (Net Profit / Revenue) x 100
Why it matters for the exam
Calculation questions on profit margins are standard. However, the higher marks (AO3) are awarded for analyzing why a margin might have changed. For instance, a falling gross profit margin might indicate rising raw material costs, while a falling net profit margin suggests overheads (like rent or salaries) are increasing faster than revenue.
Audio Revision
Listen to the comprehensive podcast covering all these topics:

Visual Resources
3 diagrams and illustrations
Interactive Diagrams
1 interactive diagram to visualise key concepts
Conceptual Flow Outline
The Profit Flow: From Revenue to Net Profit
Worked Examples
3 worked examples — open one to explore the question and available guidance.
Practice Questions
Test your understanding — click to reveal model answers
A cafe sells coffee for £3.00. The variable cost per cup is £1.00. Fixed costs are £1,500 per month. Calculate the margin of safety if they currently sell 1,000 cups a month. (4 marks)
Hint: You need to calculate the break-even point first before you can find the margin of safety.
Explain two ways a business could improve a negative net cash flow. (6 marks)
Hint: Think about how to increase money coming in quickly, or slow down money going out.
A business has seen its Gross Profit Margin remain at 40%, but its Net Profit Margin has fallen from 15% to 8%. Explain what this indicates about the business's financial performance. (4 marks)
Hint: What is the difference between gross profit and net profit?
Calculate the closing balance for March if the opening balance is £2,500, total inflows are £14,000, and total outflows are £18,000. (3 marks)
Hint: Calculate net cash flow first, then add it to the opening balance.
State the formula for Net Profit Margin. (1 mark)
Hint: It relates net profit to revenue.