Critical Path Analysis Revision Notes
Subject: Business | Level: A-Level | Exam Board: WJEC
Master WJEC A-Level Business Critical Path Analysis (CPA) with this comprehensive guide. Learn to construct network diagrams, calculate float, and identify the critical path to secure top marks. This guide breaks down the technical skills and evaluative analysis examiners are looking for.
Revision Notes & Key Concepts
Key Terms & Definitions
- Critical Path
- The sequence of activities in a project that has zero float, meaning any delay to these activities will delay the entire project.
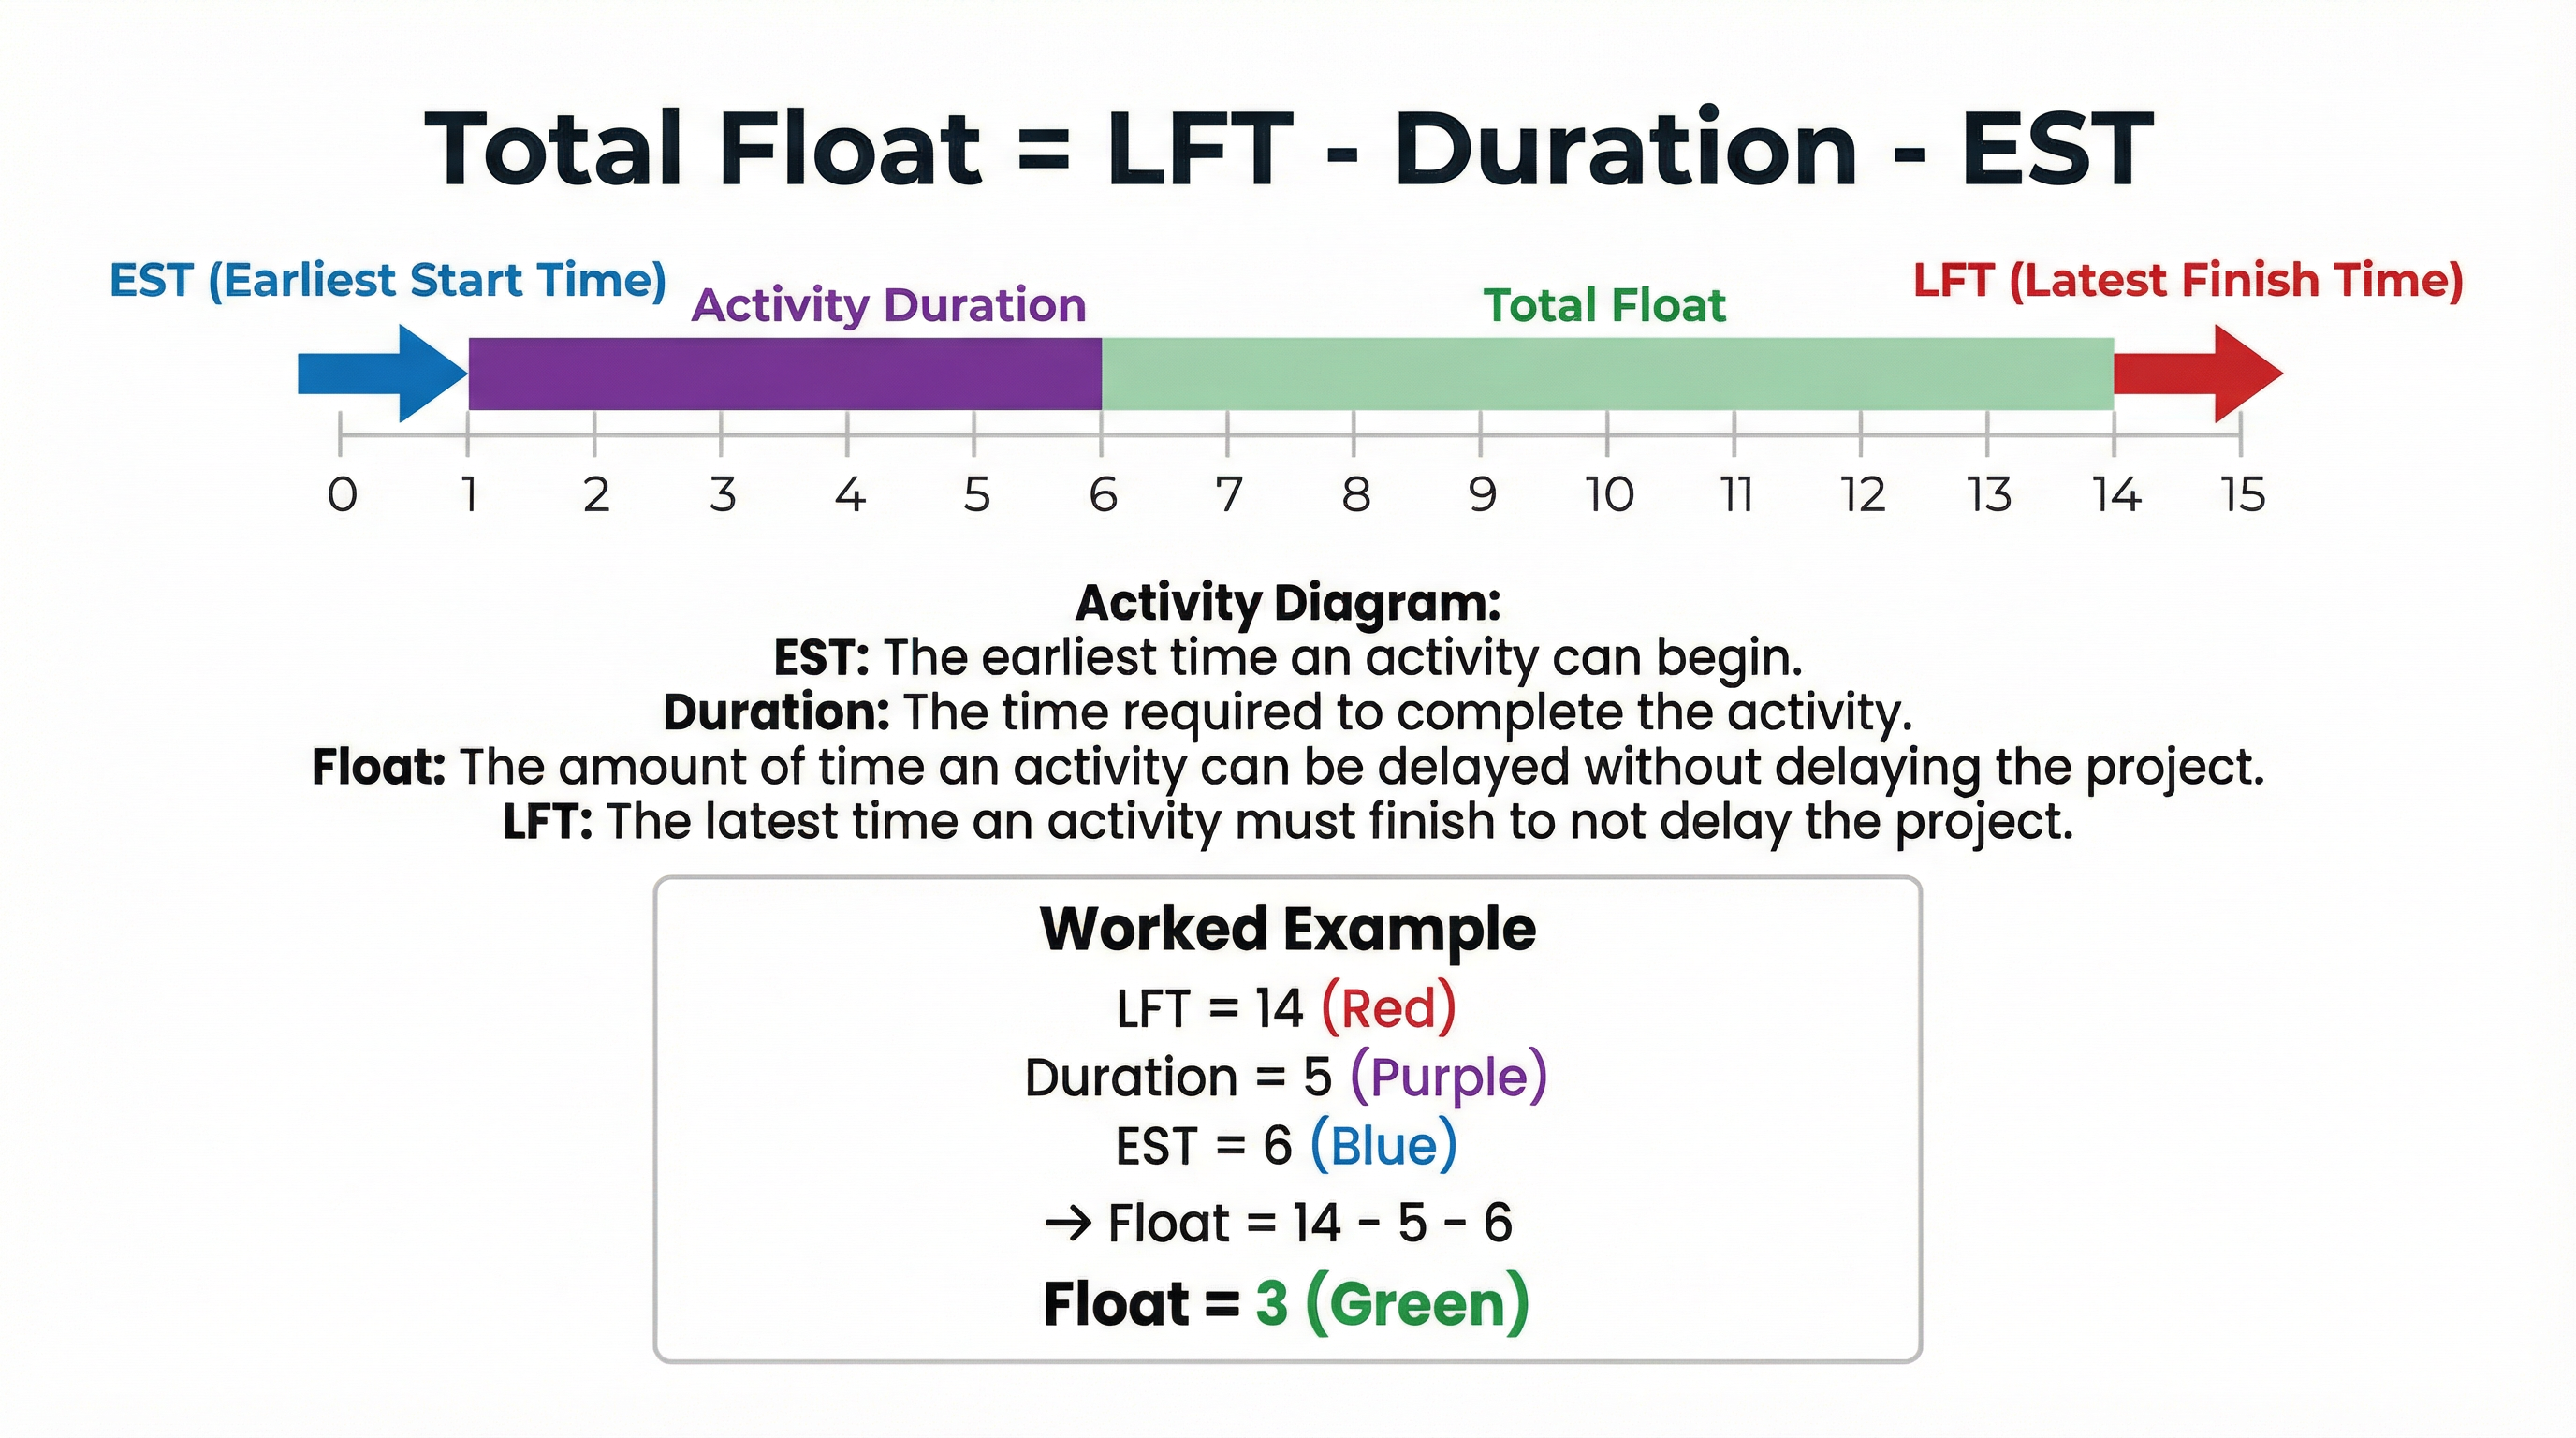
- Total Float
- The total time an activity can be delayed without delaying the project completion date. Calculated as LFT - Duration - EST.
- Dummy Activity
- An activity with zero duration and zero cost, represented by a dashed line. It is used to show a logical dependency where one does not otherwise exist.
- Node
- A circle on the network diagram that represents the start and/or end of an activity. It contains the EST and LFT.
- Forward Pass
- The process of working from left to right through the network diagram to calculate the Earliest Start Time (EST) for each activity.
- Backward Pass
- The process of working from right to left through the network diagram to calculate the Latest Finish Time (LFT) for each activity.
Worked Examples
Worked Example
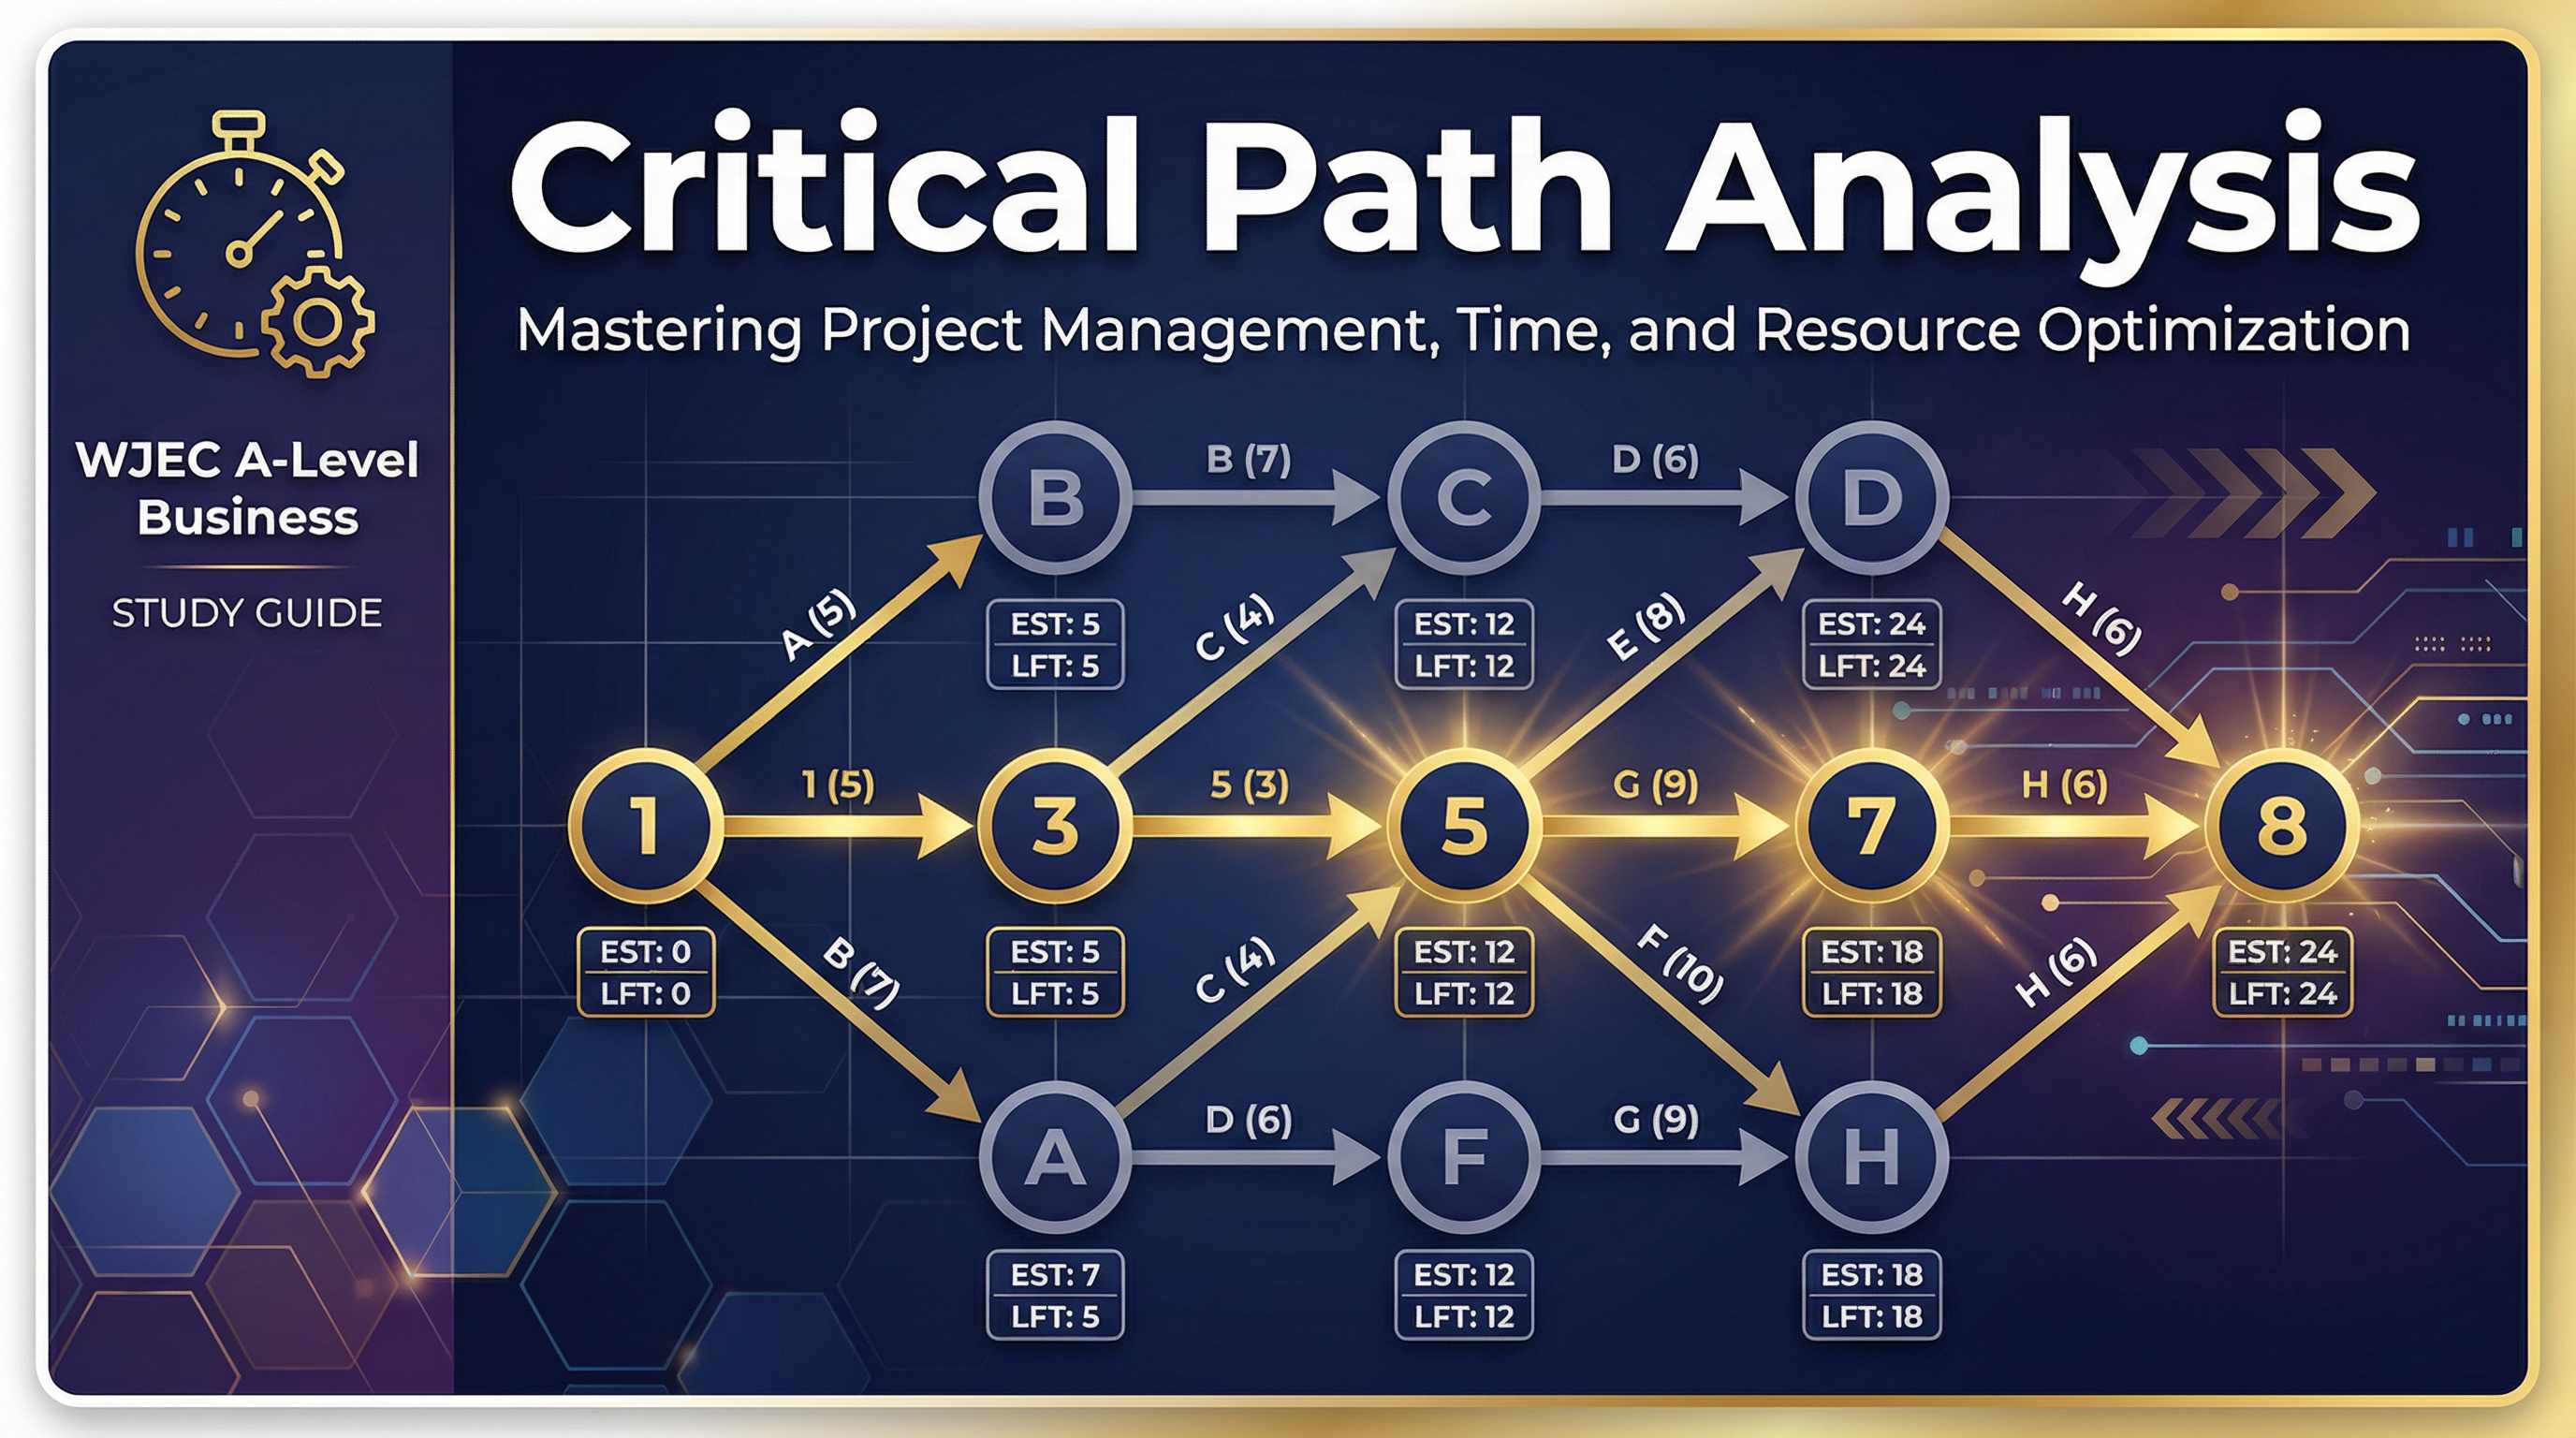
Question: The table below shows the activities required to launch a new marketing campaign. Construct a network diagram, identify the critical path, and state the minimum project duration. (8 marks)
Solution: **1. Construct the Diagram:** Draw the nodes and arrows based on the activity dependencies provided in the exam question. Ensure dummy activities are used where necessary to show correct logical relationships. **2. Forward Pass (Calculate ESTs):** Start at Node 1 (EST=0). Work left-to-right, adding durations. At merge nodes, take the MAXIMUM value. **3. Backward Pass (Calculate LFTs):** Start at the final node (LFT=EST). Work right-to-left, subtracting durations. At burst nodes, take the MINIMUM value. **4. Identify Critical Path:** The critical path follows the sequence of nodes where EST = LFT. Mark the corresponding activity arrows with double slashes (//). **5. State Minimum Duration:** The minimum project duration is the EST/LFT value at the final node. 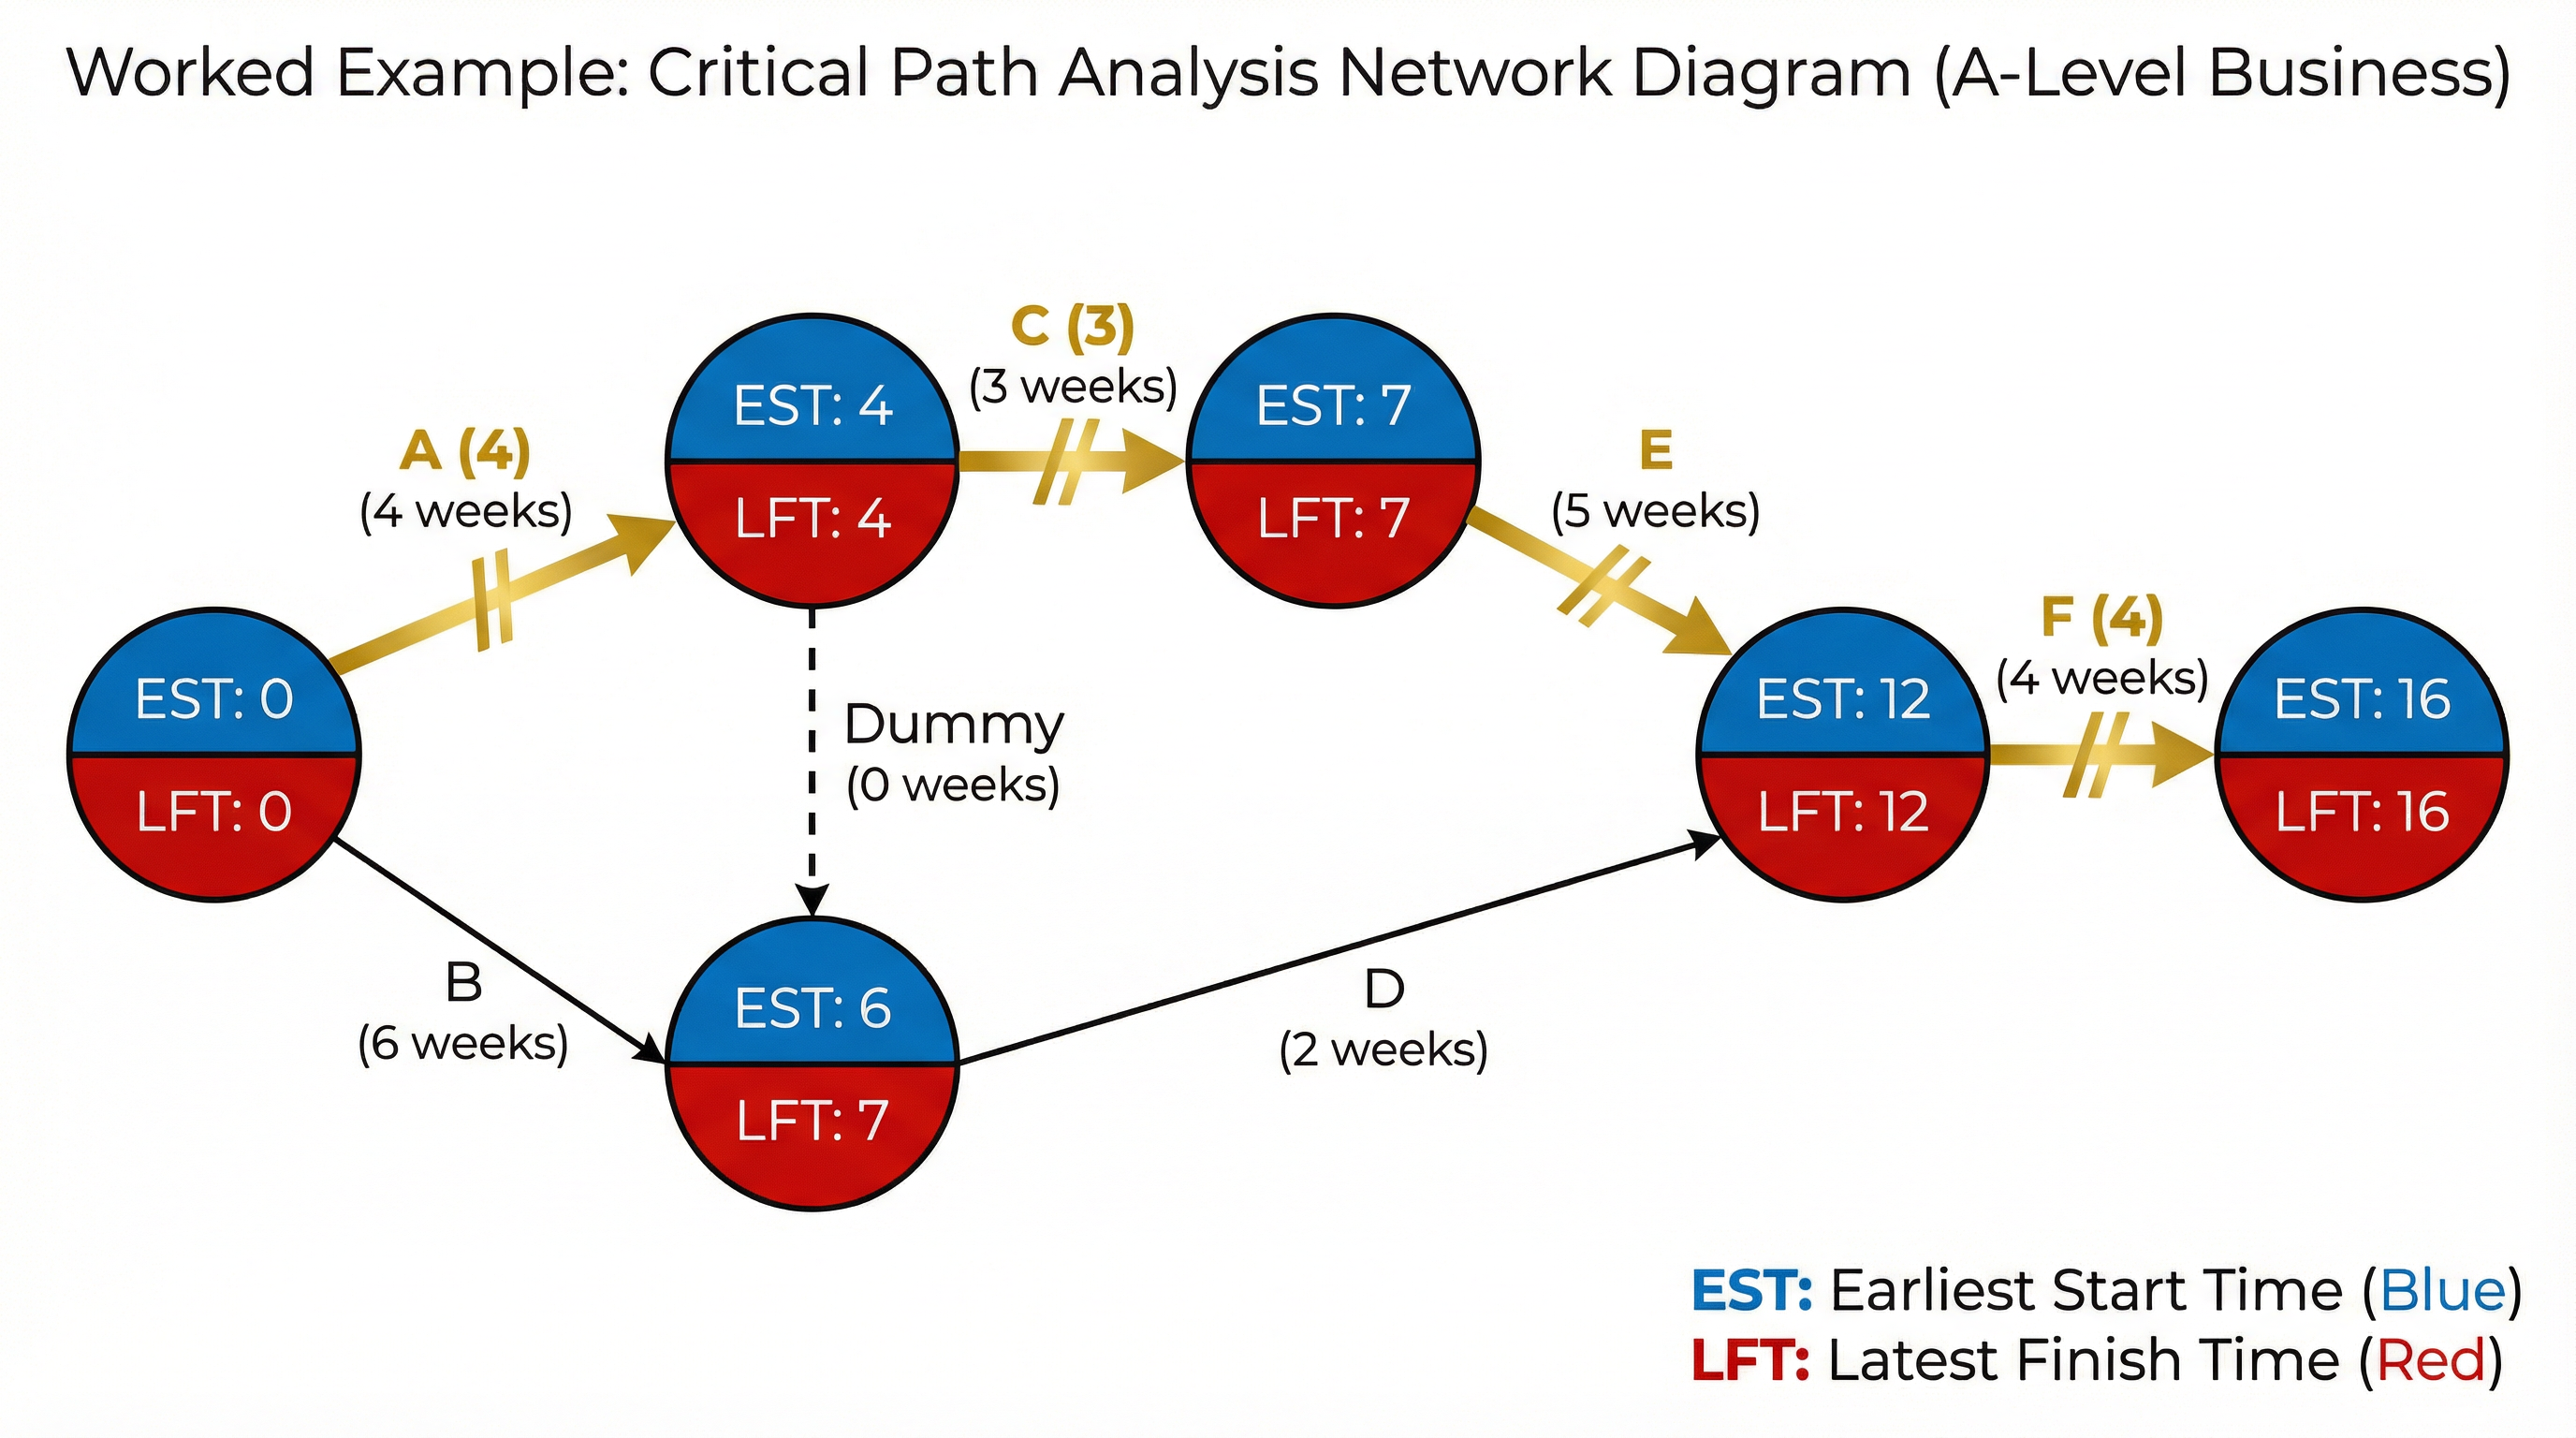
Worked Example
Question: Explain two benefits to a business of using Critical Path Analysis. (6 marks)
Solution: **Benefit 1 - Improved Resource Management:** CPA identifies activities with float (non-critical activities). This allows a manager to divert resources, such as staff or machinery, from these non-critical tasks to support activities on the critical path that may be facing delays. This flexibility helps keep the project on schedule and makes resource allocation more efficient, potentially reducing costs associated with idle resources. (3 marks) **Benefit 2 - Better Cash Flow Management:** By providing a clear timeline for the entire project, including the start and finish times of all activities, CPA enables more accurate financial planning. The business can forecast when payments to suppliers for materials will be due and, crucially, when the project will be completed and revenue can be generated or payment from a client received. This improves the accuracy of cash flow forecasts, reducing the risk of liquidity problems. (3 marks)
Worked Example
Question: Evaluate the usefulness of Critical Path Analysis to a software development company planning the launch of a new app. (12 marks)
Solution: **Introduction:** Critical Path Analysis is a project management tool that can be highly useful for a software company by providing a structured timeline. However, its usefulness is limited by the creative and unpredictable nature of software development. **Usefulness (AO3):** CPA would be useful for planning predictable tasks such as securing funding, marketing, and App Store submission. It would identify the critical sequence of these tasks, ensuring the launch is not delayed by a failure to complete a key administrative step. It also allows for the calculation of float on non-critical tasks, like designing secondary app features, giving the company flexibility. This helps in allocating developers to fix bugs on critical features without delaying the launch, which is a key benefit. **Limitations (AO4):** However, the core activity of software development is creative and complex, making accurate time estimates for coding and bug-fixing notoriously difficult. If these estimates are wrong, the critical path identified by CPA becomes meaningless. A task estimated at 2 weeks could take 5, completely invalidating the plan. Furthermore, agile development methodologies, common in tech, favour iterative sprints over a rigid, pre-planned sequence, making CPA seem overly bureaucratic and restrictive. **Conclusion (AO4 Judgement):** In conclusion, while CPA is useful for managing the business and marketing aspects of an app launch, its application to the core software development process is limited. A software company would be better served using a hybrid approach: CPA for the predictable, linear tasks (marketing, legal), and an agile methodology for the development and coding itself. Therefore, CPA is only moderately useful, as it cannot fully encompass the complexity and uncertainty of the creative development process.
Practice Questions
Question: A construction project has the activities listed below. Calculate the total float for activity B. (4 marks)
Answer:
Question: Explain why the time estimates used in Critical Path Analysis may be inaccurate. (4 marks)
Answer:
Question: To what extent is Critical Path Analysis a vital tool for a business organising a large-scale music festival? (16 marks)
Answer: