Study Notes

Overview
Welcome to the cutting edge of analytical chemistry! Instrumental Methods (WJEC specification 9.1) explores the powerful modern techniques that have revolutionised how chemists identify and quantify substances. This topic marks a shift from traditional, manual laboratory tests (like adding reagents and observing colour changes) to highly automated, computer-controlled analysis. In the exam, candidates are expected to understand why these instrumental methods are superior and, crucially, how to interpret the data they produce. You will focus on two key techniques: Gas Chromatography (GC) for separating mixtures and Mass Spectrometry (MS) for identifying compounds. Questions will often present you with graphical data—a chromatogram or a mass spectrum—and ask you to draw conclusions, making data analysis skills essential. This topic links directly to organic chemistry (identifying unknown organic molecules) and concepts of purity.
Key Concepts
Concept 1: The Advantages of Instrumentation
Examiners frequently ask candidates to explain why instrumental methods are preferred over older, manual chemical tests. To secure full marks, you must be precise. Simply stating they are 'better' will not be credited. The three key advantages you must memorise are:
- Sensitivity: Instruments can detect incredibly small quantities of a substance, far smaller than can be observed by eye in a traditional test. This is vital in applications like drug testing in sports or detecting pollutants in water.
- Accuracy: Modern instruments provide highly accurate and precise results. They minimise human error associated with measuring volumes or judging colour changes, leading to more reliable data.
- Speed (Rapid Analysis): Instrumental analysis is extremely fast, often providing results in minutes. This allows for rapid screening of large numbers of samples, essential in industrial quality control or forensic investigations.
Concept 2: Gas Chromatography (GC)
Gas Chromatography is a powerful technique used to separate the components of a volatile mixture. Think of it as a race for molecules. The mixture is injected into the instrument, where it is vaporised and carried by an inert gas (the mobile phase) through a long, coiled tube called a column (the stationary phase).
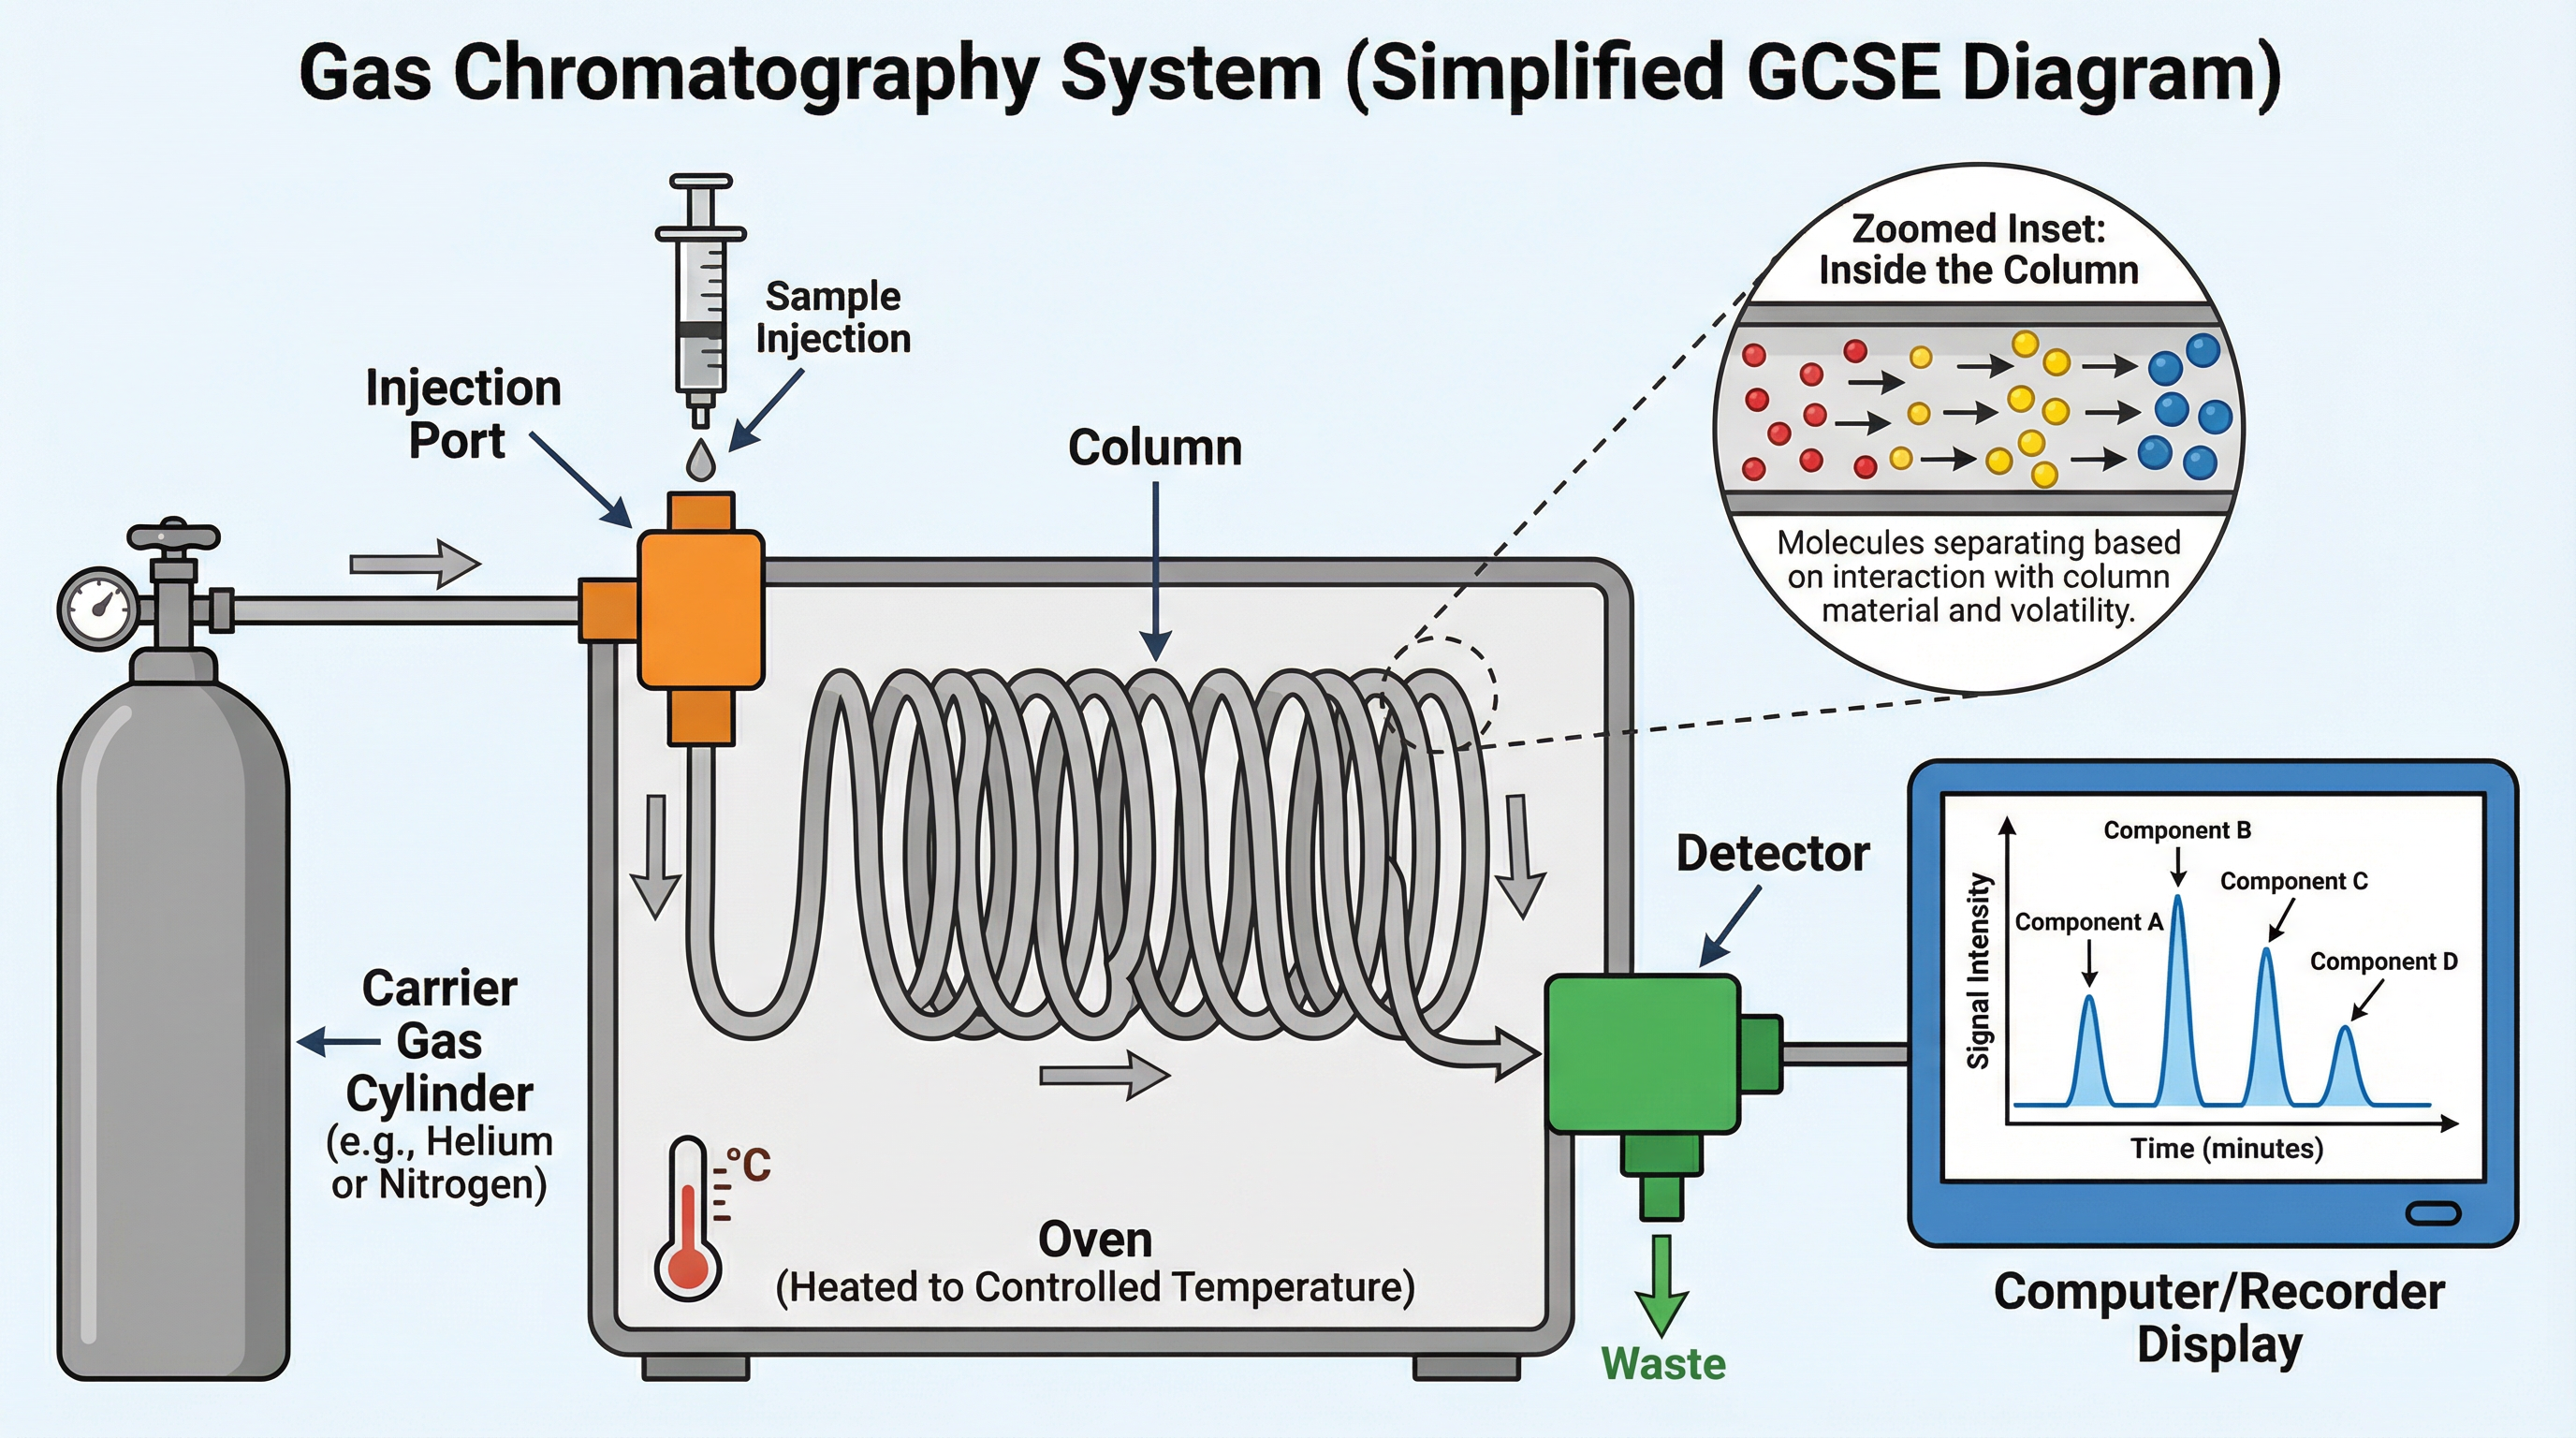
Different substances in the mixture will travel through the column at different speeds. This is because they interact differently with the stationary phase lining the column. Some will 'stick' to the lining more strongly and move slowly, while others will pass through quickly. The time it takes for a component to travel through the column and reach the detector is called its retention time. Each substance has a unique retention time under specific conditions, which allows for its identification.
**Interpreting a Gas Chromatogram:**The output from a GC is a graph called a chromatogram. Credit is given for correctly interpreting these graphs:
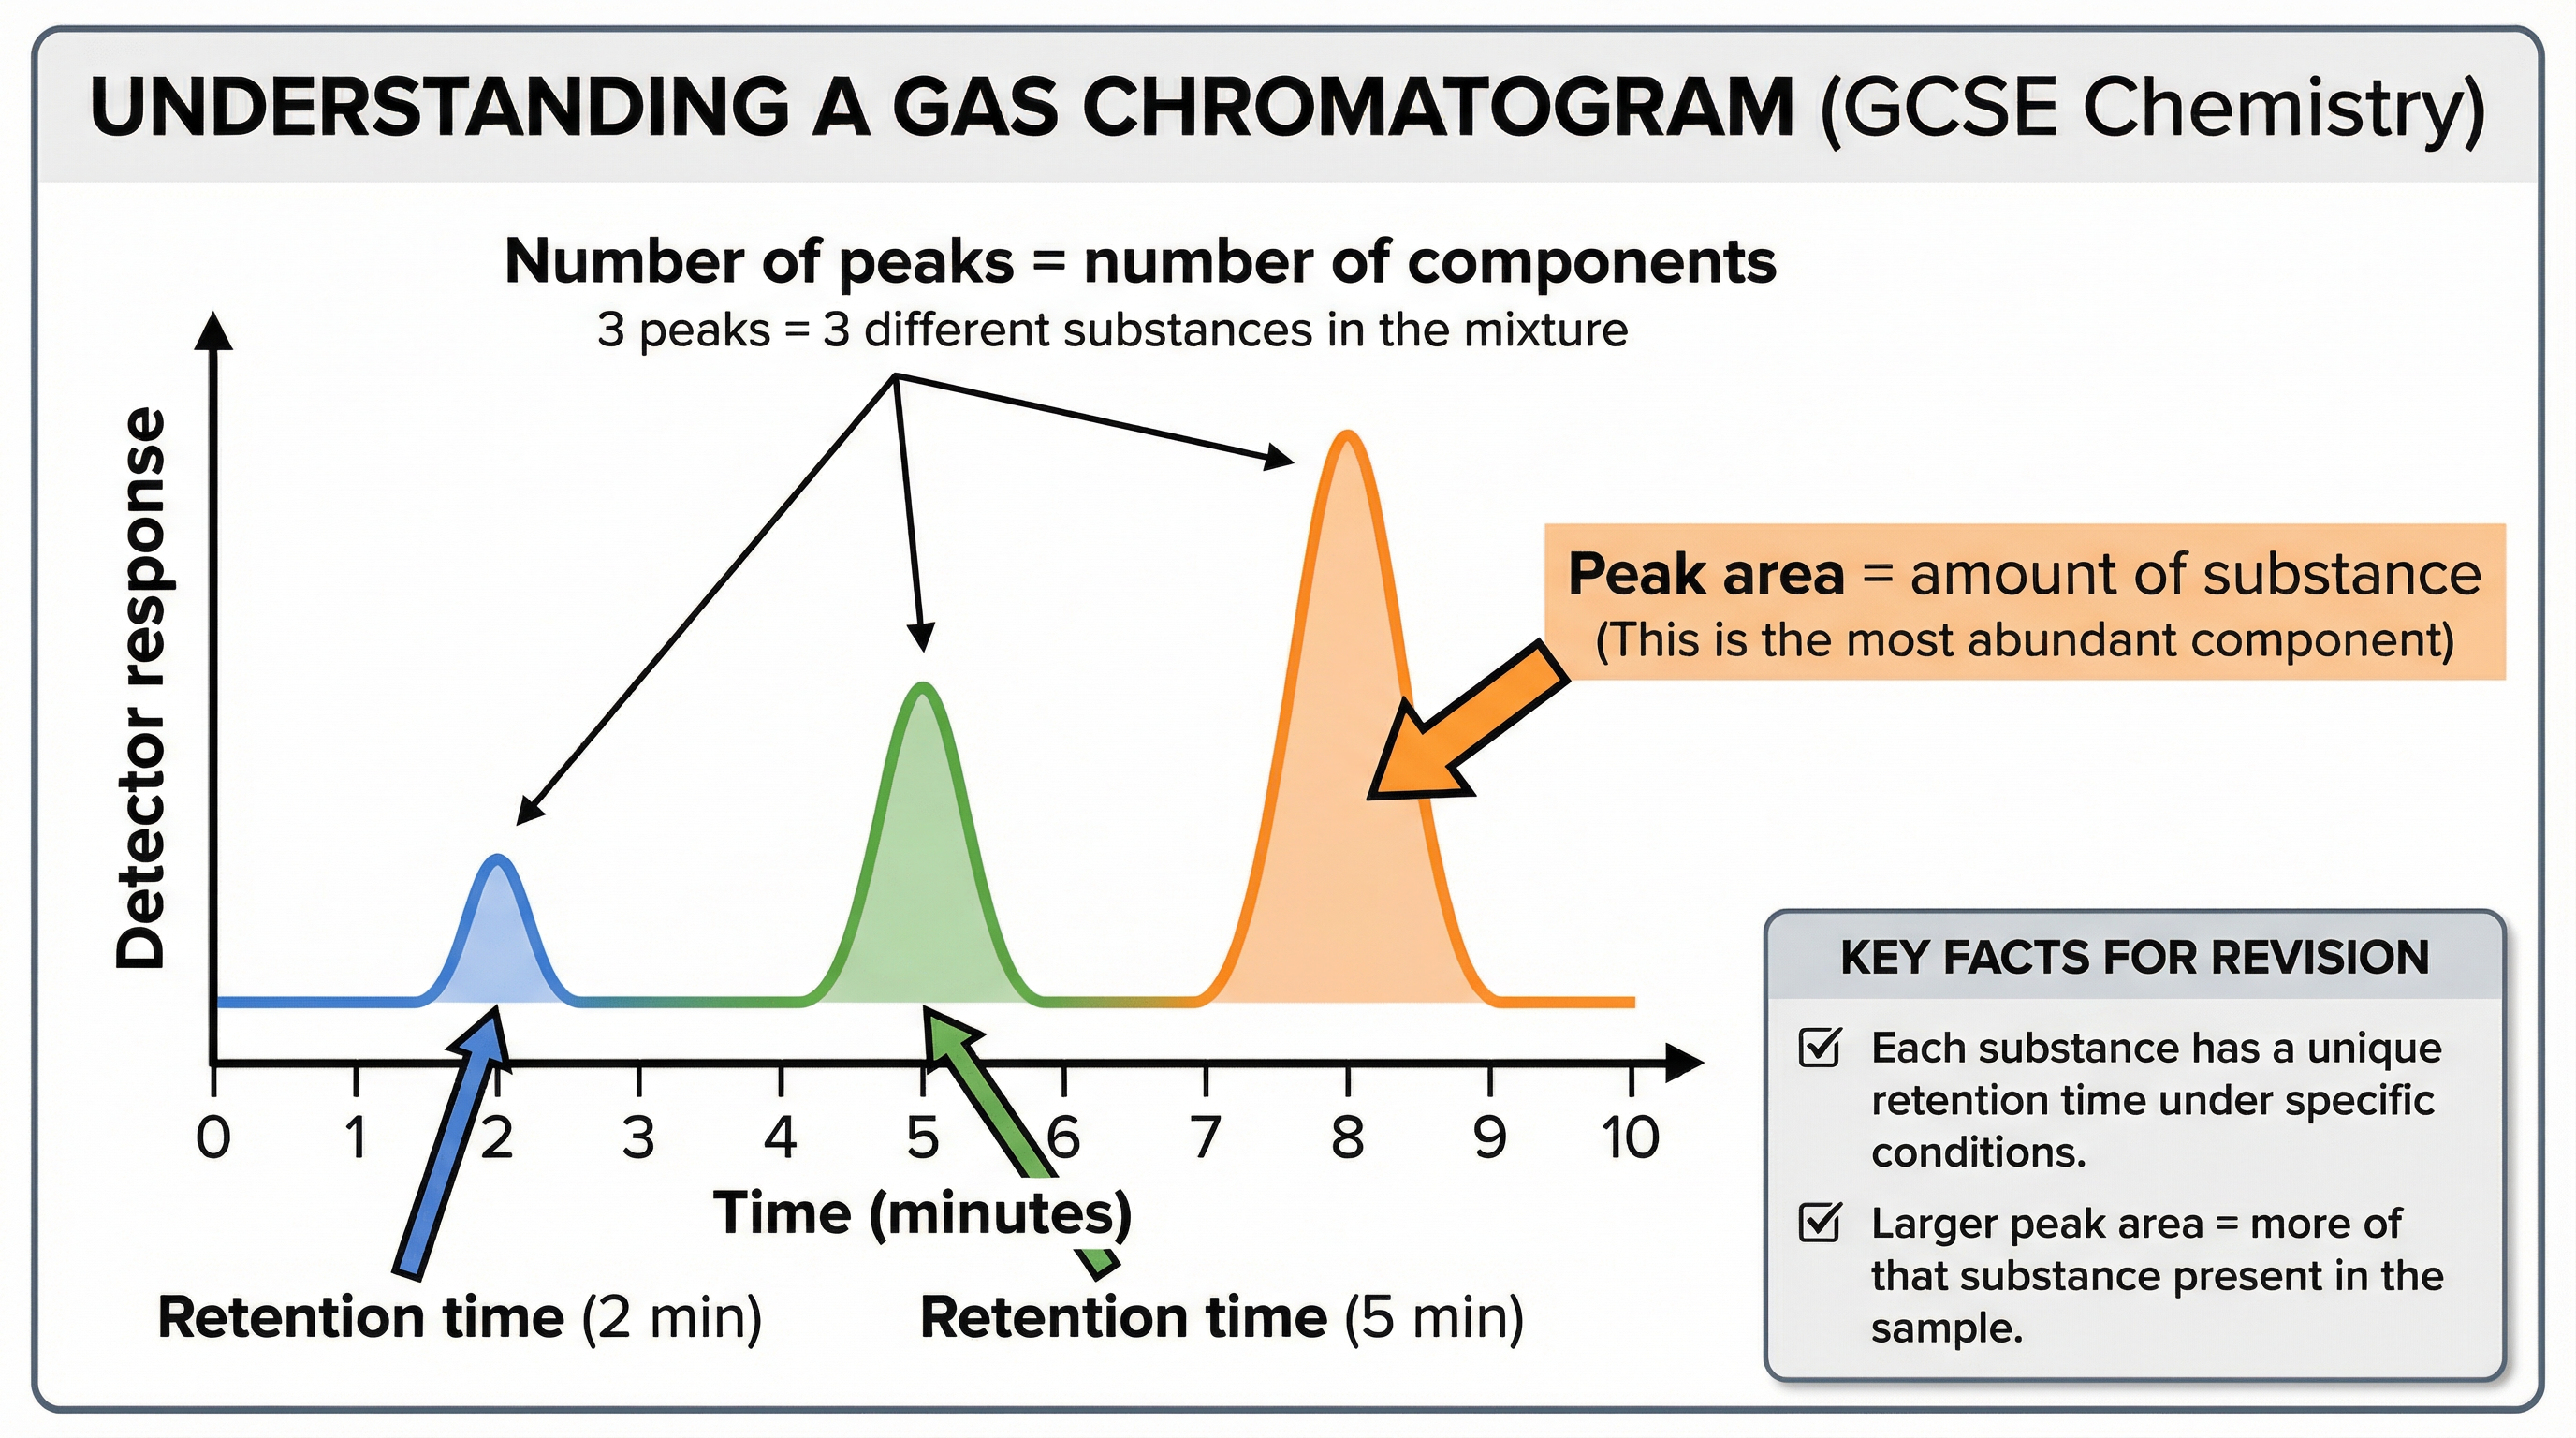
- Number of Peaks: The number of peaks corresponds to the minimum number of different substances in the mixture.
- Retention Time: The position of a peak on the x-axis gives the retention time, which can be used to identify a substance by comparing it to the retention times of known standards.
- Peak Area: The area under each peak is proportional to the relative amount of that component in the mixture. A larger peak area means a higher concentration of that substance.
Concept 3: Mass Spectrometry (MS)
While GC separates a mixture, Mass Spectrometry is used to identify the substances, specifically by determining their relative molecular mass (Mr). It is often coupled with GC (in a GC-MS system) to provide a complete analysis.
Here’s how it works:
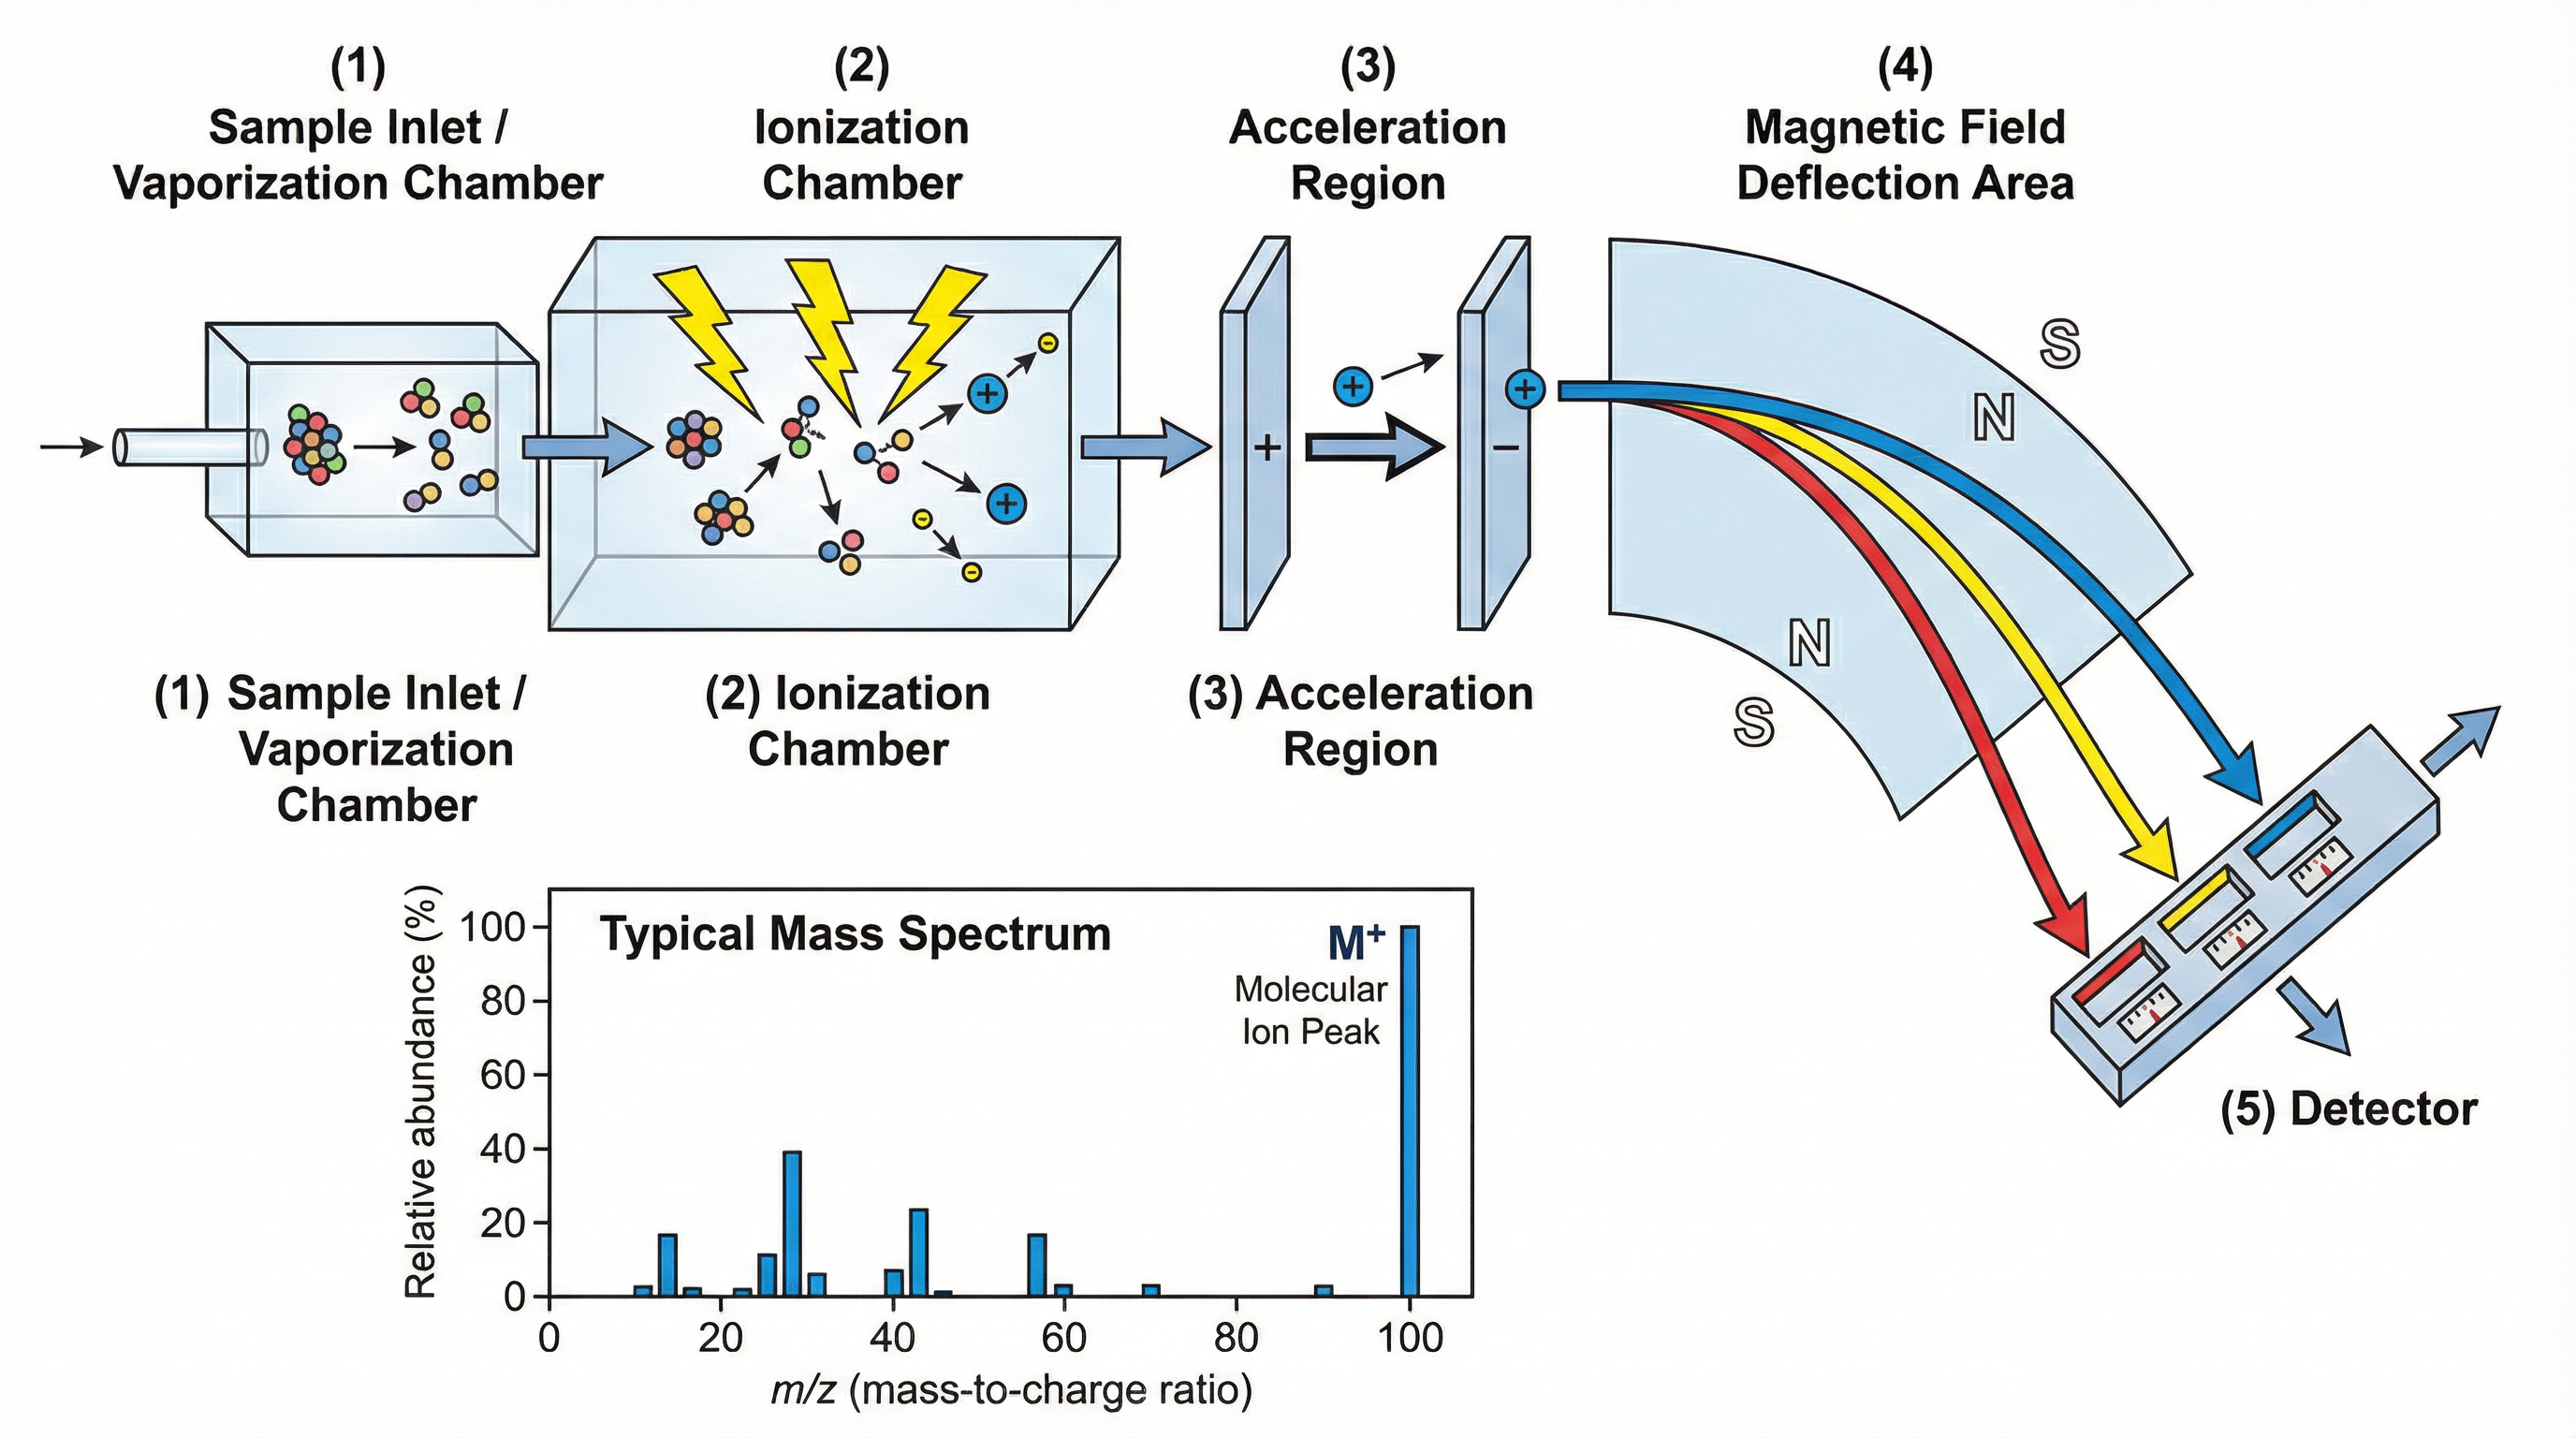
- Ionisation: The sample is bombarded with high-energy electrons, which knock one or more electrons off the molecules to form positive ions.
- Acceleration: The positive ions are accelerated by an electric field so that they all have the same kinetic energy.
- Deflection: The ions are then deflected by a powerful magnetic field. The amount of deflection depends on the ion's mass-to-charge ratio (m/z). Lighter ions are deflected more than heavier ions.
- Detection: The detector records the abundance of ions at each m/z value.
**Interpreting a Mass Spectrum:**The output is a mass spectrum. The most important peak to identify is the molecular ion peak (M+). This is the peak with the highest m/z value (the one furthest to the right). Its m/z value is equal to the relative molecular mass (Mr) of the compound. Other peaks at lower m/z values are called fragment peaks, caused by the original molecule breaking apart during ionisation.
Common Mistake: Do not confuse the molecular ion peak with the 'base peak', which is simply the tallest peak on the spectrum and represents the most abundant fragment.
Mathematical/Scientific Relationships
There are no complex mathematical formulas to memorise for this topic at GCSE level. The key relationships are conceptual:
- In Gas Chromatography:
Peak Area ∝ Concentration. The area under a peak is directly proportional to the amount of the substance that created it. - In Mass Spectrometry:
m/z of Molecular Ion Peak = Relative Molecular Mass (Mr). This is the fundamental relationship used for identification.
Practical Applications
Instrumental methods are not just abstract concepts; they are used every day in a huge range of fields:
- Forensic Science: Analysing fibres, paint chips, or traces of accelerant from a crime scene using GC-MS.
- Environmental Monitoring: Detecting pollutants like pesticides in river water or toxic gases in the air.
- Food Industry: Ensuring food quality and safety by checking for contaminants or verifying the concentration of flavour compounds.
- Healthcare: Used in drug testing for athletes or for analysing patient samples in hospitals.
- Space Exploration: Rovers on Mars have used instrumental methods to analyse the composition of Martian soil and atmosphere.