AQA · GCSE · Combined Science
Course version: 8464 · Version from Sept 2018
Biotic factors: Students should be able to extract and interpret information from charts, graphs and tables relating to the effect of biotic factors on organisms within a community.
Biotic factors are living influences on organisms in a community, such as food availability, predators, pathogens and competition.
Study notes
From the checked teaching notes for this specification point.
The idea
Biotic factors are living influences on organisms in a community, such as food availability, predators, pathogens and competition. To extract information, read the title, axis labels, units and key first, then locate the relevant data point or trend. To interpret, link the pattern to a biological effect: for example, a graph showing increasing predator numbers followed by falling prey numbers suggests predation reduces prey population. In a table, compare values across rows or columns to identify which factor changes most. Always quote figures with units and state the direction of change. Explain the effect using cause and effect, not just description, and consider that other biotic or abiotic factors may also act.
What earns the marks
- Identify the independent variable, dependent variable and any control or comparison group from the chart, graph or table.
- Read values accurately from axes or table cells, including units and any stated uncertainty or sample size.
- Describe the trend or pattern, such as increase, decrease, plateau or cyclical change, using comparative language.
- Interpret the pattern biologically, linking a named biotic factor to a named effect on organisms in the community.
- Use data as evidence, quoting specific figures with units to support the interpretation.
- Recognise limitations, such as correlation not proving causation or other factors affecting the community.
Common mistakes and how to put them right
Describing the graph shape without interpreting it biologically.
Put it right by linking each trend to a named biotic factor and its effect on organisms.
Reading the wrong axis or ignoring units.
Put it right by checking axis labels, scales and units before quoting any value.
Treating a correlation as proof of cause.
Put it right by stating that the data suggest a relationship and that other factors may also be involved.
Exam tips
- Underline the command word, such as describe or explain, and match your answer to it.
- Quote at least one pair of figures with units from the chart, graph or table as evidence.
- Use comparative connectives such as whereas, therefore and as a result to make the link between data and biology clear.
Try the lesson
The start of the Biotic factors: Students should be able to extract and interpret information from charts, graphs and tables relating to the effect of biotic factors on organisms within a community. lesson, made from checked teaching notes for this specification point.
Have a go first
A student investigated the effect of a new predator on a prey population. The table shows the number of foxes (predator) and rabbits (prey) counted in a woodland over four years. | Year | Number of foxes | Number of rabbits | |---|---|---| | 2018 | 10 | 350 | | 2019 | 25 | 280 | | 2020 | 45 | 150 | | 2021 | 60 | 80 | In which year was the rabbit population the smallest?
See it
Put it in order
Put these steps in the order they happen.
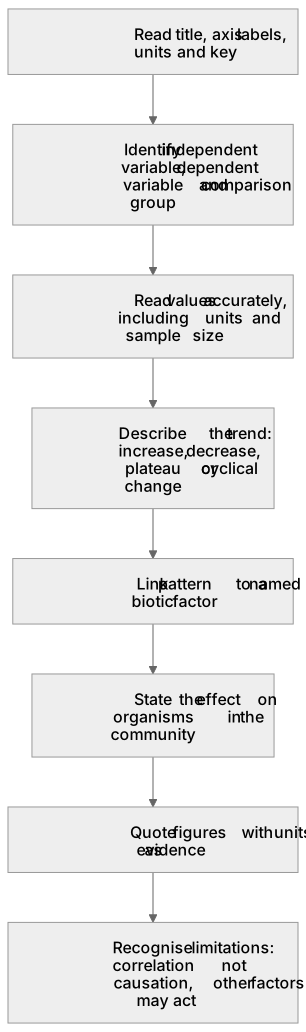
- 1. Identify independent variable, dependent variable and comparison group
- 2. Read values accurately, including units and sample size
- 3. Describe the trend: increase, decrease, plateau or cyclical change
- 4. Link pattern to a named biotic factor
- 5. State the effect on organisms in the community
- 6. Quote figures with units as evidence
- 7. Recognise limitations: correlation not causation, other factors may act
- 8. Read title, axis labels, units and key
Label the diagram
Some boxes have lost their names. Pick the right name for each number.
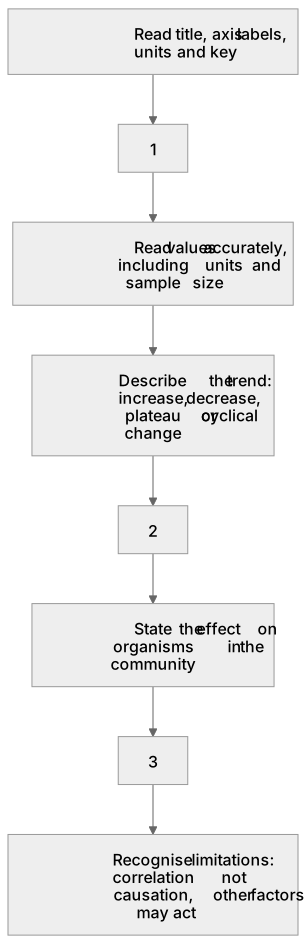
1Box 1
2Box 2
3Box 3
There is more to this lesson
The full lesson goes on to check your understanding and help you earn the marks. Create a free account to carry on, with your progress saved.
A week of Premium from your first lesson · Then the free plan continues · No card, no charge
Test your understanding of Biotic factors: Students should be able to extract and interpret information from charts, graphs and tables relating to the effect of biotic factors on organisms within a community.
Active recall beats re-reading. Take an instant quiz now to test what you’ve learned and lock it into long-term memory.
A week of Premium from your first lesson · Then the free plan continues · No card, no charge