AQA · GCSE · Combined Science
Course version: 8464 · Version from Sept 2018
Calculating rates of reactions: (HT only) calculate the gradient of a tangent to the curve on these graphs as a measure of rate of reaction at a specific time.
Rate graphs plot a quantity such as volume of gas or loss in mass against time.
- 4 key terms
Study notes
From the checked teaching notes for this specification point.
The idea
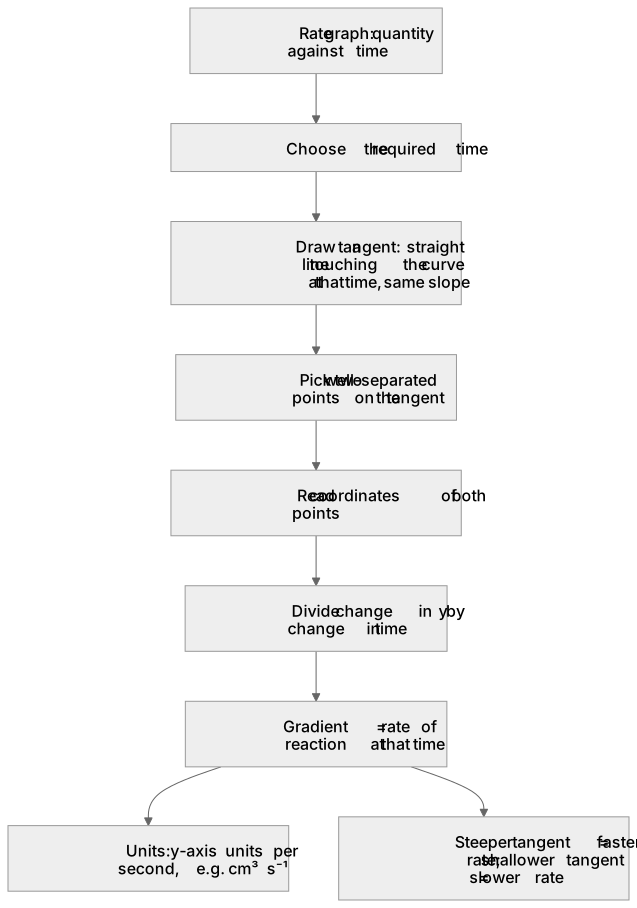
Rate graphs plot a quantity such as volume of gas or loss in mass against time. The gradient at any point equals the rate at that instant. Because the curve is not straight, you draw a tangent: a straight line touching the curve at the chosen time and matching its slope there. Pick two points far apart on the tangent, read their coordinates, then divide the change in y by the change in x. For example, if a tangent at 0 s passes through (0 s, 0 cm³) and (20 s, 40 cm³), the initial rate is 40 ÷ 20 = 2 cm³ s⁻¹. A steeper tangent means a faster reaction. Tangents can be drawn at the start (t=0) to find the initial rate. This calculation is higher-tier only.
What earns the marks
- A tangent is a straight line drawn so it touches the curve at the required time and has the same slope as the curve at that point.
- The gradient is found by choosing two well-separated points on the tangent and dividing the change in the y-axis quantity by the change in time.
- The units of the gradient are the y-axis units divided by seconds, for example cm³ s⁻¹ for gas volume against time.
- A steeper tangent indicates a faster rate at that time; a shallower tangent indicates a slower rate.
- The tangent must be drawn at the specified time, which can include the start of the reaction (t=0) to calculate the initial rate, but avoid using arbitrary start or end points.
Common mistakes and how to put them right
Drawing the tangent so it crosses the curve instead of touching it at one point.
Put it right: Redraw the line so it just touches the curve at the required time and follows the curve's direction there.
Using the whole graph's start and end points rather than the tangent.
Put it right: The gradient of a chord gives an average rate, not the rate at a specific time.
Forgetting to include units or inverting the division.
Put it right: Divide the change in the y quantity by the change in time and give units such as cm³ s⁻¹.
Exam tips
- Draw the tangent with a sharp pencil and a ruler, extending it clearly on both sides of the chosen point so two readable coordinates are available.
- Choose coordinates that lie on the tangent and are far apart, as this reduces the effect of reading error on the gradient.
Try the lesson
The start of the Calculating rates of reactions: (HT only) calculate the gradient of a tangent to the curve on these graphs as a measure of rate of reaction at a specific time. lesson, made from checked teaching notes for this specification point.
Have a go first
A student follows the volume of gas produced by a reaction. A tangent drawn at 40 s passes through (20 s, 30 cm³) and (60 s, 90 cm³). Calculate the rate of reaction at 40 s from the gradient of this tangent.
Listen
Rate graphs plot a quantity such as volume of gas or loss in mass against time. The gradient at any point equals the rate at that instant. Because the curve is not straight, you draw a tangent: a straight line touching the curve at the chosen time and matching its slope there. Pick two points far apart on the tangent, read their coordinates, then divide the change in y by the change in x. For example, if a tangent at 0 s passes through (0 s, 0 cm³) and (20 s, 40 cm³), the initial rate is 40 ÷ 20 = 2 cm³ s⁻¹. A steeper tangent means a faster reaction. Tangents can be drawn at the start (t=0) to find the initial rate. This calculation is higher-tier only. A strong answer earns marks for these points. A tangent is a straight line drawn so it touches the curve at the required time and has the same slope as the curve at that point. The gradient is found by choosing two well-separated points on the tangent and dividing the change in the y-axis quantity by the change in time. The units of the gradient are the y-axis units divided by seconds, for example cm³ s⁻¹ for gas volume against time. A steeper tangent indicates a faster rate at that time; a shallower tangent indicates a slower rate. Exam tip: Draw the tangent with a sharp pencil and a ruler, extending it clearly on both sides of the chosen point so two readable coordinates are available.
See it
Key words
Say what each word means before you turn the card.
Tangent
Try answering aloud or in your head before turning the card.
Gradient
Try answering aloud or in your head before turning the card.
Initial rate
Try answering aloud or in your head before turning the card.
Steeper tangent
Try answering aloud or in your head before turning the card.
See every definition
- Tangent
- A straight line drawn so it touches the curve at the required time and has the same slope as the curve at that point.
- Gradient
- Found by choosing two well-separated points on the tangent and dividing the change in the y-axis quantity by the change in time.
- Initial rate
- The rate at the start of the reaction, found by drawing a tangent at t=0.
- Steeper tangent
- Indicates a faster rate at that time, while a shallower tangent indicates a slower rate.
Label the diagram
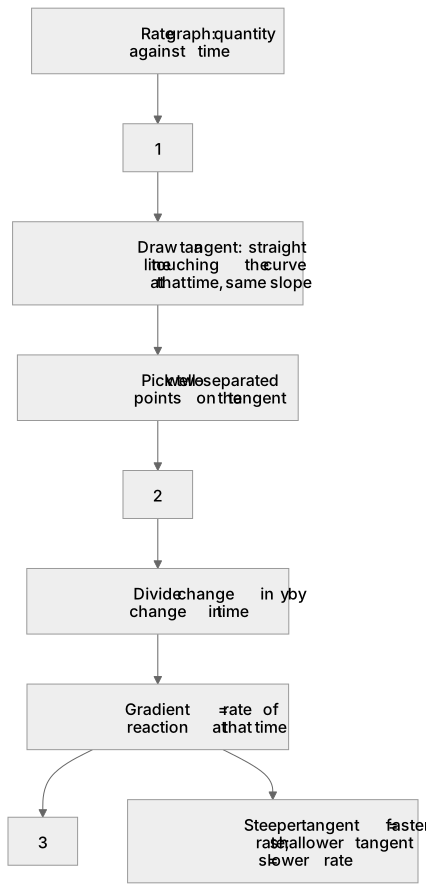
Some boxes have lost their names. Pick the right name for each number.
1Box 1
2Box 2
3Box 3
There is more to this lesson
The full lesson goes on to check your understanding and help you earn the marks. Create a free account to carry on, with your progress saved.
A week of Premium from your first lesson · Then the free plan continues · No card, no charge
Test your understanding of Calculating rates of reactions: (HT only) calculate the gradient of a tangent to the curve on these graphs as a measure of rate of reaction at a specific time.
Active recall beats re-reading. Take an instant quiz now to test what you’ve learned and lock it into long-term memory.
A week of Premium from your first lesson · Then the free plan continues · No card, no charge