AQA · GCSE · Combined Science
Course version: 8464 · Version from Sept 2018
Calculating rates of reactions: The rate of a chemical reaction can be found by measuring the quantity of a reactant used or the quantity of product formed over time:
Rate tells you how quickly a reaction proceeds.
- 3 key terms
Study notes
From the checked teaching notes for this specification point.
The idea
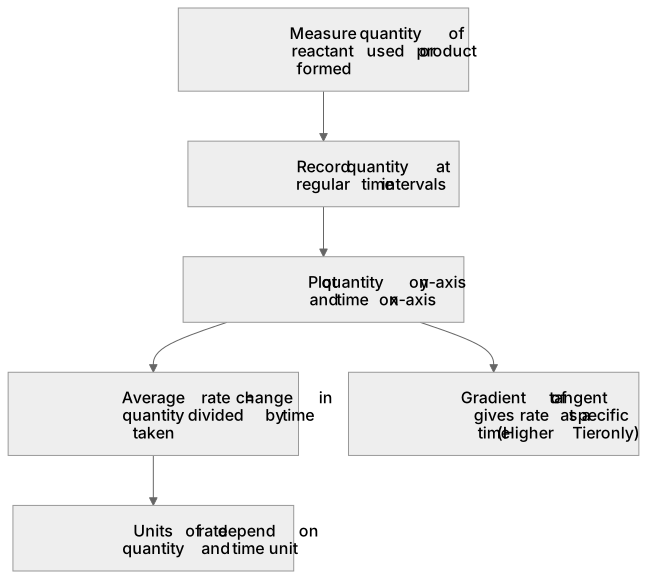
Rate tells you how quickly a reaction proceeds. Measure it by tracking a reactant disappearing or a product appearing. For example, add marble chips to dilute hydrochloric acid and measure the carbon dioxide volume in a gas syringe every 10 s. The volume increases quickly at first, then slows as acid is used up. Alternatively, measure the decreasing mass of the flask as gas escapes. Plot quantity on the y-axis and time on the x-axis. The average rate over a time interval is the change in quantity divided by the time taken. For Higher Tier only, the gradient of a tangent at any point gives the rate at that specific moment; a steeper gradient means a faster reaction. Always record quantity and time together to calculate rate.
What earns the marks
- Rate can be followed by measuring a reactant being used up, such as the loss in mass of a reaction mixture when a gas escapes.
- Rate can be followed by measuring a product formed, such as the volume of gas collected in a gas syringe or the mass of precipitate formed.
- The quantity measured must be recorded at regular time intervals so that a rate can be calculated.
- The average rate over a time interval is the change in quantity divided by the time taken for that change.
- A graph of quantity against time allows the rate at any specific time to be found from the gradient of the tangent (Higher Tier only).
- The units of rate depend on the quantity measured and the time unit, for example cm³/s for gas volume or g/s for mass loss.
Common mistakes and how to put them right
Plotting time on the y-axis and quantity on the x-axis.
Put it right: This makes the gradient the reciprocal of the rate. Always put quantity on the y-axis and time on the x-axis.
Confusing the total quantity measured with the rate.
Put it right: The total volume of gas collected is not the rate. Rate is the quantity changed per unit time, so divide by the time taken.
Assuming the rate stays constant throughout.
Put it right: Many reactions slow down as reactants are used up, so the gradient of a quantity-time graph decreases over time.
Exam tips
- When describing a method, state the quantity you will measure, the time intervals, and how you will calculate the rate from the results.
- If asked to compare rates, quote values with units and refer to the steepness of the graph.
- For a tangent (Higher Tier only), draw it at the required time, make it as long as possible, and read the coordinates from points on the tangent to calculate the gradient.
Try the lesson
The start of the Calculating rates of reactions: The rate of a chemical reaction can be found by measuring the quantity of a reactant used or the quantity of product formed over time: lesson, made from checked teaching notes for this specification point.
Have a go first
A reaction produces 20 cm³ of gas in 10 seconds. Which calculation gives the rate of this reaction in cm³/s?
Listen
Rate tells you how quickly a reaction proceeds. Measure it by tracking a reactant disappearing or a product appearing. For example, add marble chips to dilute hydrochloric acid and measure the carbon dioxide volume in a gas syringe every 10 s. The volume increases quickly at first, then slows as acid is used up. Alternatively, measure the decreasing mass of the flask as gas escapes. Plot quantity on the y-axis and time on the x-axis. The average rate over a time interval is the change in quantity divided by the time taken. For Higher Tier only, the gradient of a tangent at any point gives the rate at that specific moment; a steeper gradient means a faster reaction. Always record quantity and time together to calculate rate. A strong answer earns marks for these points. Rate can be followed by measuring a reactant being used up, such as the loss in mass of a reaction mixture when a gas escapes. Rate can be followed by measuring a product formed, such as the volume of gas collected in a gas syringe or the mass of precipitate formed. The quantity measured must be recorded at regular time intervals so that a rate can be calculated. The average rate over a time interval is the change in quantity divided by the time taken for that change. Exam tip: When describing a method, state the quantity you will measure, the time intervals, and how you will calculate the rate from the results.
See it
Key words
Say what each word means before you turn the card.
Measuring change over time
Try answering aloud or in your head before turning the card.
Reactant used or product formed
Try answering aloud or in your head before turning the card.
Graphical analysis of rate
Try answering aloud or in your head before turning the card.
See every definition
- Measuring change over time
- Recording the quantity of a reactant used or product formed at regular time intervals so that a rate can be calculated.
- Reactant used or product formed
- The quantity measured to follow a reaction, such as the loss in mass of a reaction mixture or the volume of gas collected.
- Graphical analysis of rate
- Plotting quantity on the y-axis and time on the x-axis, where the gradient of a tangent gives the rate at a specific moment.
Label the diagram
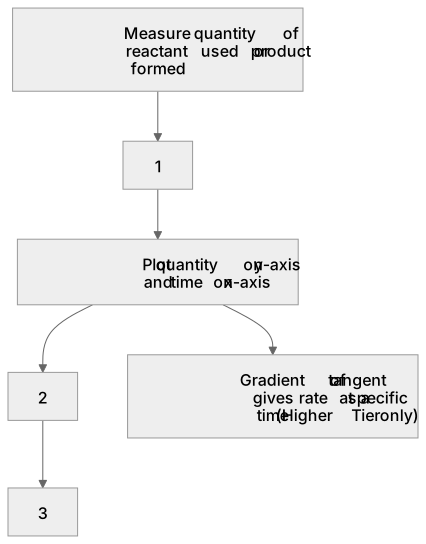
Some boxes have lost their names. Pick the right name for each number.
1Box 1
2Box 2
3Box 3
There is more to this lesson
The full lesson goes on to check your understanding and help you earn the marks. Create a free account to carry on, with your progress saved.
A week of Premium from your first lesson · Then the free plan continues · No card, no charge
Test your understanding of Calculating rates of reactions: The rate of a chemical reaction can be found by measuring the quantity of a reactant used or the quantity of product formed over time:
Active recall beats re-reading. Take an instant quiz now to test what you’ve learned and lock it into long-term memory.
A week of Premium from your first lesson · Then the free plan continues · No card, no charge