AQA · GCSE · Combined Science
Course version: 8464 · Version from Sept 2018
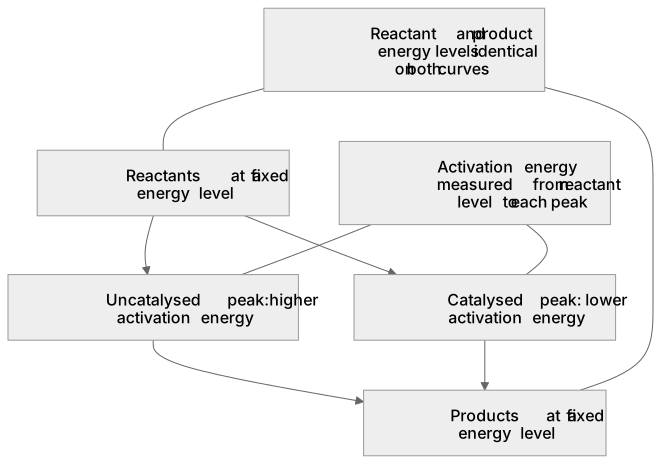
Catalysts: A reaction profile for a catalysed reaction can be drawn in the following form:
A reaction profile is a graph of energy against reaction progress.
- 4 key terms
Study notes
From the checked teaching notes for this specification point.
The idea
A reaction profile is a graph of energy against reaction progress. For an exothermic reaction, reactants start at a higher energy than products; for an endothermic reaction, products finish higher. The reactants must first reach the activation energy at the peak. A catalyst provides an alternative pathway with a lower activation energy, so the peak is lower, while the energy of reactants and products, and therefore the overall energy change, stays the same. To draw one, plot energy on the y-axis and progress on the x-axis, mark reactant and product levels, draw a curve peaking between them, then draw a second curve with a lower peak for the catalysed route. Label both activation energies from the reactant level to each peak.
What earns the marks
- Axes are labelled correctly: energy on the y-axis and reaction progress or extent of reaction on the x-axis.
- Reactant and product energy levels are marked and joined by a curve with a single maximum representing the transition state.
- The catalysed curve has a lower peak than the uncatalysed curve, showing a lower activation energy.
- The reactant and product energy levels are identical on both curves, so the overall energy change is unchanged by the catalyst.
- Activation energy is shown as the vertical difference from the reactant energy level to the peak of each curve.
- For an exothermic reaction the product level is below the reactant level; for an endothermic reaction it is above.
Common mistakes and how to put them right
Drawing the catalysed curve with lower reactant or product levels.
Put it right: Keep both levels the same and lower only the peak.
Drawing the catalysed curve with a higher peak.
Put it right: A catalyst lowers the activation energy, so the peak must be lower.
Labelling activation energy from the product level to the peak.
Put it right: Measure from the reactant energy level to the peak.
Exam tips
- Sketch both curves on the same axes so the unchanged reactant and product levels are obvious to the examiner.
- Label the axes, the two peaks and both activation energies; unlabelled curves lose clarity even when the shape is right.
- State explicitly that the catalyst lowers the activation energy by providing an alternative pathway, not that it changes the energy of reactants or products.
Try the lesson
The start of the Catalysts: A reaction profile for a catalysed reaction can be drawn in the following form: lesson, made from checked teaching notes for this specification point.
Have a go first
A student draws a reaction profile for an exothermic reaction. They then add a second curve to the same axes to show the profile for the same reaction when a catalyst is used. How does the curve for the catalysed reaction differ from the original curve?
Listen
A reaction profile is a graph of energy against reaction progress. For an exothermic reaction, reactants start at a higher energy than products; for an endothermic reaction, products finish higher. The reactants must first reach the activation energy at the peak. A catalyst provides an alternative pathway with a lower activation energy, so the peak is lower, while the energy of reactants and products, and therefore the overall energy change, stays the same. To draw one, plot energy on the y-axis and progress on the x-axis, mark reactant and product levels, draw a curve peaking between them, then draw a second curve with a lower peak for the catalysed route. Label both activation energies from the reactant level to each peak. A strong answer earns marks for these points. Axes are labelled correctly: energy on the y-axis and reaction progress or extent of reaction on the x-axis. Reactant and product energy levels are marked and joined by a curve with a single maximum representing the transition state. The catalysed curve has a lower peak than the uncatalysed curve, showing a lower activation energy. The reactant and product energy levels are identical on both curves, so the overall energy change is unchanged by the catalyst. A common slip: Drawing the catalysed curve with lower reactant or product levels: the error is changing the overall energy change. Instead, keep both levels the same and lower only the peak. Exam tip: Sketch both curves on the same axes so the unchanged reactant and product levels are obvious to the examiner.
See it
Key words
Say what each word means before you turn the card.
Activation energy
Try answering aloud or in your head before turning the card.
Catalysis and alternative reaction pathways
Try answering aloud or in your head before turning the card.
Energy changes in exothermic and endothermic reactions
Try answering aloud or in your head before turning the card.
Representing energy changes graphically
Try answering aloud or in your head before turning the card.
See every definition
- Activation energy
- The energy difference from the reactant energy level to the peak of the curve on a reaction profile.
- Catalysis and alternative reaction pathways
- A catalyst provides an alternative pathway with a lower activation energy, so the peak is lower while the overall energy change stays the same.
- Energy changes in exothermic and endothermic reactions
- For an exothermic reaction the product level is below the reactant level; for an endothermic reaction it is above.
- Representing energy changes graphically
- A reaction profile is a graph of energy against reaction progress, with energy on the y-axis and progress on the x-axis.
Label the diagram
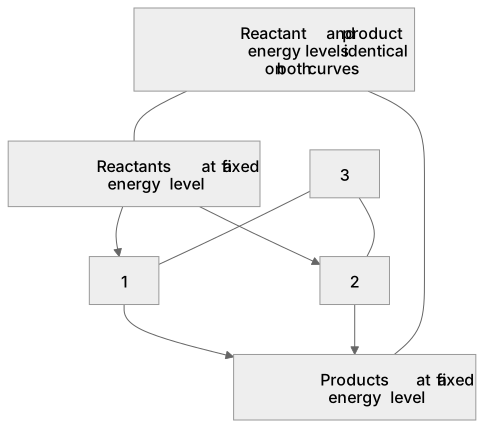
Some boxes have lost their names. Pick the right name for each number.
1Box 1
2Box 2
3Box 3
There is more to this lesson
The full lesson goes on to check your understanding and help you earn the marks. Create a free account to carry on, with your progress saved.
A week of Premium from your first lesson · Then the free plan continues · No card, no charge
Test your understanding of Catalysts: A reaction profile for a catalysed reaction can be drawn in the following form:
Active recall beats re-reading. Take an instant quiz now to test what you’ve learned and lock it into long-term memory.
A week of Premium from your first lesson · Then the free plan continues · No card, no charge