AQA · GCSE · Combined Science
Course version: 8464 · Version from Sept 2018
The human nervous system: Students should be able to translate information about reaction times between numerical and graphical forms.
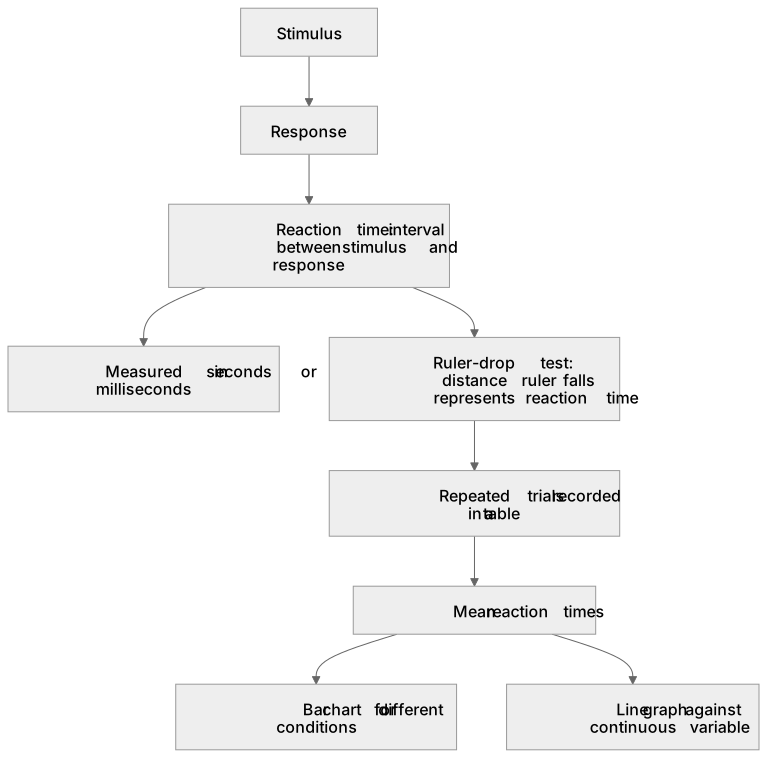
Reaction time is the interval between a stimulus and the response it triggers, measured in seconds or milliseconds.
Study notes
From the checked teaching notes for this specification point.
The idea
Reaction time is the interval between a stimulus and the response it triggers, measured in seconds or milliseconds. In a ruler-drop test, the distance a ruler falls before being caught represents the reaction time. Data from repeated trials can be recorded in a table, and mean reaction times for different conditions can be displayed on a bar chart. Alternatively, a line graph can show reaction time against a continuous variable, such as caffeine intake or time of day. Translating between forms means reading values accurately from a graph, plotting a table of means correctly, and describing the trend or comparison the graph reveals.
What earns the marks
- Identify the stimulus and the response in a described reaction-time test, stating that reaction time is measured in seconds or milliseconds.
- Read a value from a plotted graph, including interpolating between labelled gridlines and stating the unit with the answer.
- Plot a table of means accurately on axes with correct scales, labels and units.
- Describe the overall trend or compare conditions shown in graphical data.
- Explain why repeated trials and a mean are used, linking this to reducing the effect of random variation in human responses.
Common mistakes and how to put them right
Joining bar-chart tops with a line as if the categories were continuous.
Put it right: Keep separate bars for discrete conditions and reserve line graphs for continuous variables.
Reading a graph value without its unit or misreading the scale, for example treating each small square as 1 unit when it represents 0.2 s.
Put it right: Check the scale before reading.
Confusing the independent and dependent variables when plotting.
Put it right: Place the variable you change (e.g. caffeine dose) on the x-axis and reaction time on the y-axis.
Exam tips
- When describing a graph, quote at least two numerical values from it to support the trend you state.
- Check that axes are labelled with quantity and unit, and that the scale increases uniformly before plotting points.
Try the lesson
The start of the The human nervous system: Students should be able to translate information about reaction times between numerical and graphical forms. lesson, made from checked teaching notes for this specification point.
Have a go first
A student records their reaction times and plots them on a line graph. The y-axis represents reaction time in seconds. The major grid lines are marked every 0.10 s, with ten small squares between each major grid line. The point for trial 1 is plotted exactly three small squares above the 0.20 s line. What is the numerical value of the reaction time for trial 1?
Listen
Reaction time is the interval between a stimulus and the response it triggers, measured in seconds or milliseconds. In a ruler-drop test, the distance a ruler falls before being caught represents the reaction time. Data from repeated trials can be recorded in a table, and mean reaction times for different conditions can be displayed on a bar chart. Alternatively, a line graph can show reaction time against a continuous variable, such as caffeine intake or time of day. Translating between forms means reading values accurately from a graph, plotting a table of means correctly, and describing the trend or comparison the graph reveals. A strong answer earns marks for these points. Identify the stimulus and the response in a described reaction-time test, stating that reaction time is measured in seconds or milliseconds. Read a value from a plotted graph, including interpolating between labelled gridlines and stating the unit with the answer. Plot a table of means accurately on axes with correct scales, labels and units. Describe the overall trend or compare conditions shown in graphical data. A common slip: Joining bar-chart tops with a line as if the categories were continuous. Instead, keep separate bars for discrete conditions and reserve line graphs for continuous variables. Exam tip: When describing a graph, quote at least two numerical values from it to support the trend you state.
See it
Label the diagram
Some boxes have lost their names. Pick the right name for each number.
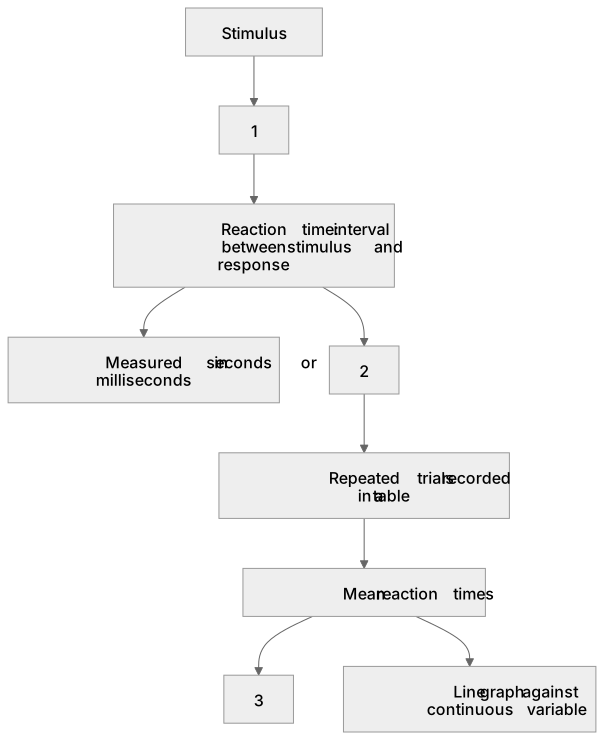
1Box 1
2Box 2
3Box 3
There is more to this lesson
The full lesson goes on to check your understanding and help you earn the marks. Create a free account to carry on, with your progress saved.
A week of Premium from your first lesson · Then the free plan continues · No card, no charge
Test your understanding of The human nervous system: Students should be able to translate information about reaction times between numerical and graphical forms.
Active recall beats re-reading. Take an instant quiz now to test what you’ve learned and lock it into long-term memory.
A week of Premium from your first lesson · Then the free plan continues · No card, no charge