Pearson Edexcel · A-Level · Economics B
Course version: 9EB0 · Version from Sept 2015
C) The use of AD/AS diagrams to illustrate demand-side policies
Full specification wording
Demand-side policies: c) The use of AD/AS diagrams to illustrate demand-side policies
Demand-side policies, including monetary and fiscal measures, manipulate aggregate demand (AD) to achieve macroeconomic objectives.
Checked against the Pearson Edexcel 9EB0 specification (opens in a new tab) on .
- Point 3 of 6
- 4 key terms
Study notes
From the checked teaching notes for this specification point.
The idea
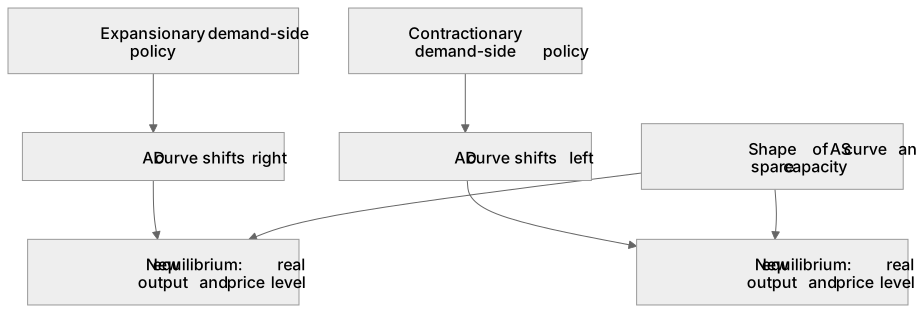
Demand-side policies, including monetary and fiscal measures, manipulate aggregate demand (AD) to achieve macroeconomic objectives. On an AD/AS diagram, an expansionary policy, such as cutting interest rates or increasing government spending, is shown by a rightward shift of the AD curve. This demonstrates an increase in real output and a rise in the general price level, indicating demand-pull inflation. Conversely, contractionary policies shift the AD curve to the left, reducing inflation but potentially lowering real GDP and increasing unemployment. The exact impact on the price level and output depends heavily on the shape of the aggregate supply (AS) curve and the economy's initial level of spare capacity.
What earns the marks
- Correctly drawing and labelling the macroeconomic axes as Price Level and Real GDP or Real Output.
- Illustrating an expansionary demand-side policy with a rightward shift of the aggregate demand curve.
- Illustrating a contractionary demand-side policy with a leftward shift of the aggregate demand curve.
- Identifying the new macroeconomic equilibrium and the resulting changes in the general price level and real output.
- Explaining how the gradient of the aggregate supply curve determines the proportional impact on prices versus output.
Common mistakes and how to put them right
Shifting the AS curve instead of the AD curve.
Put it right: Demand-side policies affect the components of AD, so only the AD curve should shift initially.
Labelling the axes as Price and Quantity.
Put it right: Macroeconomic diagrams require 'Price Level' and 'Real GDP' or 'Real Output'.
Assuming a rightward AD shift always causes high inflation.
Put it right: If the economy has significant spare capacity, output can increase without raising the price level.
Exam tips
- Always draw fully labelled initial and new equilibria to clearly show the policy's impact on both price level and output.
- Use the Keynesian AS curve to evaluate how the effectiveness of a demand-side policy depends on the current level of spare capacity.
- Explicitly link the chosen policy to a specific component of aggregate demand before shifting the curve.
Try the lesson
The start of the Demand-side policies: c) The use of AD/AS diagrams to illustrate demand-side policies lesson, made from checked teaching notes for this specification point.
Have a go first
On an AD/AS diagram, how would the successful implementation of an expansionary monetary policy be illustrated?
Listen
Demand-side policies, including monetary and fiscal measures, manipulate aggregate demand (AD) to achieve macroeconomic objectives. On an AD/AS diagram, an expansionary policy, such as cutting interest rates or increasing government spending, is shown by a rightward shift of the AD curve. This demonstrates an increase in real output and a rise in the general price level, indicating demand-pull inflation. Conversely, contractionary policies shift the AD curve to the left, reducing inflation but potentially lowering real GDP and increasing unemployment. The exact impact on the price level and output depends heavily on the shape of the aggregate supply (AS) curve and the economy's initial level of spare capacity. A strong answer earns marks for these points. Correctly drawing and labelling the macroeconomic axes as Price Level and Real GDP or Real Output. Illustrating an expansionary demand-side policy with a rightward shift of the aggregate demand curve. Illustrating a contractionary demand-side policy with a leftward shift of the aggregate demand curve. Identifying the new macroeconomic equilibrium and the resulting changes in the general price level and real output. A common slip: Shifting the AS curve instead of the AD curve. Instead, demand-side policies affect the components of AD, so only the AD curve should shift initially. Exam tip: Always draw fully labelled initial and new equilibria to clearly show the policy's impact on both price level and output.
See it
Key words
Say what each word means before you turn the card.
Aggregate demand
Try answering aloud or in your head before turning the card.
Fiscal policy
Try answering aloud or in your head before turning the card.
Monetary policy
Try answering aloud or in your head before turning the card.
Macroeconomic equilibrium
Try answering aloud or in your head before turning the card.
See every definition
- Aggregate demand
- The total demand in the economy that demand-side policies, including monetary and fiscal measures, manipulate to achieve macroeconomic objectives.
- Fiscal policy
- A demand-side measure that can be expansionary, such as increasing government spending, or contractionary.
- Monetary policy
- A demand-side measure that can be expansionary, such as cutting interest rates, or contractionary.
- Macroeconomic equilibrium
- The point identified on an AD/AS diagram where the new equilibrium shows the resulting changes in the general price level and real output.
There is more to this lesson
The full lesson goes on to check your understanding and help you earn the marks. Create a free account to carry on, with your progress saved.
A week of Premium from your first lesson · Then the free plan continues · No card, no charge
Test your understanding of Demand-side policies: c) The use of AD/AS diagrams to illustrate demand-side policies
Active recall beats re-reading. Take an instant quiz now to test what you’ve learned and lock it into long-term memory.
A week of Premium from your first lesson · Then the free plan continues · No card, no charge