Pearson Edexcel · A-Level · Economics B
Course version: 9EB0 · Version from Sept 2015
Impact on costs and sales revenue: a) Impact on average costs
Full specification wording
Impact on costs and sales revenue: a) Impact on average costs
Average costs (total cost divided by output) are heavily influenced by operational decisions like capacity utilisation and lean production.
Checked against the Pearson Edexcel 9EB0 specification (opens in a new tab) on .
- Point 1 of 3
- 2 key terms
Study notes
From the checked teaching notes for this specification point.
The idea
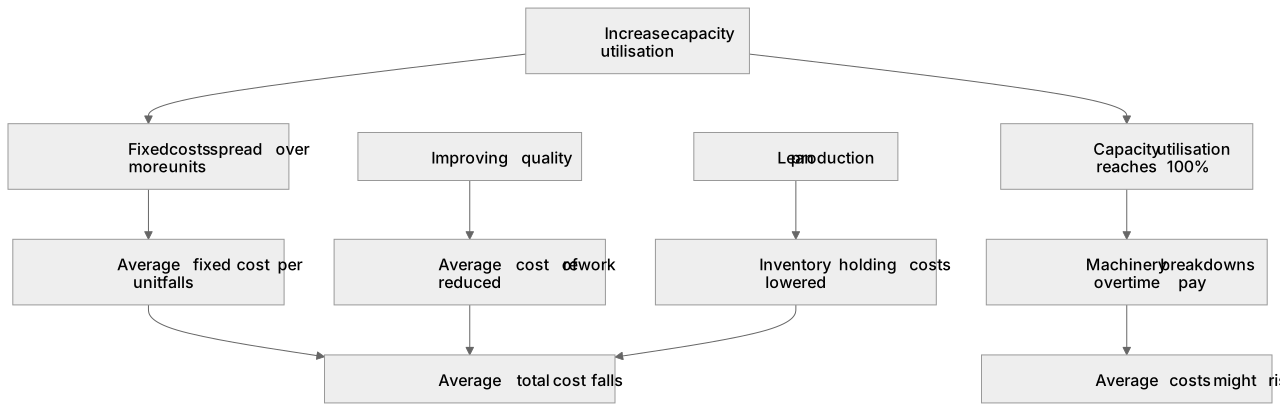
Average costs (total cost divided by output) are heavily influenced by operational decisions like capacity utilisation and lean production. When a business increases its capacity utilisation, it spreads fixed costs over a larger number of units, reducing the average fixed cost per unit and lowering the average total cost. For example, a factory producing 10,000 units with £50,000 fixed costs has an average fixed cost of £5. If output rises to 25,000 units, this falls to £2. However, if capacity utilisation reaches 100%, average costs might rise due to machinery breakdowns or overtime pay. Similarly, improving quality reduces the average cost of rework, while lean production lowers inventory holding costs.
What earns the marks
- Define average cost as total cost divided by the quantity of output produced.
- Explain that increasing capacity utilisation spreads fixed costs over more units, reducing average fixed costs.
- Identify that operating at maximum capacity can lead to diseconomies or increased average variable costs due to overtime or maintenance issues.
- Analyse how operational improvements like lean production reduce average costs by minimising inventory and waste.
Common mistakes and how to put them right
Confusing total costs with average costs.
Put it right: Total costs may rise as output increases, but average costs can fall if fixed costs are spread over more units.
Assuming average variable costs always remain constant.
Put it right: Average variable costs can change due to factors like bulk buying discounts or overtime wages.
Believing that 100% capacity utilisation always minimises average costs.
Put it right: Operating at full capacity can increase average costs due to stress on machines and staff.
Exam tips
- Always state the formula for average costs when explaining how operational changes affect unit costs.
- Use a numerical example in your written answers to demonstrate how spreading fixed costs lowers average costs.
- Link the concept of average costs to competitiveness, showing how lower unit costs allow a firm to reduce prices or increase profit margins.
Try the lesson
The start of the Impact on costs and sales revenue: a) Impact on average costs lesson, made from checked teaching notes for this specification point.
Have a go first
Which of the following scenarios would most likely lead to a decrease in a firm's average costs in the short run?
Listen
Average costs (total cost divided by output) are heavily influenced by operational decisions like capacity utilisation and lean production. When a business increases its capacity utilisation, it spreads fixed costs over a larger number of units, reducing the average fixed cost per unit and lowering the average total cost. For example, a factory producing 10,000 units with £50,000 fixed costs has an average fixed cost of £5. If output rises to 25,000 units, this falls to £2. However, if capacity utilisation reaches 100%, average costs might rise due to machinery breakdowns or overtime pay. Similarly, improving quality reduces the average cost of rework, while lean production lowers inventory holding costs. A strong answer earns marks for these points. Define average cost as total cost divided by the quantity of output produced. Explain that increasing capacity utilisation spreads fixed costs over more units, reducing average fixed costs. Identify that operating at maximum capacity can lead to diseconomies or increased average variable costs due to overtime or maintenance issues. Analyse how operational improvements like lean production reduce average costs by minimising inventory and waste. A common slip: Confusing total costs with average costs. Instead, total costs may rise as output increases, but average costs can fall if fixed costs are spread over more units. Exam tip: Always state the formula for average costs when explaining how operational changes affect unit costs.
See it
Key words
Say what each word means before you turn the card.
Average costs
Try answering aloud or in your head before turning the card.
Lean production
Try answering aloud or in your head before turning the card.
See every definition
- Average costs
- Total cost divided by output, influenced by operational decisions like capacity utilisation and lean production.
- Lean production
- An operational improvement that lowers average costs by minimising inventory and waste.
Label the diagram
Some boxes have lost their names. Pick the right name for each number.

1Box 1
2Box 2
3Box 3
There is more to this lesson
The full lesson goes on to check your understanding and help you earn the marks. Create a free account to carry on, with your progress saved.
A week of Premium from your first lesson · Then the free plan continues · No card, no charge
Test your understanding of Impact on costs and sales revenue: a) Impact on average costs
Active recall beats re-reading. Take an instant quiz now to test what you’ve learned and lock it into long-term memory.
A week of Premium from your first lesson · Then the free plan continues · No card, no charge