Pearson Edexcel · A-Level · Economics B
Course version: 9EB0 · Version from Sept 2015
D) The use of the supply and demand model to show how shifts in demand and…
Full specification wording
Price determination: d) The use of the supply and demand model to show how shifts in demand and supply curves cause the equilibrium price and quantity to change in real-world situations
The supply and demand model is a fundamental tool used to analyse how real-world events impact market equilibrium.
Checked against the Pearson Edexcel 9EB0 specification (opens in a new tab) on .
- Point 4 of 5
- 3 key terms
Study notes
From the checked teaching notes for this specification point.
The idea
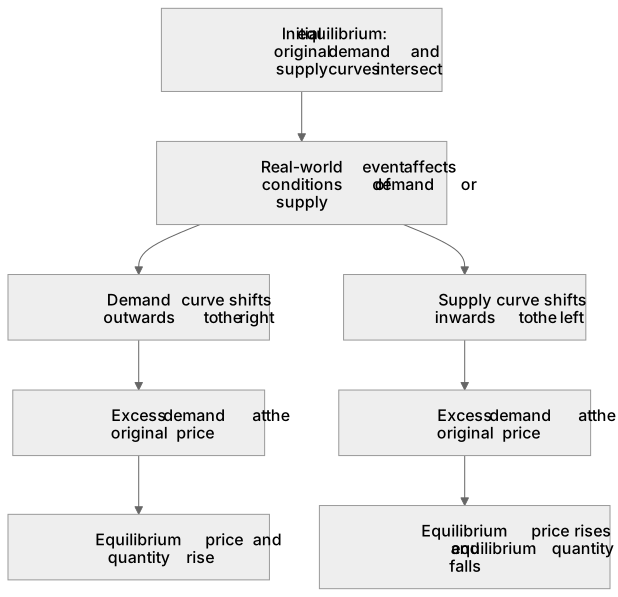
The supply and demand model is a fundamental tool used to analyse how real-world events impact market equilibrium. When external factors change, such as a successful marketing campaign increasing consumer preference, the demand curve shifts outwards to the right. This creates excess demand at the original price, pushing the equilibrium price and quantity upwards. Conversely, if a natural disaster destroys crops, the supply curve shifts inwards to the left, creating excess demand that drives prices up but reduces the equilibrium quantity. By mapping these shifts, economists can predict the precise directional changes in price and quantity, providing valuable insights for businesses and policymakers navigating dynamic real-world situations.
What earns the marks
- Identify the initial equilibrium price and quantity where the original supply and demand curves intersect.
- Determine whether a real-world event affects the conditions of demand or the conditions of supply.
- Illustrate an outward or inward shift of the relevant curve accurately on a fully labelled market diagram.
- Explain the mechanism of price adjustment, such as how excess demand or excess supply leads to a new equilibrium.
- State the final impact on both the equilibrium price and the equilibrium quantity.
Common mistakes and how to put them right
Confusing a movement along a curve with a shift of the curve.
Put it right: Only changes in non-price determinants cause a shift, whereas a change in price causes a movement along the curve.
Shifting the wrong curve in response to a scenario.
Put it right: Carefully analyse whether the event directly impacts consumer willingness to buy (demand) or producer ability to sell (supply).
Failing to label the new equilibrium price and quantity on diagrams.
Put it right: Draw dashed lines to the axes and label the new coordinates to clearly show the change.
Exam tips
- Always draw a diagram to support your analysis of market changes, even if the question does not explicitly demand one.
- Clearly distinguish between the initial and final equilibrium points using clear, sequential labelling.
- Use step-by-step logical chains of reasoning to explain how the market moves from the old equilibrium to the new one.
Try the lesson
The start of the Price determination: d) The use of the supply and demand model to show how shifts in demand and supply curves cause the equilibrium price and quantity to change in real-world situations lesson, made from checked teaching notes for this specification point.
Have a go first
A successful national advertising campaign promotes the health benefits of drinking green tea. Assuming ceteris paribus, what is the expected impact on the equilibrium price and quantity of green tea?
Listen
The supply and demand model is a fundamental tool used to analyse how real-world events impact market equilibrium. When external factors change, such as a successful marketing campaign increasing consumer preference, the demand curve shifts outwards to the right. This creates excess demand at the original price, pushing the equilibrium price and quantity upwards. Conversely, if a natural disaster destroys crops, the supply curve shifts inwards to the left, creating excess demand that drives prices up but reduces the equilibrium quantity. By mapping these shifts, economists can predict the precise directional changes in price and quantity, providing valuable insights for businesses and policymakers navigating dynamic real-world situations. A strong answer earns marks for these points. Identify the initial equilibrium price and quantity where the original supply and demand curves intersect. Determine whether a real-world event affects the conditions of demand or the conditions of supply. Illustrate an outward or inward shift of the relevant curve accurately on a fully labelled market diagram. Explain the mechanism of price adjustment, such as how excess demand or excess supply leads to a new equilibrium. A common slip: Confusing a movement along a curve with a shift of the curve. Instead, only changes in non-price determinants cause a shift, whereas a change in price causes a movement along the curve. Exam tip: Always draw a diagram to support your analysis of market changes, even if the question does not explicitly demand one.
See it
Key words
Say what each word means before you turn the card.
Market equilibrium
Try answering aloud or in your head before turning the card.
Price mechanism
Try answering aloud or in your head before turning the card.
Non-price determinants
Try answering aloud or in your head before turning the card.
See every definition
- Market equilibrium
- The point where the original supply and demand curves intersect, giving the initial equilibrium price and quantity.
- Price mechanism
- The mechanism of price adjustment, such as how excess demand or excess supply leads to a new equilibrium.
- Non-price determinants
- Factors other than price; only changes in these cause a shift of the curve, whereas a change in price causes a movement along the curve.
There is more to this lesson
The full lesson goes on to check your understanding and help you earn the marks. Create a free account to carry on, with your progress saved.
A week of Premium from your first lesson · Then the free plan continues · No card, no charge
Test your understanding of Price determination: d) The use of the supply and demand model to show how shifts in demand and supply curves cause the equilibrium price and quantity to change in real-world situations
Active recall beats re-reading. Take an instant quiz now to test what you’ve learned and lock it into long-term memory.
A week of Premium from your first lesson · Then the free plan continues · No card, no charge