Pearson Edexcel · A-Level · Economics B
Course version: 9EB0 · Version from Sept 2015
C) The use of AD/AS diagrams to illustrate supply-side policies
Full specification wording
Supply-side policies: c) The use of AD/AS diagrams to illustrate supply-side policies
Supply-side policies aim to increase the productive potential of an economy, shifting the long-run aggregate supply (LRAS) curve to the right.
Checked against the Pearson Edexcel 9EB0 specification (opens in a new tab) on .
- Point 3 of 3
- 3 key terms
Study notes
From the checked teaching notes for this specification point.
The idea
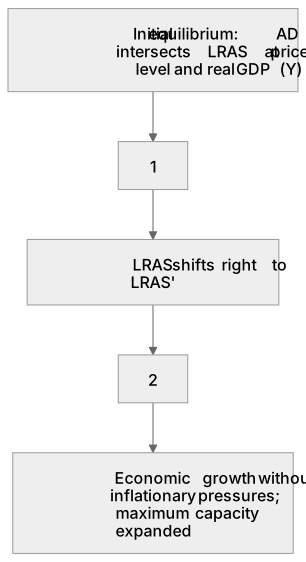
Supply-side policies aim to increase the productive potential of an economy, shifting the long-run aggregate supply (LRAS) curve to the right. To illustrate this using an AD/AS diagram, draw the initial macroeconomic equilibrium where aggregate demand (AD) intersects the initial LRAS curve at a specific price level and real GDP (Y). A successful supply-side policy, such as increased investment in education, shifts the LRAS curve to the right (from LRAS to LRAS'). This creates a new equilibrium with a lower average price level and a higher level of real GDP (Y'). This diagrammatic analysis demonstrates how supply-side improvements can achieve economic growth without generating inflationary pressures, expanding the economy's maximum capacity.
What earns the marks
- A rightward shift of the LRAS curve represents an increase in the economy's productive capacity.
- The new macroeconomic equilibrium occurs at a higher level of real GDP and a lower average price level, assuming ceteris paribus.
- The AD curve remains unchanged unless the policy also has short-term demand-side effects, such as government spending on infrastructure.
- The vertical classical LRAS curve shifts to the right, indicating an increase in the full employment level of output.
Common mistakes and how to put them right
Shifting the AD curve instead of the LRAS curve.
Put it right by ensuring supply-side policies are shown to affect productive capacity (LRAS).
Shifting the LRAS curve to the left.
Put it right by shifting LRAS to the right to show an increase in productive potential.
Failing to label the new equilibrium points on the axes.
Put it right: Clearly marking the initial and new price levels and real GDP.
Exam tips
- Always draw and label the initial and new equilibrium points on the axes to clearly show the impact on price level and real GDP.
- Use a classical LRAS curve (vertical) to clearly demonstrate the increase in the full employment level of output.
- Ensure the arrows on the diagram clearly indicate the direction of the shift from the original LRAS to the new LRAS.
Try the lesson
The start of the Supply-side policies: c) The use of AD/AS diagrams to illustrate supply-side policies lesson, made from checked teaching notes for this specification point.
Have a go first
When illustrating a successful supply-side policy on a macroeconomic diagram, which curve shifts and in which direction?
Listen
Supply-side policies aim to increase the productive potential of an economy, shifting the long-run aggregate supply (LRAS) curve to the right. To illustrate this using an AD/AS diagram, draw the initial macroeconomic equilibrium where aggregate demand (AD) intersects the initial LRAS curve at a specific price level and real GDP (Y). A successful supply-side policy, such as increased investment in education, shifts the LRAS curve to the right (from LRAS to LRAS'). This creates a new equilibrium with a lower average price level and a higher level of real GDP (Y'). This diagrammatic analysis demonstrates how supply-side improvements can achieve economic growth without generating inflationary pressures, expanding the economy's maximum capacity. A strong answer earns marks for these points. A rightward shift of the LRAS curve represents an increase in the economy's productive capacity. The new macroeconomic equilibrium occurs at a higher level of real GDP and a lower average price level, assuming ceteris paribus. The AD curve remains unchanged unless the policy also has short-term demand-side effects, such as government spending on infrastructure. The vertical classical LRAS curve shifts to the right, indicating an increase in the full employment level of output. A common slip: Shifting the AD curve instead of the LRAS curve. Instead, ensuring supply-side policies are shown to affect productive capacity (LRAS). Exam tip: Always draw and label the initial and new equilibrium points on the axes to clearly show the impact on price level and real GDP.
See it

Put it in order
Put these steps in the order they happen.
- 1. Successful supply-side policy, e.g. increased investment in education
- 2. LRAS shifts right to LRAS'
- 3. Initial equilibrium: AD intersects LRAS at price level and real GDP (Y)
- 4. Economic growth without inflationary pressures; maximum capacity expanded
- 5. New equilibrium: lower average price level and higher real GDP (Y')
Key words
Say what each word means before you turn the card.
Macroeconomic equilibrium
Try answering aloud or in your head before turning the card.
Productive capacity
Try answering aloud or in your head before turning the card.
Economic growth
Try answering aloud or in your head before turning the card.
See every definition
- Macroeconomic equilibrium
- The point where aggregate demand intersects the long-run aggregate supply curve at a specific price level and real GDP.
- Productive capacity
- The economy's maximum capacity, which increases when the LRAS curve shifts to the right.
- Economic growth
- A higher level of real GDP, which supply-side improvements can achieve without generating inflationary pressures.
Label the diagram
Some boxes have lost their names. Pick the right name for each number.
1Box 1
2Box 2
There is more to this lesson
The full lesson goes on to check your understanding and help you earn the marks. Create a free account to carry on, with your progress saved.
A week of Premium from your first lesson · Then the free plan continues · No card, no charge
Test your understanding of Supply-side policies: c) The use of AD/AS diagrams to illustrate supply-side policies
Active recall beats re-reading. Take an instant quiz now to test what you’ve learned and lock it into long-term memory.
A week of Premium from your first lesson · Then the free plan continues · No card, no charge