Study Notes
Overview
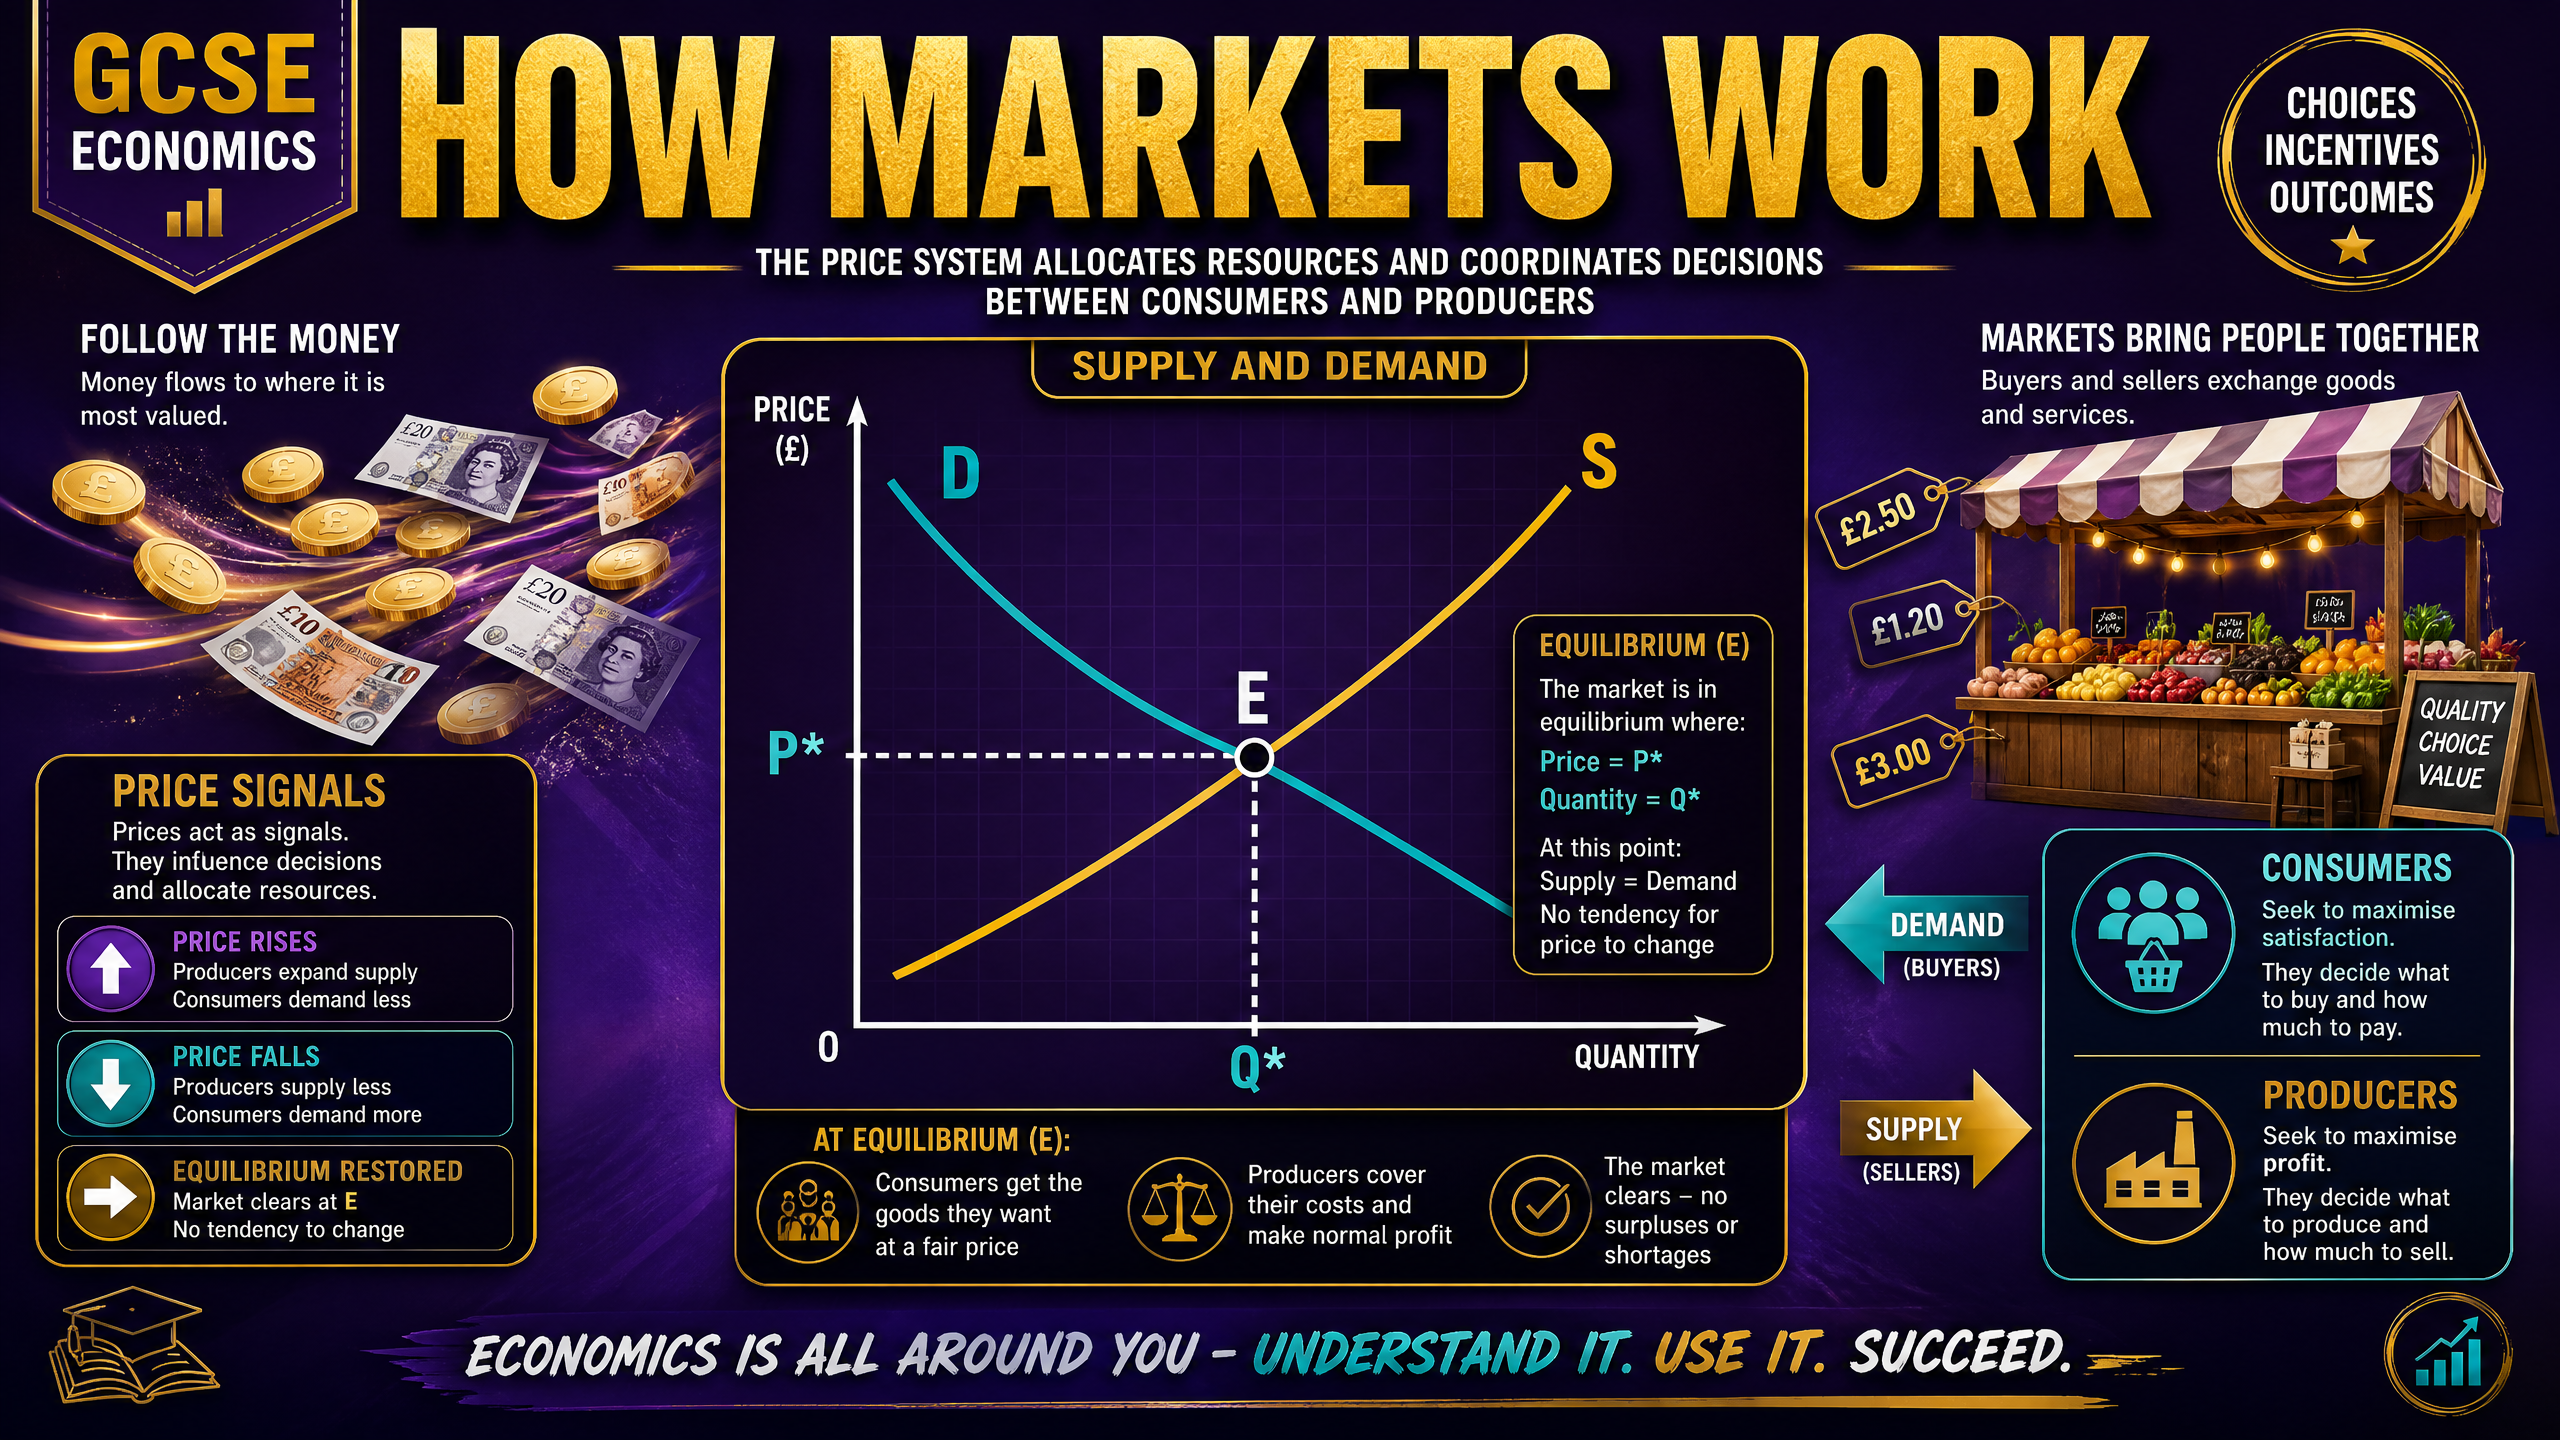
This study guide explores the microeconomic foundations of how markets function, focusing on the interaction of supply and demand to allocate resources. It covers rational decision-making, the mechanics of demand and supply, price determination, elasticities, consumer and producer surplus, the impact of indirect taxes and subsidies, and alternative theories of consumer behaviour. Examiners expect candidates to demonstrate a precise understanding of these concepts, distinguishing clearly between movements along curves and shifts of curves, and applying these theories to real-world scenarios.
The Mechanics of Demand and Supply
Demand
Definition: The quantity of a good or service that consumers are willing and able to buy at a given price in a given time period.
Key Concept: The law of demand states that there is an inverse relationship between price and quantity demanded. As price falls, quantity demanded rises, assuming ceteris paribus (all other things being equal).
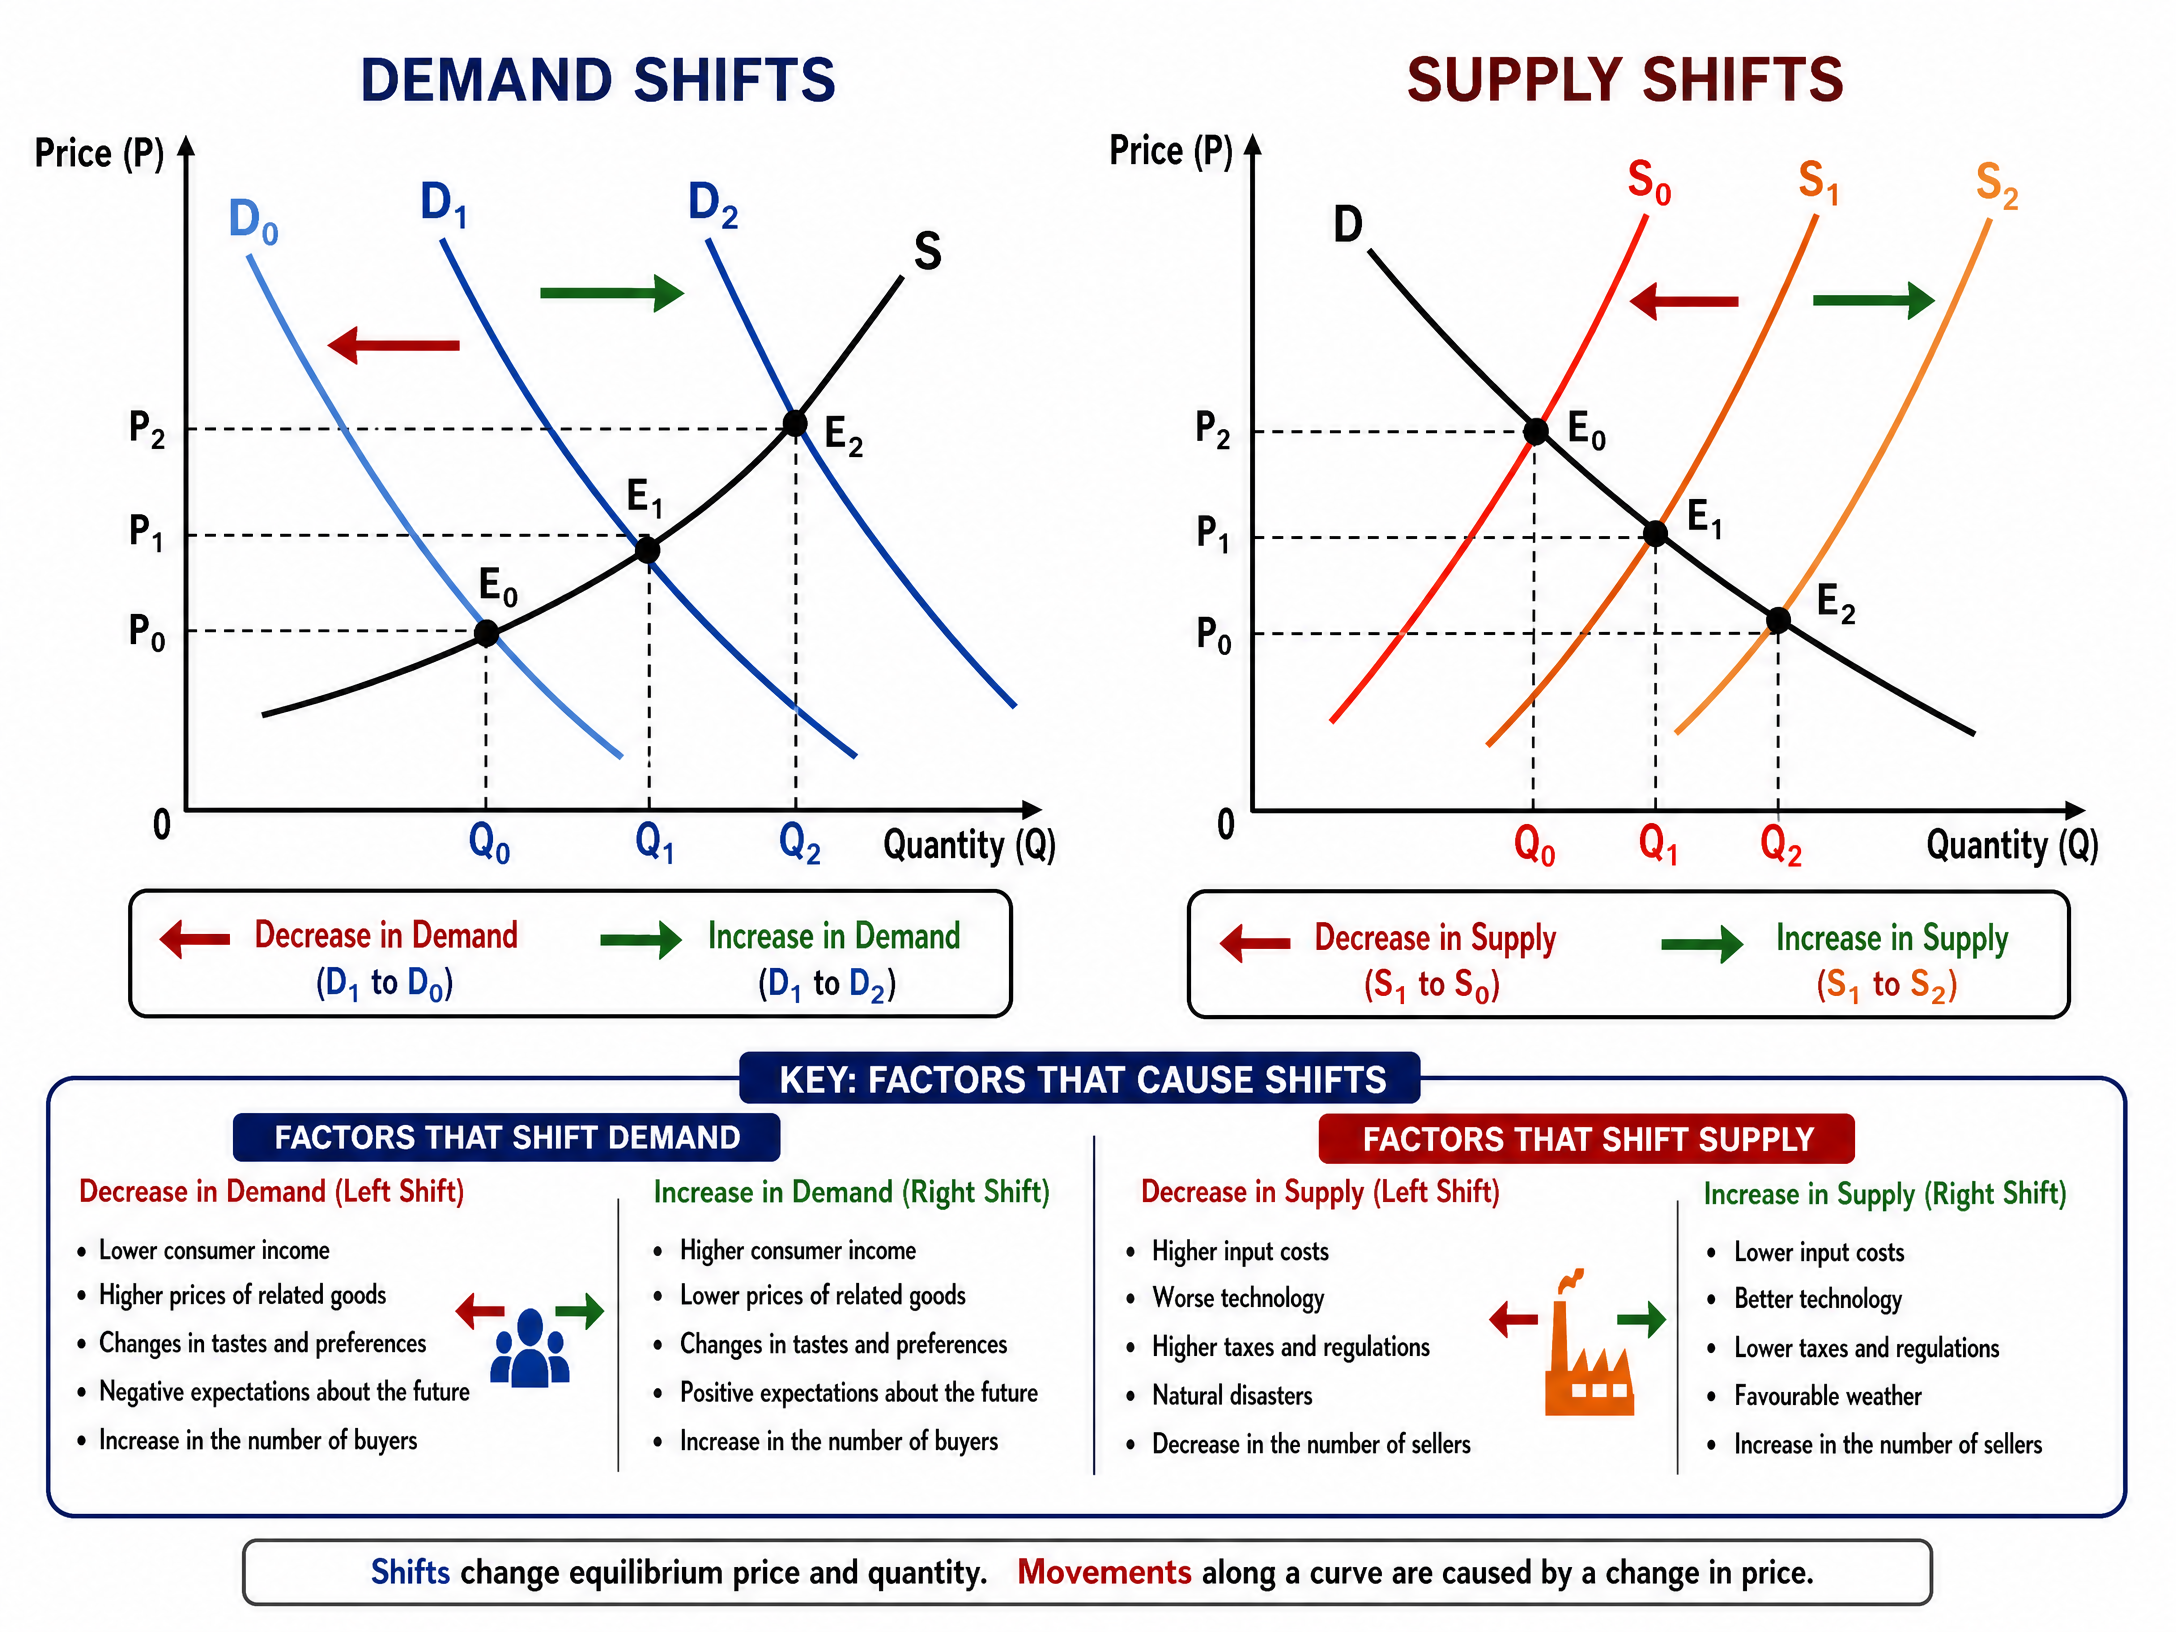
Exam Focus: Candidates must distinguish between a movement along the demand curve (caused only by a change in the good's own price) and a shift of the demand curve (caused by changes in conditions of demand such as income, prices of related goods, tastes, and population).
Supply
Definition: The quantity of a good or service that producers are willing and able to supply at a given price in a given time period.
Key Concept: The law of supply states that there is a positive relationship between price and quantity supplied. As price rises, it becomes more profitable for firms to produce, so quantity supplied increases.
Exam Focus: Similar to demand, a change in price causes a movement along the supply curve. A change in the conditions of supply (such as costs of production, technology, taxes, subsidies, or weather) causes a shift of the entire curve.
Price Determination and The Price Mechanism
Market Equilibrium
Definition: The state where quantity demanded equals quantity supplied, resulting in no excess demand or excess supply. The market clears at the equilibrium price ($P^) and equilibrium quantity (Q^$).
Market Forces:
- Excess Supply (Surplus): If price is above equilibrium, producers supply more than consumers demand. To clear unsold stock, producers lower prices, which increases quantity demanded and reduces quantity supplied until equilibrium is restored.
- Excess Demand (Shortage): If price is below equilibrium, consumers demand more than producers supply. Consumers bid up the price, which encourages producers to supply more and reduces quantity demanded until equilibrium is restored.
Functions of the Price Mechanism
The price mechanism allocates resources automatically through three key functions:
- Signalling: Price changes provide information to buyers and sellers about changing market conditions.
- Incentive: Higher prices incentivise producers to supply more to maximise profit.
- Rationing: When resources are scarce, prices rise, rationing the good to those willing and able to pay the most.
Elasticities
Elasticity measures the responsiveness of one variable to a change in another.
Price Elasticity of Demand (PED)
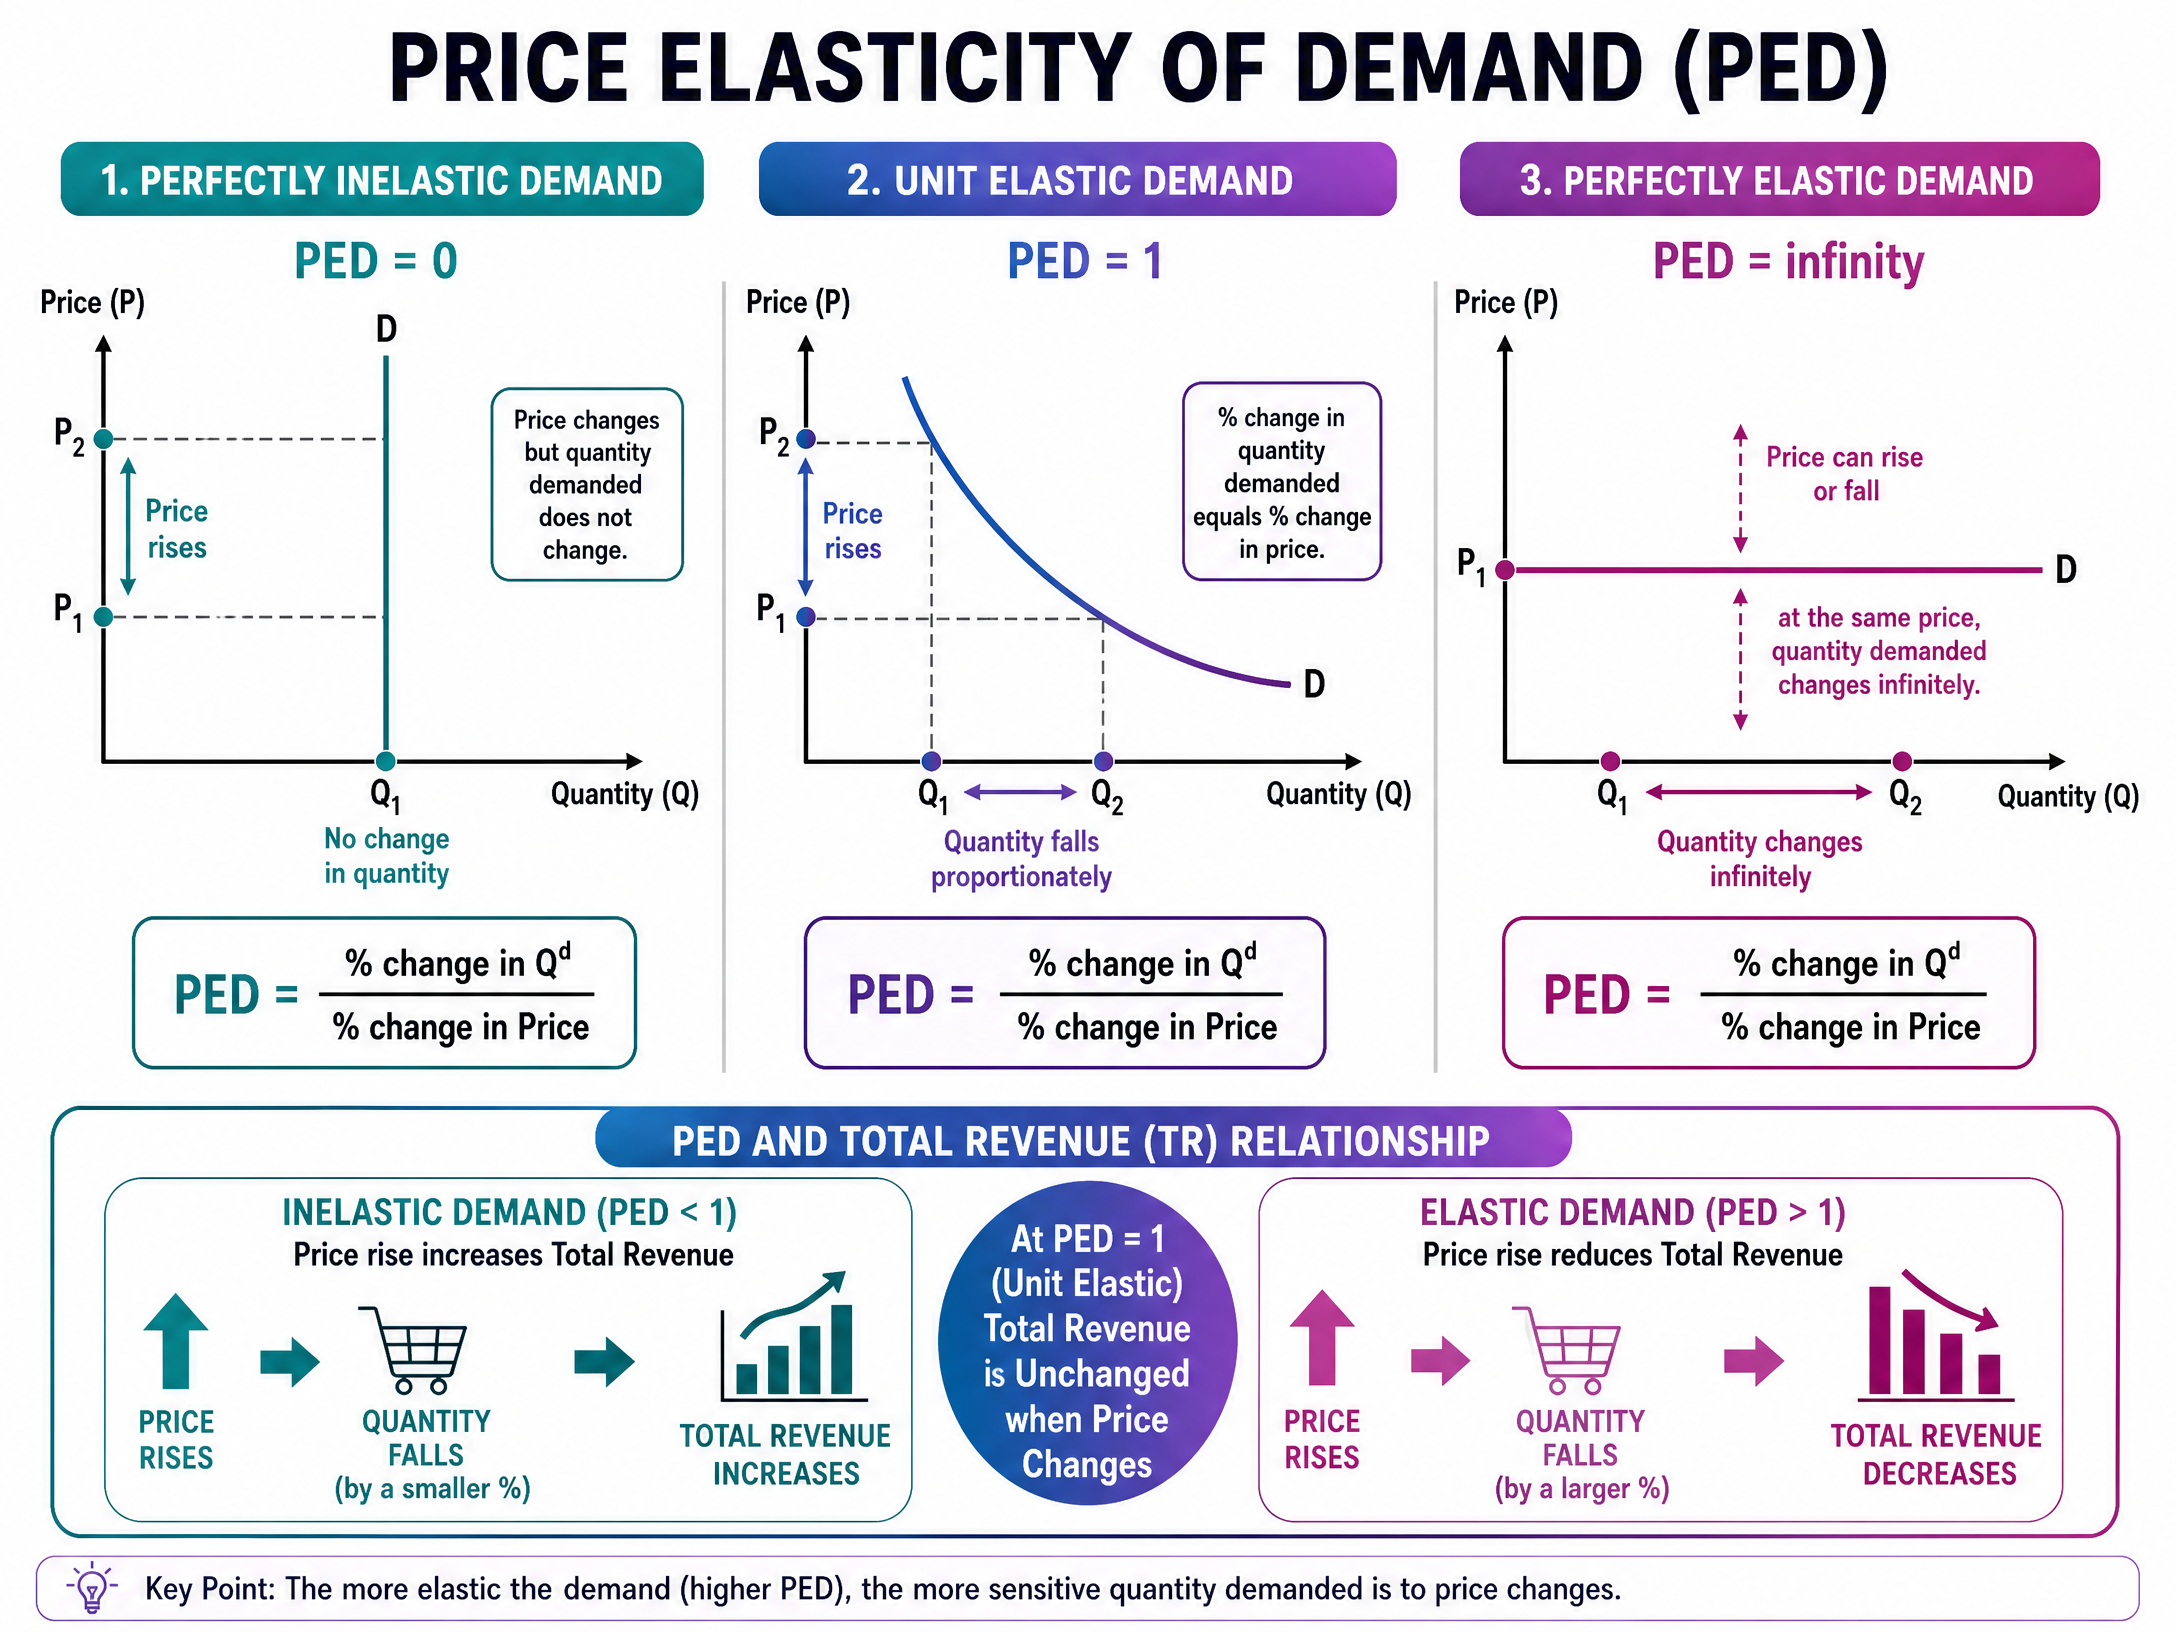
Formula: % \Delta Q_d / % \Delta P
Significance: Measures how sensitive quantity demanded is to a change in price.
- Elastic ($|PED| > 1$): Demand is highly responsive to price changes. (e.g., luxury goods, goods with many substitutes).
- Inelastic ($|PED| < 1$): Demand is relatively unresponsive to price changes. (e.g., necessities, addictive goods).
Total Revenue Relationship: Examiners frequently test this. If demand is inelastic, raising the price increases total revenue. If demand is elastic, raising the price decreases total revenue.
Other Elasticities
- Income Elasticity of Demand (YED): Measures responsiveness of demand to a change in income. Normal goods have a positive YED; inferior goods have a negative YED.
- Cross Elasticity of Demand (XED): Measures responsiveness of demand for Good A to a change in the price of Good B. Substitutes have a positive XED; complements have a negative XED.
- Price Elasticity of Supply (PES): Measures responsiveness of quantity supplied to a change in price. Always positive. Depends on spare capacity, time, and factor mobility.
Market Interventions and Welfare
Consumer and Producer Surplus
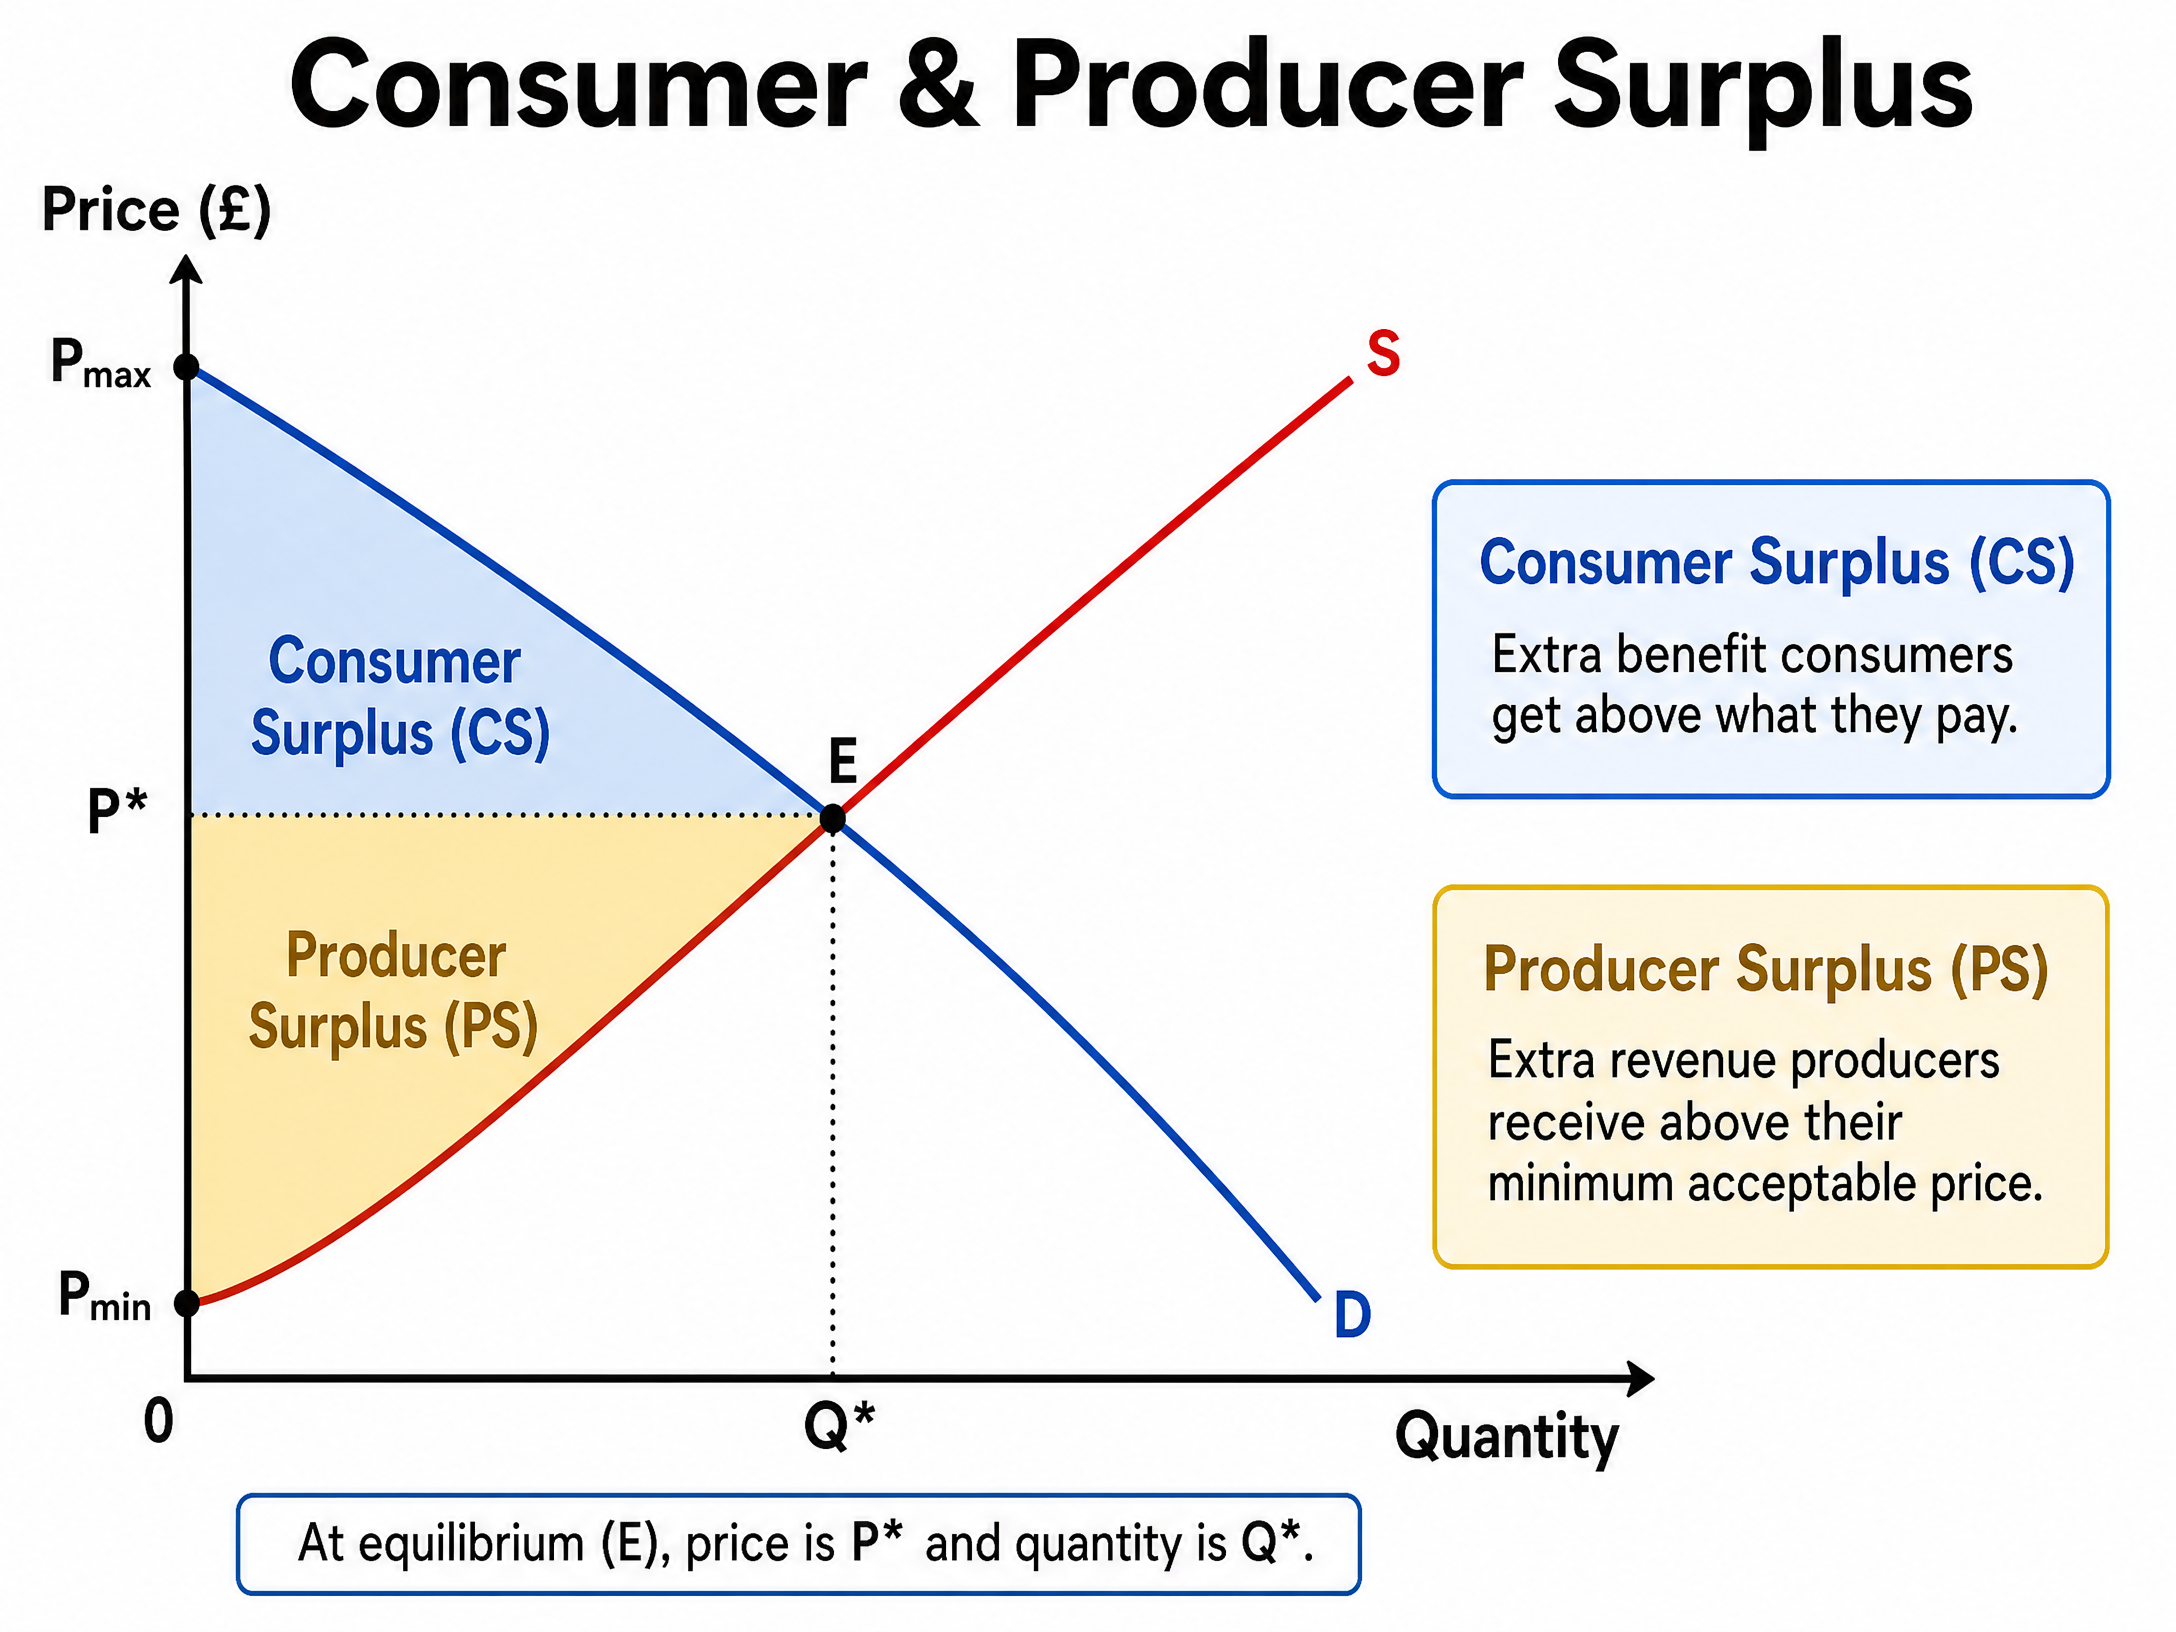
- Consumer Surplus: The difference between the maximum price consumers are willing to pay and the price they actually pay. It is the area below the demand curve and above the equilibrium price.
- Producer Surplus: The difference between the price producers receive and the minimum price they are willing to accept. It is the area above the supply curve and below the equilibrium price.
Indirect Taxes and Subsidies
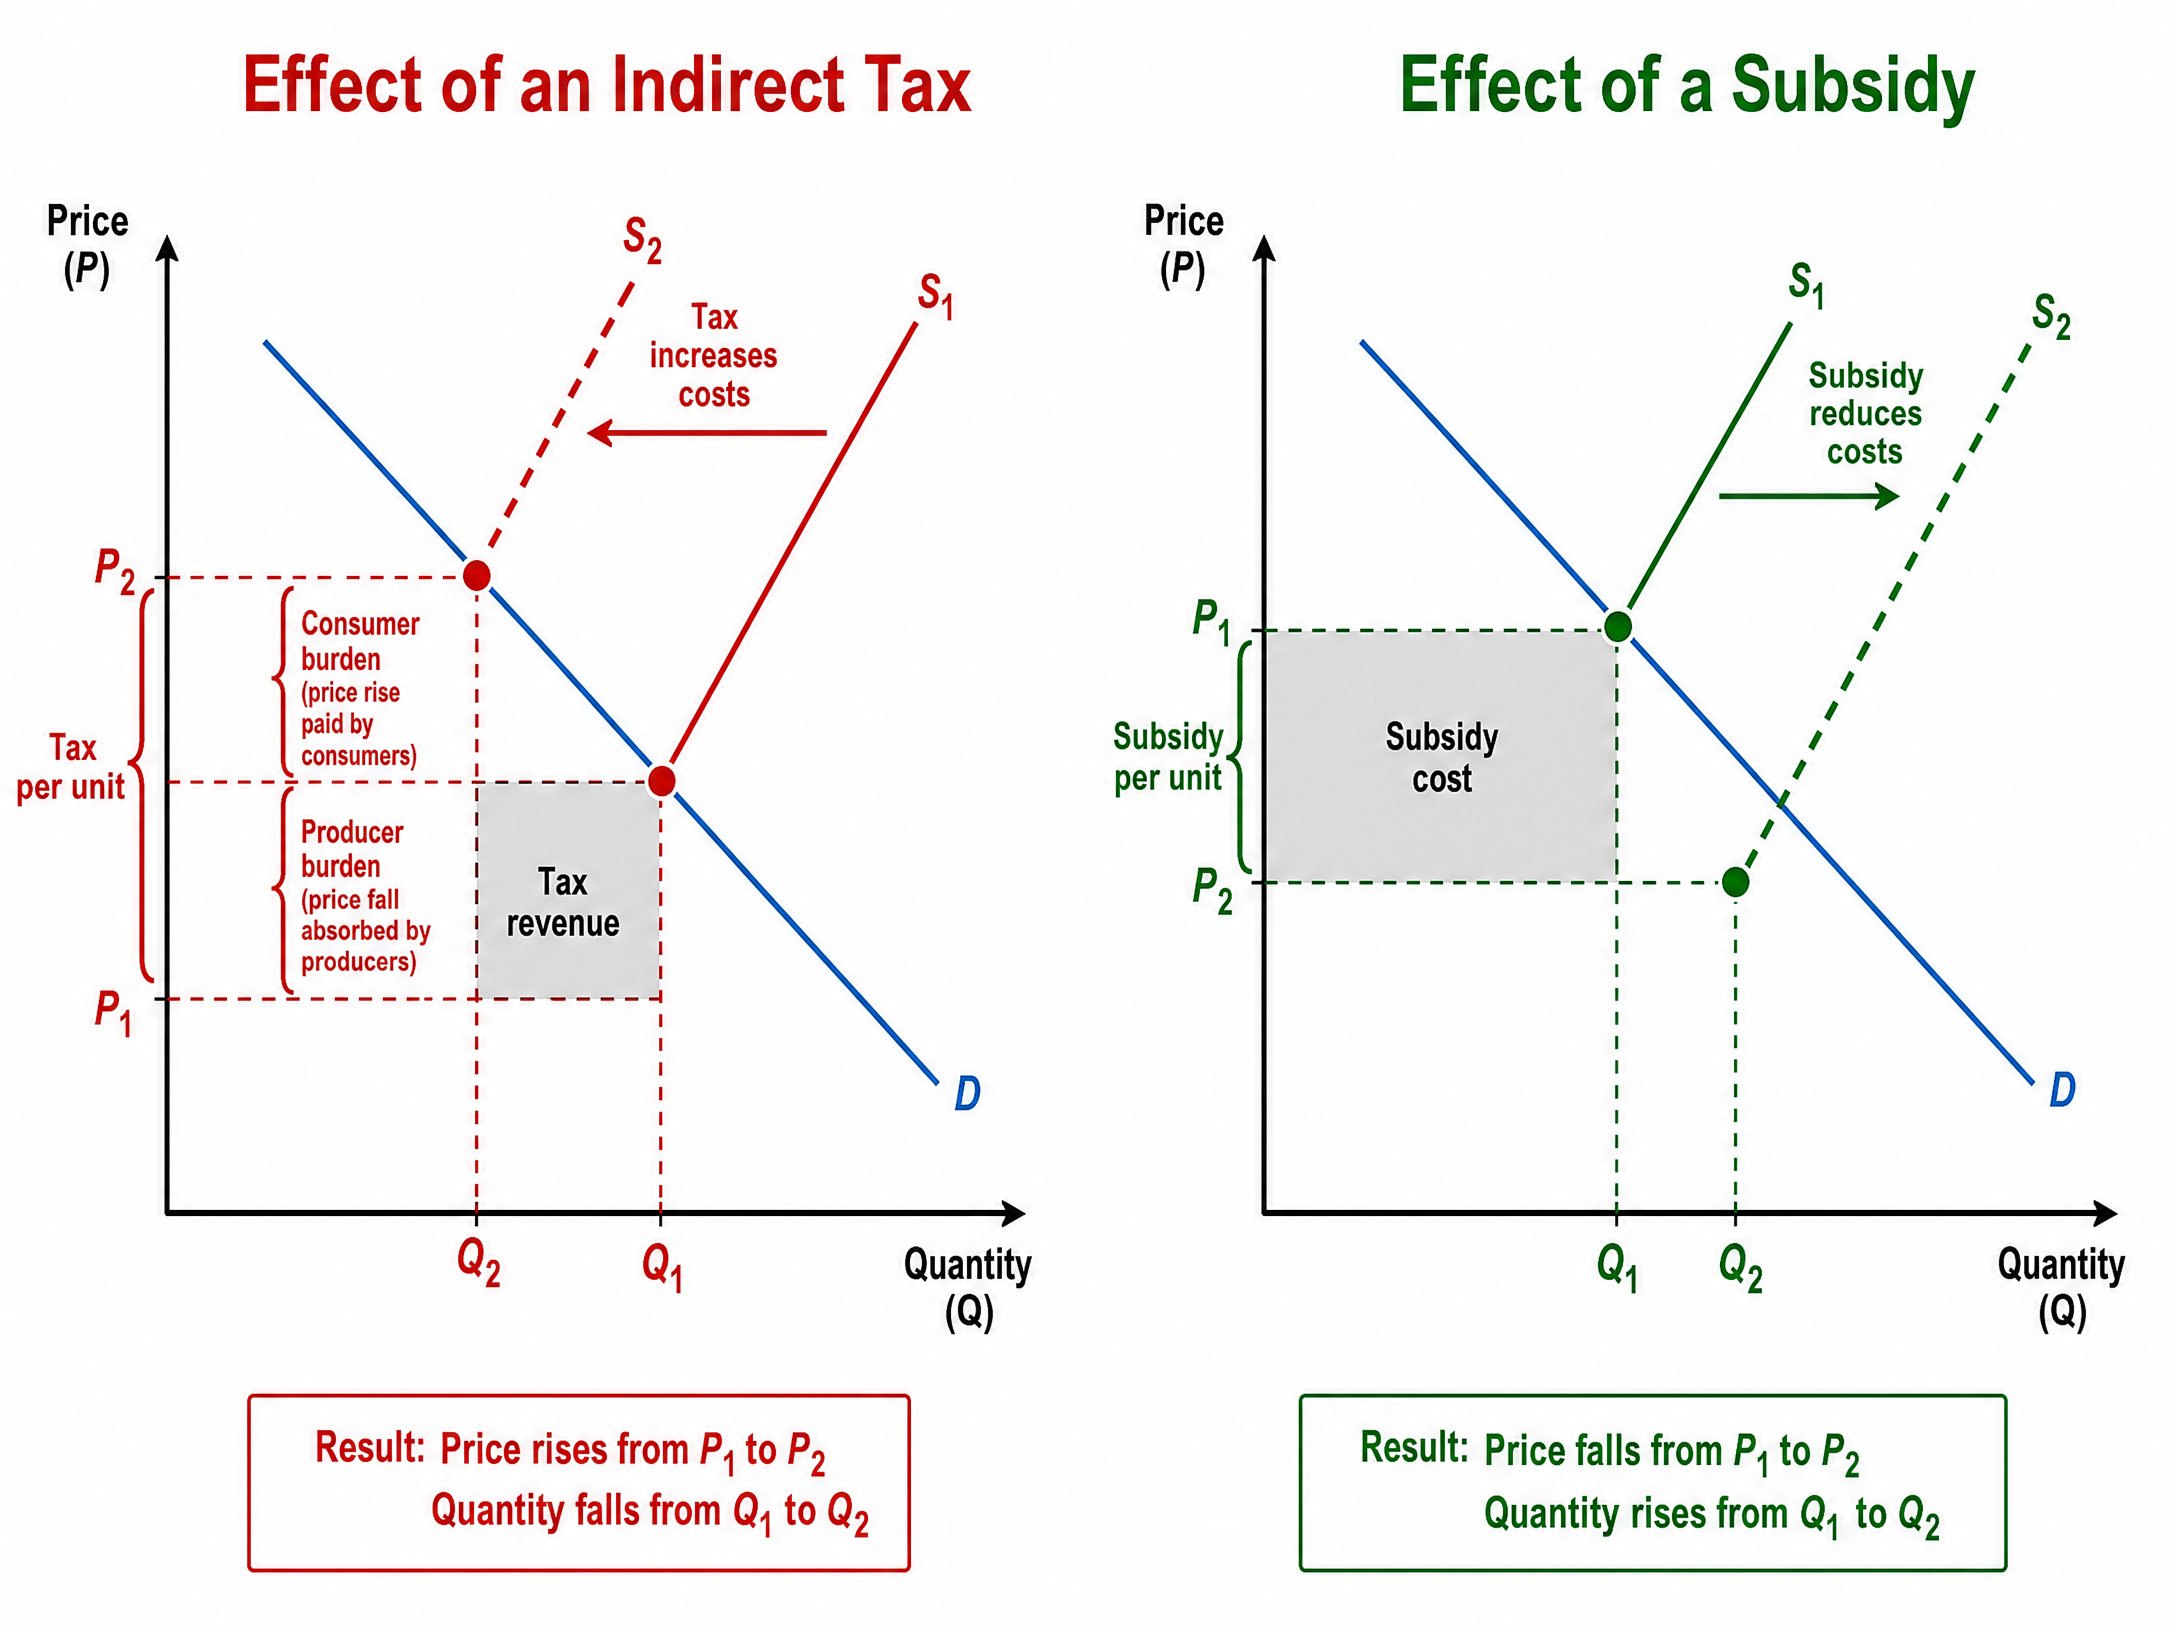
- Indirect Taxes: Taxes levied on goods and services (e.g., VAT, excise duties). They increase costs of production, shifting the supply curve to the left. The burden (incidence) of the tax is shared between consumers (higher prices) and producers (lower revenue), depending on the PED and PES.
- Subsidies: Grants given by the government to producers to encourage production. They reduce costs of production, shifting the supply curve to the right, leading to lower prices and higher quantities traded.
Consumer Behaviour
While traditional economics assumes consumers act rationally to maximise utility (satisfaction), behavioural economics recognises that consumers often act non-rationally due to:
- Habit: Consumers often stick to familiar brands out of routine.
- Social Influence: Peer pressure and societal norms heavily influence purchasing decisions.
- Computational Weakness: Consumers struggle to process complex information, calculate probabilities, or compare complex pricing structures (e.g., mobile phone tariffs).
Listen to the Revision Podcast:
Visual Resources
4 diagrams and illustrations
Interactive Diagrams
1 interactive diagram to visualise key concepts
Conceptual Flow Outline
The Price Mechanism resolving Excess Demand
Worked Examples
3 detailed examples with solutions and examiner commentary
Practice Questions
Test your understanding — click to reveal model answers
Calculate the Price Elasticity of Demand (PED) if a 10% increase in price leads to a 15% decrease in quantity demanded. State whether demand is elastic or inelastic. (3 marks)
Hint: Remember the formula: % change in Qd / % change in Price.
Explain two factors that could cause the supply curve for electric vehicles to shift to the right. (6 marks)
Hint: Use the PINTSWC mnemonic. Think about costs and technology.
Evaluate the view that the government should always subsidise public transport. (12 marks)
Hint: Consider the benefits (externalities, lower prices) against the costs (opportunity cost, inefficiency).
Explain why consumers might not act rationally when purchasing a new mobile phone contract. (4 marks)
Hint: Think about the three reasons for non-rational behaviour: habit, social influence, and computational weakness.
If the Income Elasticity of Demand (YED) for a good is -0.8, explain what will happen to the demand for this good during an economic recession. (4 marks)
Hint: What does a negative YED mean? What happens to incomes during a recession?