Study Notes
Overview

The Simplex Algorithm is a powerful algebraic method used to solve linear programming problems. While you may have used the graphical method for problems with two variables, the Simplex Algorithm allows you to solve complex problems with three or more variables by moving systematically along the edges of a feasible region to find the optimal solution.
In GCSE Further Mathematics, examiners test your ability to translate a real-world problem into standard form, construct an initial simplex tableau, and accurately perform row operations. This topic connects deeply with algebra, inequalities, and optimisation. Exam questions typically range from 4 to 8 marks, rewarding methodical working and precise arithmetic.
Listen to the companion podcast for an in-depth walkthrough of the core concepts and common exam pitfalls:
Key Concepts
Concept 1: Standard Form and Slack Variables
Before applying the algorithm, you must convert inequalities into equations. This is done by adding slack variables (s_1, s_2, \dots). A slack variable represents the unused capacity of a constraint. For example, if a constraint is 2x + y \le 10, we rewrite it as 2x + y + s_1 = 10. The objective function must also be rearranged so all terms are on one side, typically Z - cx - dy = 0.
Example: Maximise Z = 3x + 2y subject to x + y \le 5.
Standard form: Z - 3x - 2y = 0 and x + y + s_1 = 5.
Concept 2: The Initial Tableau
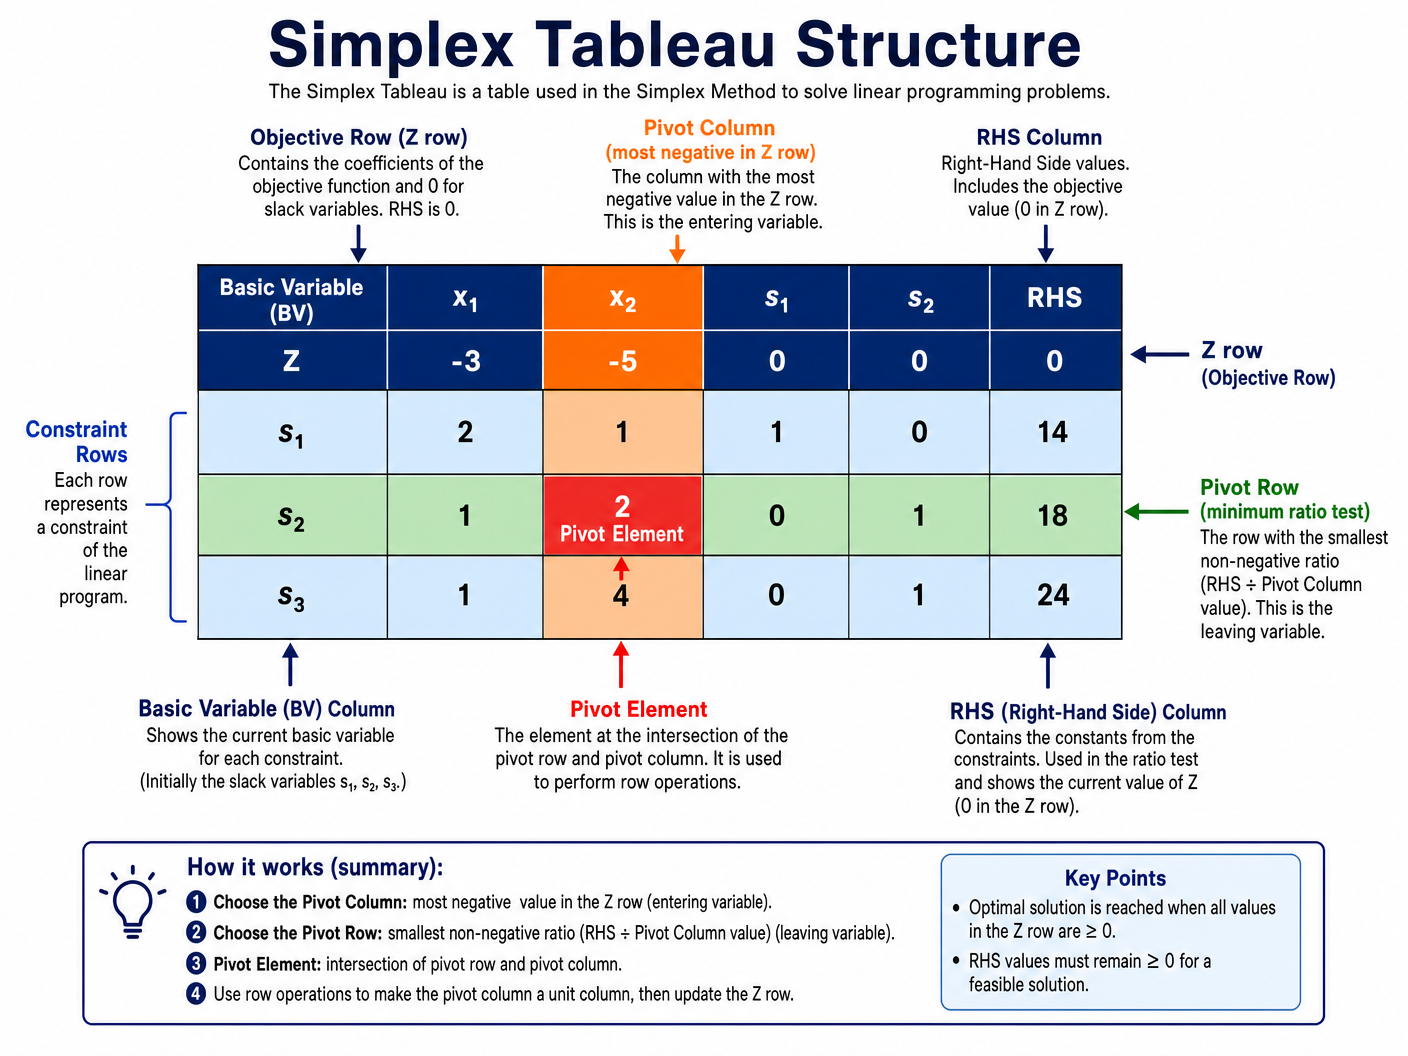
The initial simplex tableau is a matrix representing the standard form equations. The columns represent the variables (x, y, s_1, Z) and the Right-Hand Side (RHS). The basic variables (initially the slack variables) form an identity matrix within the tableau.
Concept 3: Identifying Pivot Column and Row
To improve the objective function, we must choose an entering variable and a leaving variable.
- Pivot Column (Entering Variable): The column with the most negative value in the objective row (Z row). This variable will increase Z the most.
- Pivot Row (Leaving Variable): Perform the ratio test by dividing the RHS by the positive values in the pivot column. The row with the smallest non-negative ratio is the pivot row.
Concept 4: Row Operations
Once the pivot element (intersection of pivot row and column) is identified, use row operations to make the pivot element 1 and all other elements in the pivot column 0. This algebraically moves you to an adjacent, superior vertex on the feasible region.
Concept 5: Identifying the Optimal Solution
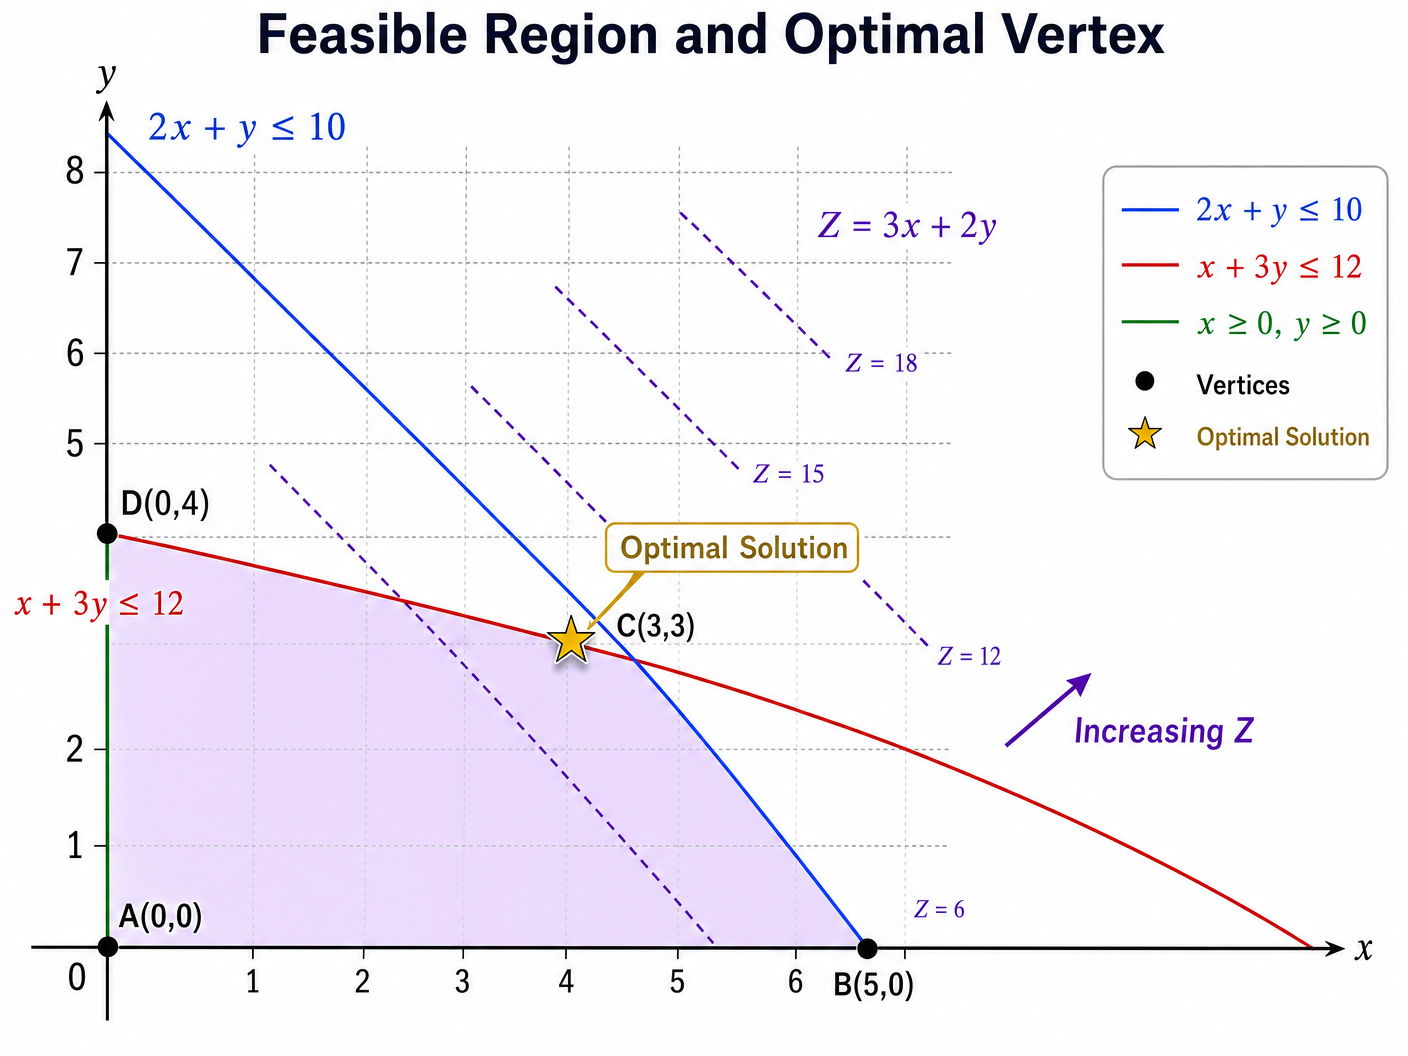
The algorithm terminates when there are no negative values remaining in the objective row. At this point, the optimal solution is found. The values of the basic variables are read from the RHS column, and all non-basic variables are 0.
Mathematical Relationships
- Objective Function: Z = ax_1 + bx_2 + \dots (The function to be maximised)
- Constraints: a_{11}x_1 + a_{12}x_2 \le b_1 (Resource limitations)
- Standard Form: a_{11}x_1 + a_{12}x_2 + s_1 = b_1 (Where s_1 \ge 0)
- Ratio Test: \text{Ratio} = \frac{\text{RHS}}{\text{Pivot Column Value}} (Only calculate for values > 0)
Practical Applications
The Simplex Algorithm is widely used in logistics, manufacturing, and finance to optimise resources. For example, an airline might use it to minimise fuel costs while meeting passenger demand and flight schedule constraints.
Visual Resources
2 diagrams and illustrations
Interactive Diagrams
2 interactive diagrams to visualise key concepts
Conceptual Flow Outline
Flowchart of the Simplex Algorithm iterative process.
Conceptual Flow Outline
Process of converting an inequality to standard form.
Worked Examples
3 detailed examples with solutions and examiner commentary
Practice Questions
Test your understanding — click to reveal model answers
Convert the following linear programming problem into standard form: Maximise Z = 5x + 3y, subject to 2x + y \le 8 and x + 2y \le 6.
Hint: Remember to move all terms in the objective function to the left-hand side.
In a simplex tableau, the objective row is P = [-4, -6, 0, 0, 0]. The RHS values for the constraints are 12 and 15. The column for y (the most negative in P) has values 2 and 5 respectively. Determine the pivot row.
Hint: Calculate the ratio of RHS to the pivot column value for each row.
A final simplex tableau has basic variables x = 10, s_2 = 4, and P = 120. Variables y and s_1 are non-basic. State the full optimal solution.
Hint: What value do non-basic variables take?
During a ratio test, the values in the pivot column are 4, 0, and -2. The corresponding RHS values are 20, 10, and 8. Which row should be chosen as the pivot row and why?
Hint: What are the rules for valid ratios?
Perform one iteration of the simplex algorithm on the following initial tableau to find the next tableau. [6 marks]
| BV | x | y | s1 | s2 | RHS |
|---|---|---|---|---|---|
| s1 | 1 | 2 | 1 | 0 | 14 |
| s2 | 3 | 1 | 0 | 1 | 15 |
| P | -4 | -5 | 0 | 0 | 0 |
Hint: Identify pivot column, calculate ratios, find pivot row. Then use row operations to make the pivot element 1 and other entries in that column 0.