AQA · A-Level · Mathematics
Course version: 7357 · Version from Sept 2017
K: Statistical sampling
Statistical sampling is where AQA statistics begins: you collect evidence from a sample and decide how cautiously it can be used to say something about a population. Master the precise language of population, sampling frame, simple random sampling, opportunity sampling and informal inference, and you turn short context questions into dependable marks.
- 10 min read
- 3 worked examples
- 5 practice questions
- 10 key terms
Try the lesson
The start of the K: Statistical sampling lesson, made from checked teaching notes for this specification point.
Have a go first
A researcher wants to find the mean height of all 620 students in a college. She measures the heights of 40 students chosen at random. In this study, which group is the population?
There is more to this lesson
The full lesson goes on to check your understanding and help you earn the marks. Create a free account to carry on, with your progress saved.
7 days Premium · Then the free plan continues · No card, no charge
Check what you remember
Read the wording for your board, then hide it and explain Population in your own words. Rough notes are fine. This is a self-check, with no mark or grade.
Reference: AQA
The complete set of individuals, items or observations about which an investigation wants information.
Study Notes

AQA A-Level Mathematics: K Statistical Sampling
Specification reference: AQA A-level Mathematics (7357), 3.12 K: Statistical sampling, K1.
Overview
Statistical sampling is the art of using a manageable part of a group to say something sensible about the whole group. In an AQA question, the mathematics is often short, but the reasoning is not: candidates must identify the population and sample, choose or criticise a method in context, and make a conclusion that is cautious rather than overconfident. The specification explicitly includes simple random sampling and opportunity sampling, then expects you to understand that two valid samples can still lead to different conclusions.
This is the first step in the statistics story. You sample before you draw diagrams or calculate summary statistics in Topic L, before you model probability in Topic M, and before you test a claim in Topic O. A typical question gives a survey, experiment or data set and asks you to state a population, describe a sampling method, explain possible bias, or assess whether a conclusion is justified. Marks are awarded for contextual precision: say who was sampled, how they were chosen, and what that means for the conclusion.
Examiner’s lens: A sample result is evidence about a population, not the population itself. Credit is given for language such as “suggests”, “may indicate” and “is not necessarily representative”.
Revision Podcast
Listen once for the overview, then pause at the quick-fire quiz and answer aloud before continuing. The audio uses the same examiner-creditworthy phrasing as the worked examples, so it is designed for active recall rather than passive listening.
Key Concepts
1. Population, sample and sampling frame
The population is the complete group about which the investigation wants information. It is defined by the question, not by how many people are conveniently available. If a university wants to know the average weekly study time of all first-year students, the population is every first-year student at that university. A sample is the smaller group from which data are actually collected.
A sampling frame is the list or source from which the sample is selected. It must match the target population as closely as possible. A register of students who attend a lunchtime club is not a sound frame for every student in the school, because it excludes non-attenders. This matters because no random-number generator can repair a frame that has already left out part of the population.
Example: A sixth form has 360 Year 12 students. A researcher uses the official Year 12 register to choose 40 students. Population = all 360 Year 12 students; sample = the 40 chosen students; sampling frame = the official register of 360 names.
2. Simple random sampling: fair selection, not guaranteed perfection
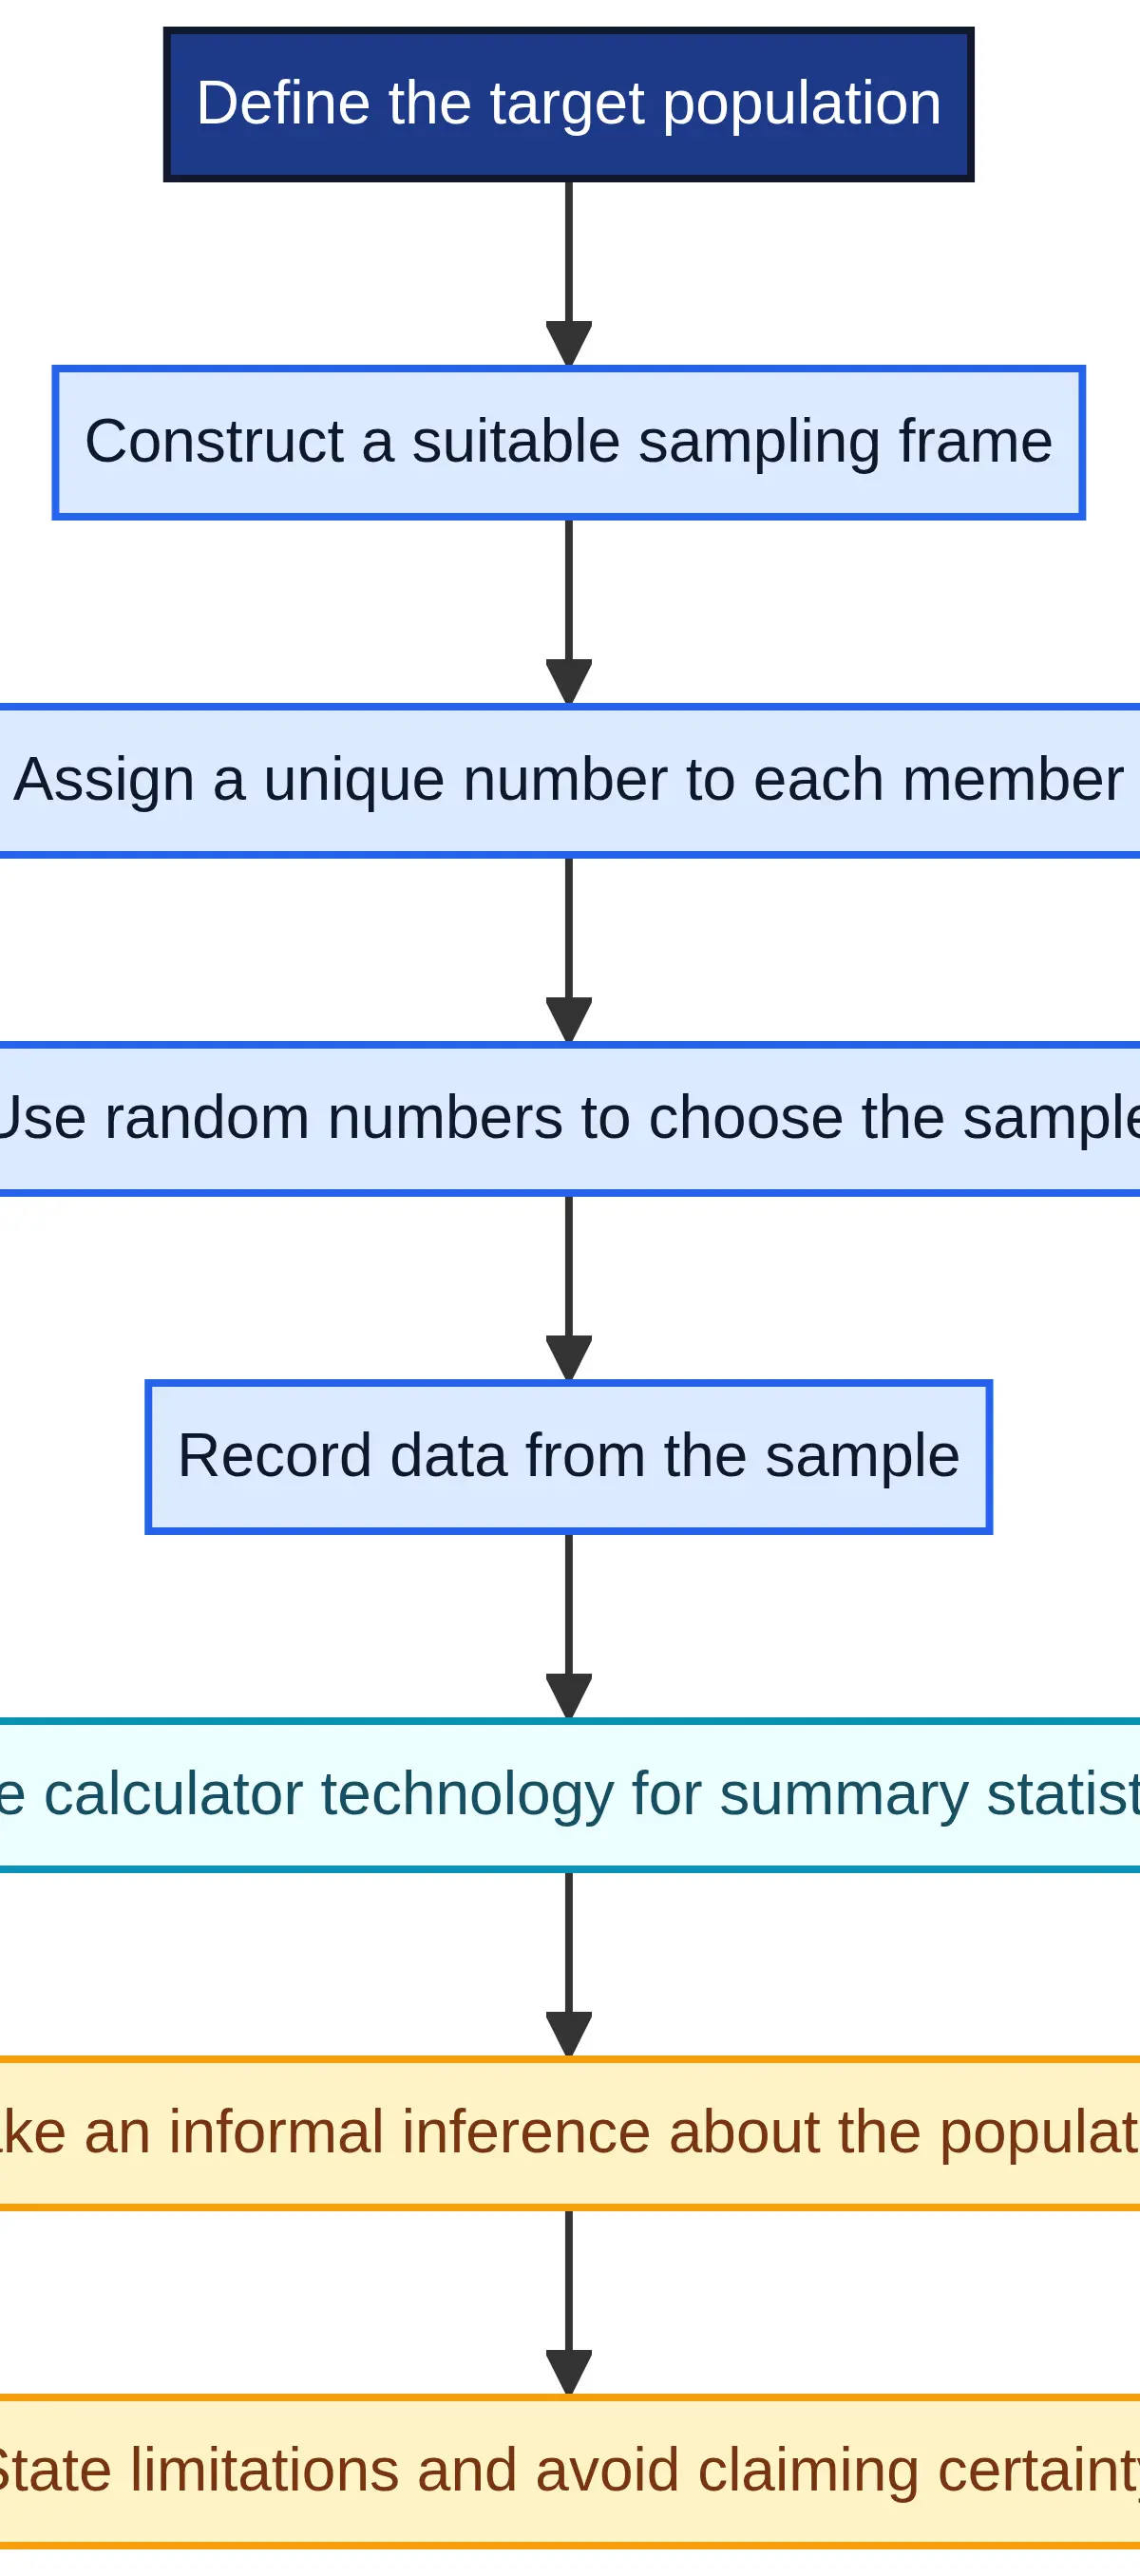
In a simple random sample, every member of the population has an equal chance of being selected. A robust exam description is: make or use a complete sampling frame, assign each member a unique number, use a random-number generator or random-number table to choose the required distinct numbers, then collect data from those corresponding members.
Why does this work? Random selection removes deliberate choice by the investigator. It reduces selection bias, because no one is picked simply for being easiest to contact or most likely to agree. However, random does not mean perfectly representative. By chance, a small random sample can contain more keen cyclists, taller students or higher earners than the population proportion. That is sampling variation, not proof that the method was wrong.
Example: To choose 25 pupils from a numbered list of 1 to 500, generate 25 distinct integers from 1 to 500. If 17, 203 and 487 appear, select the pupils numbered 17, 203 and 487. Do not keep generating until the numbers “look balanced”; that would destroy the random design.
3. Opportunity sampling: efficient but exposed to bias
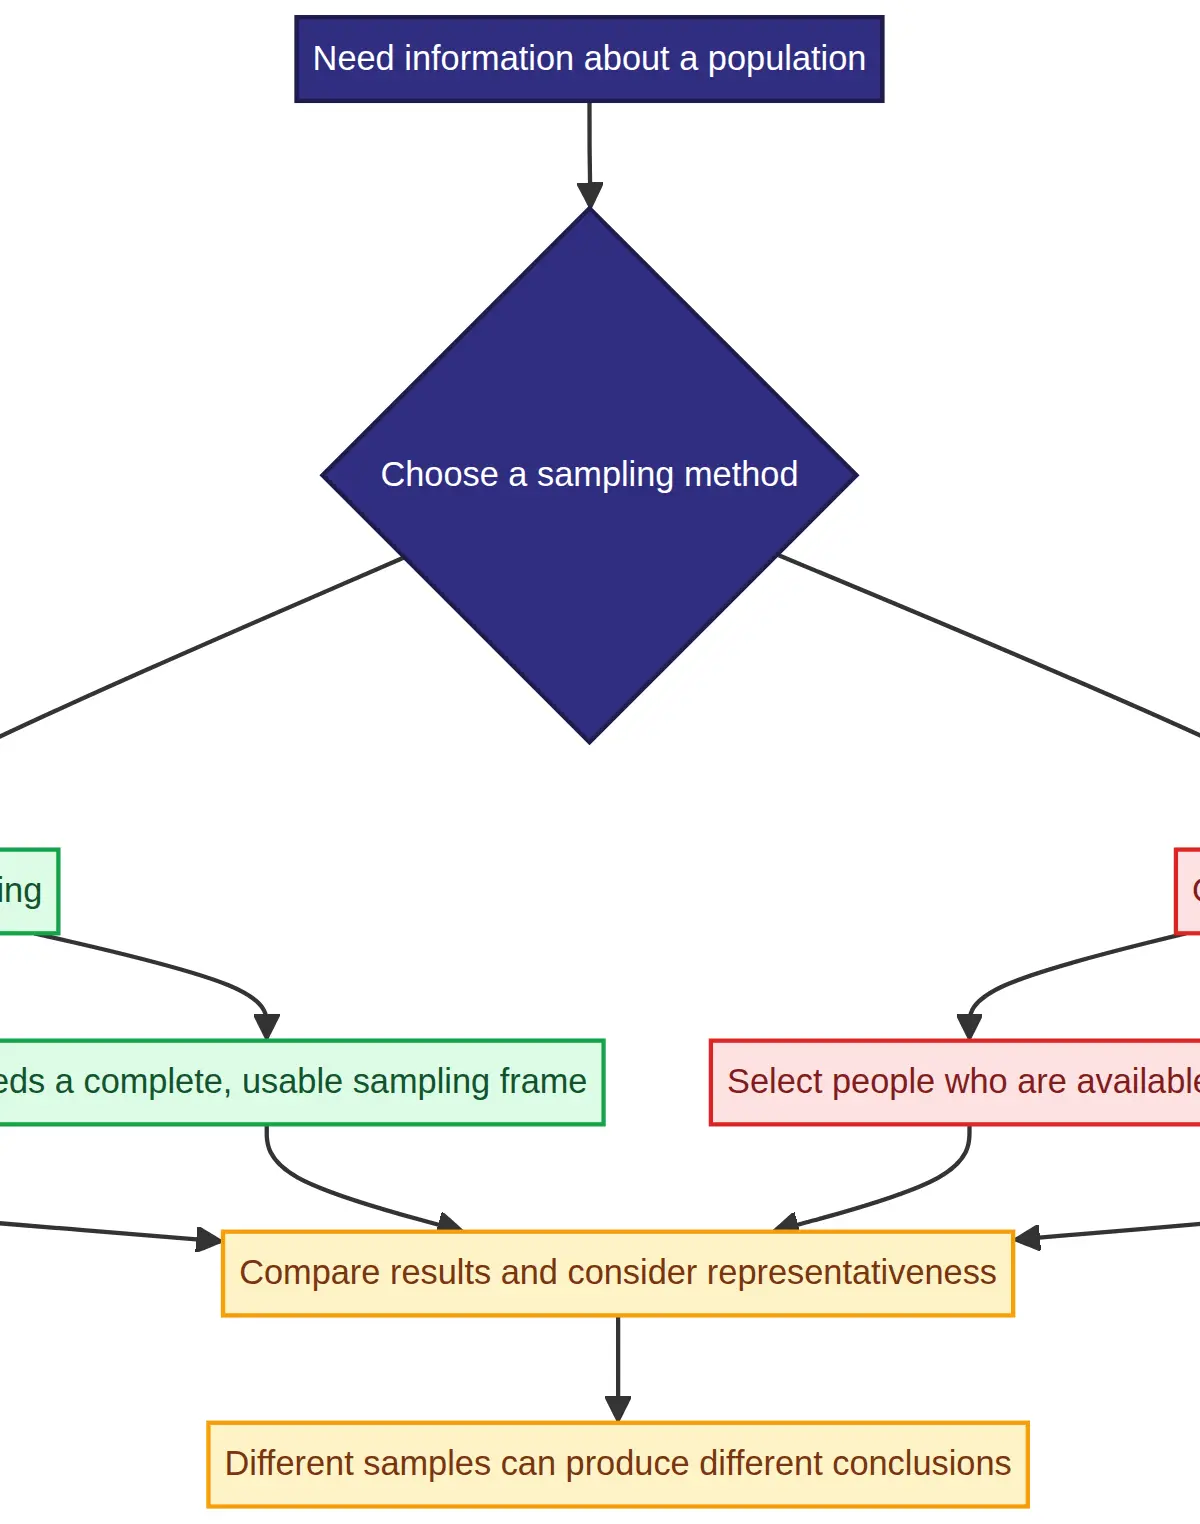
An opportunity sample is made from people who are available or easy to reach. Asking the first 30 visitors leaving a sports centre is opportunity sampling. It may be quick, cheap and practical, which can be a reasonable advantage in a real investigation. The weakness is not merely that it is “unfair”. The precise criticism is that available people may differ systematically from the whole population. Sports-centre visitors may be more active than local residents generally, so their exercise habits are unlikely to represent all residents.
Use the context in your criticism. “It may be biased” earns less than “it over-represents people who use the sports centre, so the estimated weekly exercise time may be too high”. Also notice non-response: even if people are approached, those who refuse may differ from those who agree.
4. Representativeness, bias and informal inference
A representative sample resembles the relevant features of the population closely enough for the purpose of the investigation. There is no magic rule that a sample is representative simply because it is large. A very large opportunity sample from one location can still miss whole groups. A smaller, well-designed random sample may be more useful.
Bias is a systematic tendency for a sample or measurement process to favour some outcomes or groups. Selection bias can come from the frame, the method, the location, the time of day or the people who choose to respond. A leading question can introduce response bias too, although the question wording is a separate design issue.
An informal inference is a cautious conclusion from sample evidence to the population. If 36 out of 60 randomly chosen students prefer digital notes, write: “The sample suggests that around 60% of students may prefer digital notes.” Do not write: “Exactly 60% of all students prefer digital notes.” The first statement recognises that another sample could give a different result.
5. Different samples, different conclusions
Suppose two independent random samples of 20 students give mean commuting times of 28.4 minutes and 31.1 minutes. Neither result has to be wrong. A sample statistic changes from sample to sample because the people selected change. AQA expects candidates to recognise this point when they critique an overconfident population claim.
The distinction between a parameter and a statisticsharpens this idea. A population mean, often written (\mu), is a fixed but usually unknown parameter. A sample mean, (\bar{x}), is a statistic calculated from the selected observations. You may use a sample mean as evidence about (\mu), but they are not automatically equal.
5a. Turning statistical understanding into marks
Most sampling questions reward the quality of your interpretation, not a long list of definitions. Begin with the command word. For state or identify, write the exact target group or sampling method and stop. For describe, give the method as a sequence of actions. For explain, connect cause to consequence using “because”. For evaluate, include a judgement after the evidence.
If an opportunity sample is taken outside a gym, an answer such as “the sample may be biased” is a starting point only. Improve it in three moves: identify the group, link it to the variable, then qualify the conclusion. For example: “Gym users are likely to exercise more than non-users, so this opportunity sample may overestimate the population’s mean weekly exercise time.” This earns credit for method, context and effect.
Similarly, do not praise simple random sampling as “unbiased” without qualification. A more accurate statement is: “It gives every member an equal chance of selection and reduces selection bias, provided the sampling frame is complete. However, the sample may still be unrepresentative by chance.” This distinction is exactly what separates a basic answer from an AO2/AO3 answer: you are reasoning about the limits of a model in context.
When a question supplies a mean or proportion, calculate accurately and then write one sentence of interpretation. Include the unit, name the population, use cautious language and, if appropriate, state a limitation. An examiner can award credit for a concise conclusion that does all four jobs. Do not replace explanation with a calculator screen value.
6. Choosing and critiquing methods in context
A high-mark answer weighs feasibility against validity. Simple random sampling is usually stronger when a full sampling frame exists, but it may be slow or expensive to contact selected people. Opportunity sampling is fast, but it is especially vulnerable to location and time bias. Other methods can be useful comparisons: a systematic sample selects at a fixed interval after a random start; a stratified sample samples from groups in proportion to their population sizes; a cluster sample selects whole groups. These methods are useful vocabulary, but keep your answer anchored to the method and context in the question.
Mathematical Relationships and Calculator Use
There is no new formula to memorise for K1. The key relationship is conceptual:
[\text{sample statistic } \bar{x} \text{ is used to estimate the population parameter } \mu.]
When a question gives numerical data, calculator technology can calculate a sample mean, standard deviation or other summary statistic. The arithmetic is only the start. You must attach meaning: “The sample mean is 7.4 hours; this suggests the population mean may be near 7.4 hours, provided the sample is sufficiently representative.”
Formula status:(\bar{x}) as a sample mean and (\mu) as a population mean aremust-know notation, not a separate K1 formula-sheet calculation. The important skill is interpreting a calculator output as a sample statistic rather than reporting it as an exact population fact. No unit conversion is specific to this topic.
Practical Applications
Sampling underpins opinion polls, quality control, clinical research, transport surveys and the AQA large data set. A council cannot usually interview every resident about bus use, so it samples residents. A factory cannot always test every item destructively, so it tests a sample. In each case, ask the same three questions: **Who is the population? What frame was used? Could the selection over-represent some people or items?**There is no required practical for A-level Mathematics K1. Treat a survey-design question as a miniature investigation: define the population, design or assess the sampling route, calculate summaries using technology if asked, then state an inference with a limitation.
Visual Resources
2 diagrams and illustrations
Interactive Diagrams
2 interactive diagrams to visualise key concepts
Conceptual Flow Outline
A simple random sampling route from target population to cautious inference.
Conceptual Flow Outline
Method choice changes how confidently a sample result can be used.
Worked Examples
3 worked examples — open one to explore the question and available guidance.
Practice Questions
Try the question, then reveal an answer plan or example response
A headteacher wants the mean travel time to school for all 1,200 pupils. She asks 30 pupils in a before-school basketball club. Identify the population, identify the sample and name the sampling method. [3 marks]
Hint: Separate the group of interest from the group actually asked.
Explain how to obtain a simple random sample of 15 books from a library inventory of 2,400 books. [4 marks]
Hint: Your answer needs a frame, numbers and a genuinely random selection process.
A café surveys the first 50 customers through the door at 8:00 am on a Tuesday and finds that 76% prefer coffee to tea. Give two distinct reasons why this may not estimate the preference of all customers during a typical week. [4 marks]
Hint: Name a specific group or time that could be misrepresented, then link it to the conclusion.
Two independent simple random samples of 40 employees from the same company give mean weekly overtime of 3.1 hours and 3.8 hours. Explain why these results do not prove that one sample was selected incorrectly. [5 marks]
Hint: Think about what changes when a new random sample is drawn.
A local authority has a complete register of 6,000 residents. It wants to estimate average weekly bus journeys for all residents. Evaluate the proposal: ‘Ask 200 people waiting at the central bus station, then use the calculator mean as the town mean.’ Suggest a better sampling design. [6 marks]
Hint: Evaluate the frame and selection, then explain a practical improvement.
Exam technique
How to turn what you know into marks
How to approach the question
Locate the target population first, then the group actually measured. Identify the selection method. For simple random sampling, describe frame, numbering, random distinct selections and matching members. For critique, name the over- or under-represented group, explain the possible direction of bias, distinguish sample statistic from population parameter, then make a qualified judgement.
How to structure your answer
1-2 marks: define the exact population/sample or state the method directly. 3-4 marks: use one complete method or criticism with context. 5-6 marks: identify method, explain limitations in context, discuss inference or sampling variation, and finish with a justified conclusion or improvement.
Timing
AQA A-level Mathematics papers are 2 hours for 100 marks, so use about 1.2 minutes per mark overall. Plan roughly 3-4 minutes for a 3-mark sampling item and about 7 minutes for a 6-mark evaluate question.
Common pitfalls
- Calling the convenient group the population. Fix this by defining the complete target group before mentioning who was actually asked.
- Writing ‘biased’ without a context-specific explanation. Fix this by naming the group over-represented and the likely effect on the result.
- Treating a calculator mean as the exact population mean. Fix this by labelling it a sample statistic and using ‘suggests’ or ‘may indicate’.
- Saying ‘use random numbers’ without identifying a frame, range or matching selections. Fix this with the P-F-R-S-I routine.
What the command words want
- Compare
- Name both methods or samples and give a meaningful difference, such as equal chance from a frame versus convenience of those available.
- Explain
- Use ‘because’ to link the method to an over-represented group and the effect on the inference.
- Describe
- Give the selection steps in order: frame, number, randomise, select. Include the numerical range where provided.
- Evaluate
- Give strengths and limitations in context, recognise sampling variation, and finish with a balanced, justified judgement or a better method.
- Calculate
- Show the sample proportion or statistic, then interpret it as an estimate rather than an exact population value.
- State/Give
- Give the exact group or term required. Do not add an unrelated method if a one-mark identification is asked.
Watch or listen (optional)
Test your understanding of K: Statistical sampling
Active recall beats re-reading. Take an instant quiz now to test what you’ve learned and lock it into long-term memory.
7 days Premium · Then the free plan continues · No card, no charge