AQA · A-Level · Mathematics
Course version: 7357 · Version from Sept 2017
L: Data presentation and interpretation
Data presentation and interpretation is where an A-Level statistician earns marks by explaining what data means, not merely by operating a calculator. Master histogram area, disciplined scatter-plot language, standard deviation and defensible data cleaning, and you can turn unfamiliar contexts into structured, high-credit answers.
- 10 min read
- 3 worked examples
- 5 practice questions
- 9 key terms
Try the lesson
The start of the L: Data presentation and interpretation lesson, made from checked teaching notes for this specification point.
Have a go first
A scatter diagram shows points that lie close to a straight line sloping downwards from left to right. What type of correlation does the diagram show?
There is more to this lesson
The full lesson goes on to check your understanding and help you earn the marks. Create a free account to carry on, with your progress saved.
7 days Premium · Then the free plan continues · No card, no charge
Check what you remember
Read the wording for your board, then hide it and explain Frequency density in your own words. Rough notes are fine. This is a self-check, with no mark or grade.
Reference: AQA
Frequency per unit class width; on a histogram, frequency density × class width gives the frequency represented by a bar.
Study Notes

Overview
AQA A-Level Mathematics 7357, section 3.13 L asks candidates to turn data into defensible conclusions. The calculations are usually short; the marks are often in the interpretation. You need to read a histogram by area, describe a scatter diagram precisely, choose statistics that represent the distribution fairly, and challenge data that may be misleading. This is the bridge between numerical technique and mathematical argument.
The topic can appear in the statistics content on Paper 2 or Paper 3. Each A-Level paper lasts 2 hours and is worth 100 marks, so a practical pacing guide is about 1.2 minutes per mark across the whole paper. There is no fixed number of marks for 3.13 L. A short one-mark interpretation, a linked multi-part context question, or a longer critique can all assess it. Calculators are permitted, but calculator output alone does not earn the communication marks: candidates must interpret it in context.
The four specification strands are: L1 single-variable diagrams and histogram area; L2 scatter diagrams, regression lines and correlation; L3 central tendency, variation and standard deviation; and L4 outliers, presentation choices and data cleaning. The same thinking connects directly to sampling, probability distributions and hypothesis testing.
Key concept 1: Histograms and single-variable data
A histogram displays continuous grouped data. Its bars touch because the values can lie anywhere within each class interval. The horizontal axis uses class boundaries, while the vertical axis is usually frequency density when class widths differ. A bar does not represent frequency through its height unless every class has the same width.
**Non-negotiable rule: frequency = bar area.**The relationship is:
- Frequency density = frequency ÷ class width. Must memorise.
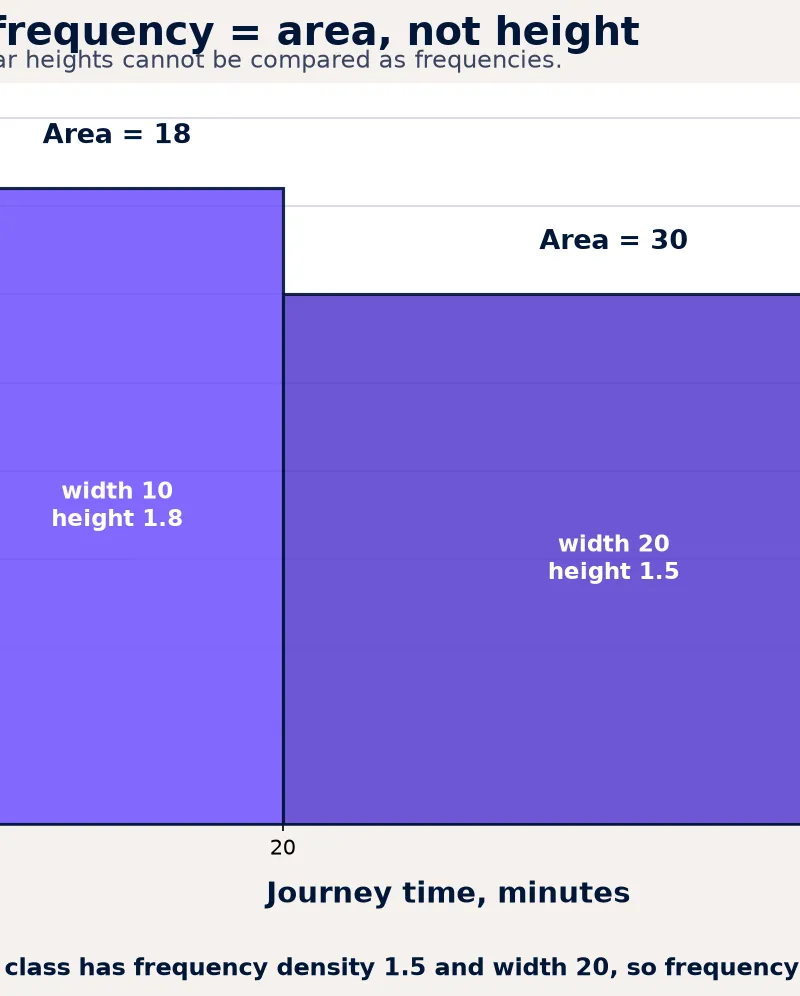
- Frequency = frequency density × class width. **Must memorise.**For example, a 20–40 minute class has width 20. If its frequency density is 1.5, its frequency is
1.5 × 20 = 30. A 10–20 minute class with height 2.5 also has frequency2.5 × 10 = 25. Although the first bar is lower, it contains more observations because it is wider. Credit is given for calculating the area, not for comparing heights.
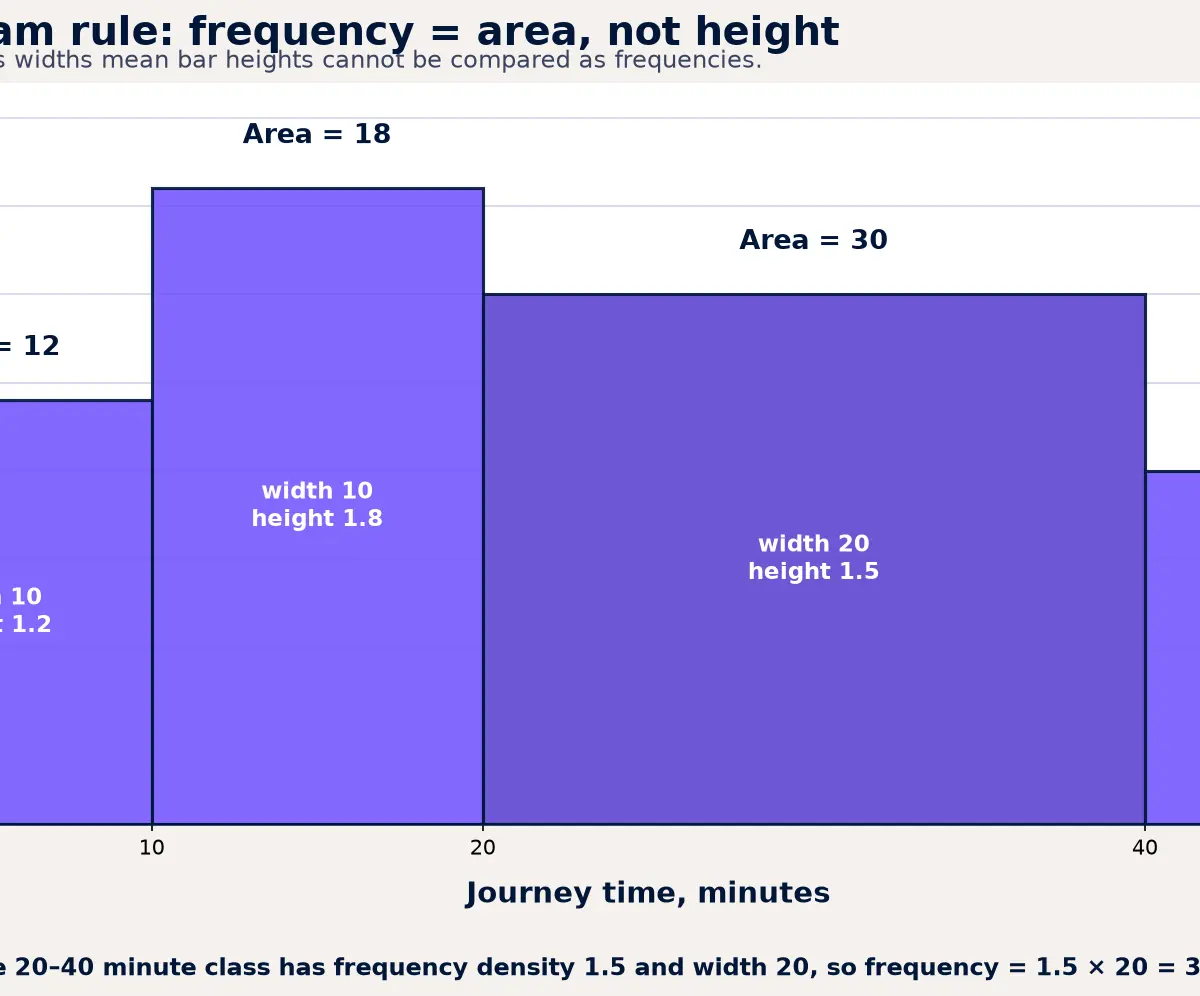
When interpreting a diagram, go beyond a bare observation. State the feature and what it means in context. Strong wording is: “Most journey times are between 10 and 30 minutes, while relatively few journeys exceed 40 minutes.” If the distribution has a long tail to large values, it is positively skewed; a long tail to small values is negatively skewed. A distribution can also be approximately symmetric, uniform, or bimodal. These shapes matter because they affect whether the mean is representative and whether a probability model may be appropriate later in the course.
Key concept 2: Bivariate data, correlation and regression
Bivariate data records two variables for each individual or unit, such as revision time and test score. A scatter diagram is the usual first view. For an interpretation question, train yourself to give D-F-S-C: Direction, Form, Strength, Context.
- Direction: positive, negative or no clear association.
- Form: linear, non-linear, clustered, or separate sections of the population.
- Strength: weak, moderate or strong, judged from how closely points follow the pattern.
- Context: name both variables rather than writing only “positive correlation”.
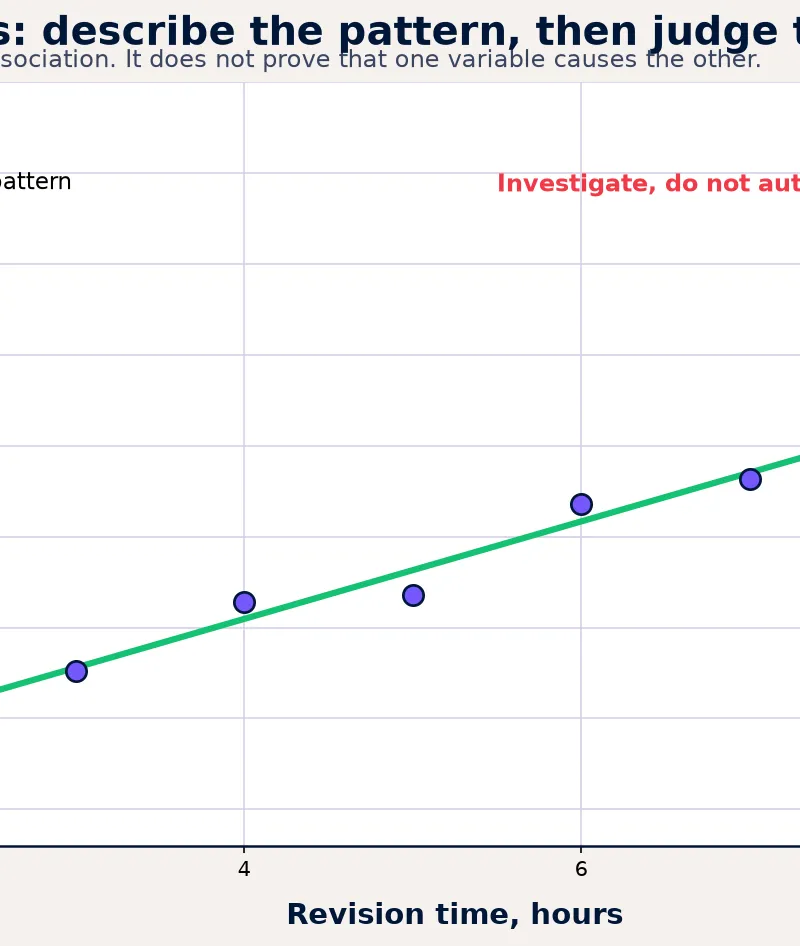
For example: “There is a moderately strong positive linear association between hours of revision and test score.” This is more precise than “the graph goes up”. If the points form two distinct clouds, candidates should say so. A single line may hide meaningful groups, for example results from two age groups or two measurement methods.
A regression line summarises the average linear trend. A point above the line has a y-value greater than the model predicts for its x-value; a point below has a lower y-value. Under AQA 3.13 L, calculations involving regression lines are excluded. The assessment is interpretation: judge whether the line is appropriate, recognise unusual points, and avoid extrapolating beyond the range of observed x-values.
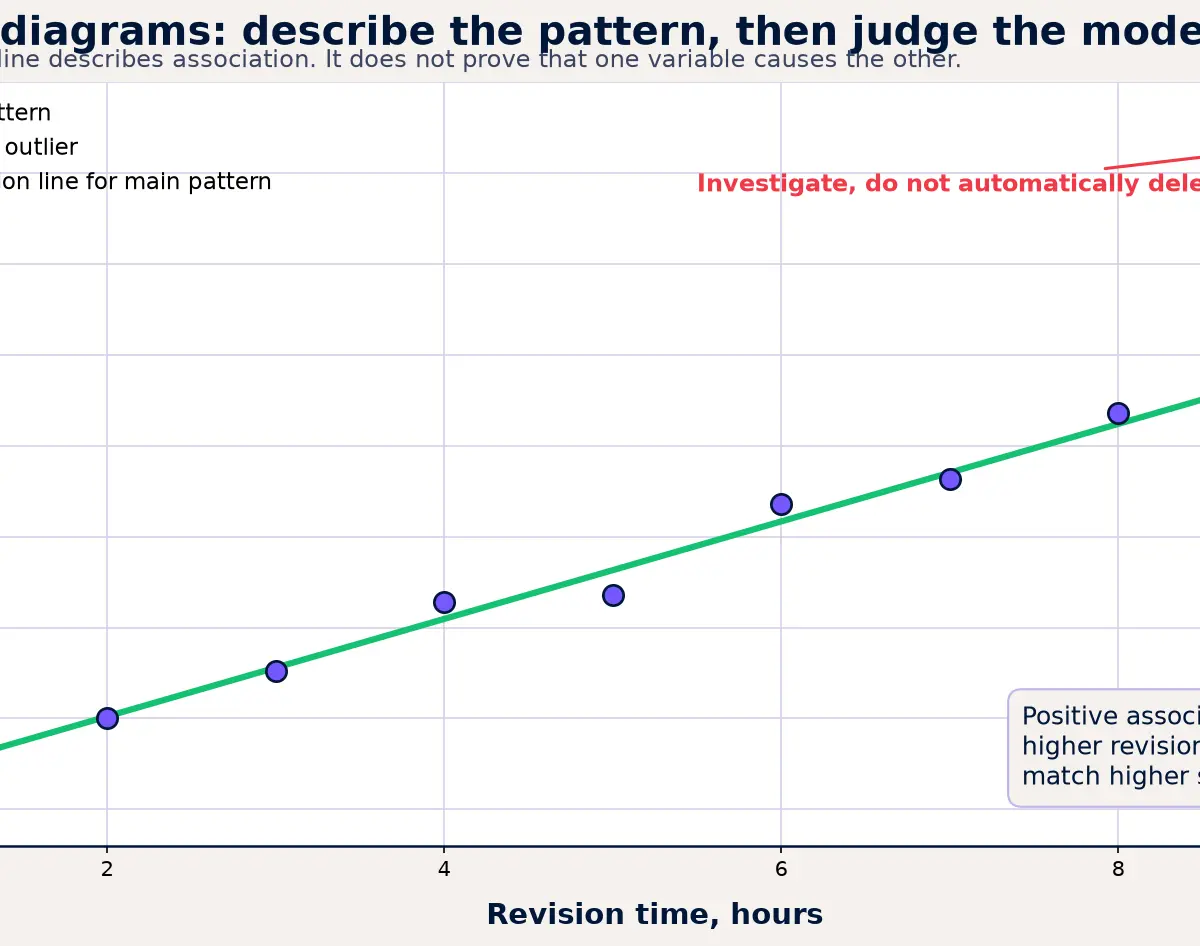
Most importantly, correlation does not imply causation. A positive association between ice-cream sales and rescue incidents does not show that ice cream causes the incidents. Temperature could be a third variable affecting both. In a response, a credible alternative explanation earns more than merely writing the slogan. Say what might be causing or influencing both variables, then state that the data alone cannot establish a causal relationship.
Key concept 3: Location, spread and standard deviation
A measure of central tendency describes a typical value. The mean uses every observation and is useful for reasonably symmetric data without influential extremes. The median is the middle ordered value and is more resistant to outliers and skew. The mode is the most frequent value and can be useful for categorical data. There is no automatic “best average”: select the statistic that serves the question.
Measures of variation show how spread out the data are. The range uses only two values, so one extreme value can alter it dramatically. The interquartile range describes the middle 50% and is more robust. The standard deviation measures typical distance from the mean: a small standard deviation means values are clustered, while a large one means they are dispersed.
Relevant relationships:
x̄ = Σx ÷ nfor the mean. Must memorise and understand.IQR = Q3 − Q1. Must memorise.s² = Σ(x − x̄)² ÷ n = Σx² ÷ n − x̄². Given on the AQA A-Level formula booklet.s = √(Σx² ÷ n − x̄²). **Given on the AQA A-Level formula booklet.**Here,nis the number of observations,Σxis the sum of the values, andΣx²means “square each value, then add”. It does not mean “add the values and then square”. When summary statistics are supplied, calculate the mean first, substitute carefully, keep full calculator precision, then give a sensible final accuracy. Marks are awarded both for a correct calculation and for an interpretation such as “Class B is more consistent because it has the smaller standard deviation.”
Calculator statistics mode is a time-saver, not a substitute for thinking. Clear a previous list, enter every datum accurately, select the appropriate standard-deviation output, and check whether the question wants a numerical answer, a comparison, or a conclusion in context.
Key concept 4: Outliers, data choice and data cleaning
A possible outlier is an observation unusually far from the general pattern. It may be a transcription error, a genuine rare observation, a value from a different population, or an important feature of the investigation. Never write “remove it” without a reason. Instead, investigate the source, units and context; decide whether the observation is plausible; state how including it changes the analysis; and report the limitation of the decision.
For a box plot, a common diagnostic is a value below Q1 − 1.5 × IQR or above Q3 + 1.5 × IQR. Must memorise if your class uses this convention. It is an investigation flag, not proof that a value is wrong. AQA requires recognition and interpretation of possible outliers, rather than blind deletion.
Data cleaning makes raw data fit for analysis while preserving an audit trail. Useful actions include:
- Keep missing values visibly coded as missing, investigate them, or use a stated imputation method only when it is justified.
- Check impossible values, wrong units, duplicated records and typing errors against the original source where possible.
- Flag potential outliers and compare conclusions with and without them if that helps evaluate their influence.
- Explain the consequence: removing data can reduce bias from an error, but can also introduce bias if genuine unusual cases are discarded.
Select the presentation to suit the variable and purpose. A bar chart is appropriate for categories; a histogram for continuous grouped data; a scatter diagram for two numerical variables; a box plot for comparing distribution and possible outliers. Critique a graph by considering labels, scale, class width, sample size, missing context and whether the display might exaggerate a difference.
Graph and data skills checklist
Before you answer, use this five-step routine:
- Read the axes: variable, units, scale, class boundaries and whether the vertical axis is frequency or frequency density.
- Calculate only what is needed: for a histogram, use area; for standard deviation, identify
n,ΣxandΣx². - Describe a visible feature: give direction, shape, cluster, spread or outlier.
- Interpret in context: name the real variables and explain what the feature suggests.
- Qualify the claim: recognise causation limits, extrapolation, sample limitations or data-quality concerns.
This routine is especially effective on AO2 and AO3 marks, where candidates must reason, communicate and evaluate rather than only carry out a routine procedure.
Exam technique and command words
For state or give, provide the requested statistic, label or conclusion directly. For describe, report distinct features of the display in context. For calculate, show the formula or the substitution, even when using a calculator, and give a suitably rounded answer. For explain, connect a feature to a consequence using “because”. For evaluate or critique, balance a strength against a limitation, then make a judgement relevant to the context.
A typical 4-mark histogram question often gives one mark for identifying a class width, one for a correct frequency-density relationship, one for accurate arithmetic, and one for a contextual interpretation. A 5- or 6-mark data question usually needs more than a calculation: expect marks for method, result, comparison, limitation and conclusion. Candidates lose marks when they write an unqualified causal claim, compare histogram heights with unequal widths, or report a standard deviation without saying what it shows.
Podcast companion
Use the ten-minute audio recap after completing the worked examples. Pause for the recall questions rather than letting the answer play straight away.
Visual Resources
2 diagrams and illustrations
Interactive Diagrams
2 interactive diagrams to visualise key concepts
Conceptual Flow Outline
Decision route for interpreting a histogram accurately, especially where class widths differ.
Conceptual Flow Outline
Mark-winning sequence for a scatter-diagram interpretation or regression-line evaluation.
Worked Examples
3 worked examples — open one to explore the question and available guidance.
Practice Questions
Try the question, then reveal an answer plan or example response
A class 50 ≤ x < 65 on a histogram has frequency density 2.4. Calculate its frequency.
Hint: Find the class width before multiplying by the density.
A distribution of household incomes has a long tail towards large values. State the skewness and suggest the more representative average, giving a reason.
Hint: Think about which average is pulled most by unusually large values.
A scatter diagram for outdoor temperature and hot-drink sales shows a strong negative linear association. Explain why this does not prove that temperature causes the change in sales.
Hint: Give the association, then identify a possible confounding factor or a limitation of observational data.
For n = 10 observations, Σx = 240 and Σx² = 5940. Calculate the mean and standard deviation, then interpret the standard deviation of 4.90 in context.
Hint: Find x̄ first, then use s = √(Σx²/n − x̄²).
A survey includes an age recorded as 250 and has blank values for 8% of respondents' journey times. Evaluate two appropriate data-cleaning actions and one limitation.
Hint: Treat the apparent error and missing data separately, then explain how a cleaning choice might affect the conclusion.
Exam technique
How to turn what you know into marks
How to approach the question
Underline the variables and units, identify the display type, then decide whether the question is asking for a calculation, a description, an explanation or an evaluation. Use the data first, then add a context-specific conclusion and one relevant limitation where the command word requires it.
How to structure your answer
For 1–2 marks, give a direct statistic or two clear contextual features. For 3–4 marks, show the relationship or formula, calculate, then interpret. For 5–6 marks, organise the answer as feature or method, evidence, context, limitation and justified conclusion.
Timing
AQA A-Level papers are 120 minutes for 100 marks, so allow about 1.2 minutes per mark overall. A 6-mark interpretation should usually take about 7 minutes, including reading, calculation and a final contextual check.
Common pitfalls
- Treating histogram height as frequency when class widths are unequal. Avoid it by writing frequency = density × class width before calculating.
- Writing a causal claim from a correlation. Avoid it by naming one plausible third variable or stating why the study design cannot establish cause.
- Using (Σx)² where the question gives Σx². Avoid it by saying “square each value, then add” before substitution.
- Deleting a possible outlier automatically. Avoid it by investigating source, units, group membership and influence on the conclusion.
- Using a regression line beyond observed data. Avoid it by checking whether the requested x-value lies inside the plotted range.
What the command words want
- Compare
- Give a similarity and a difference where relevant, using numerical evidence rather than a visual impression only.
- Explain
- Use “because” to link a data feature to its mathematical consequence or limitation.
- Describe
- Report separate visible features using mathematical language and the actual variables, for example direction, strength, cluster or skew.
- Evaluate
- Give a relevant strength, a relevant limitation and a justified conclusion. In data questions, qualify causation, sampling or data quality.
- Calculate
- Show the formula or a clear substitution, retain calculator precision, and give the final value with units or an appropriate accuracy.
- State/Give
- Supply the requested statistic, label or conclusion directly. Do not add an unsupported explanation.
Watch or listen (optional)
Test your understanding of L: Data presentation and interpretation
Active recall beats re-reading. Take an instant quiz now to test what you’ve learned and lock it into long-term memory.
7 days Premium · Then the free plan continues · No card, no charge