AQA · GCSE · Mathematics
Course version: 8300 · Version from Sept 2015
Graphs
Turn a pair of numbers into a precise location and secure straightforward graph marks. Learn to read and plot points in all four quadrants, handle negative signs and zeros, and use coordinates in shape problems with examiner-style worked examples and a ten-minute revision podcast.
- 13 min read
- 3 worked examples
- 6 practice questions
- 4 key terms
Try the lesson
The start of the Graphs lesson, made from checked teaching notes for this specification point.
Have a go first
A point P has coordinates (−4, 3). In which quadrant of the coordinate grid does P lie?
Listen
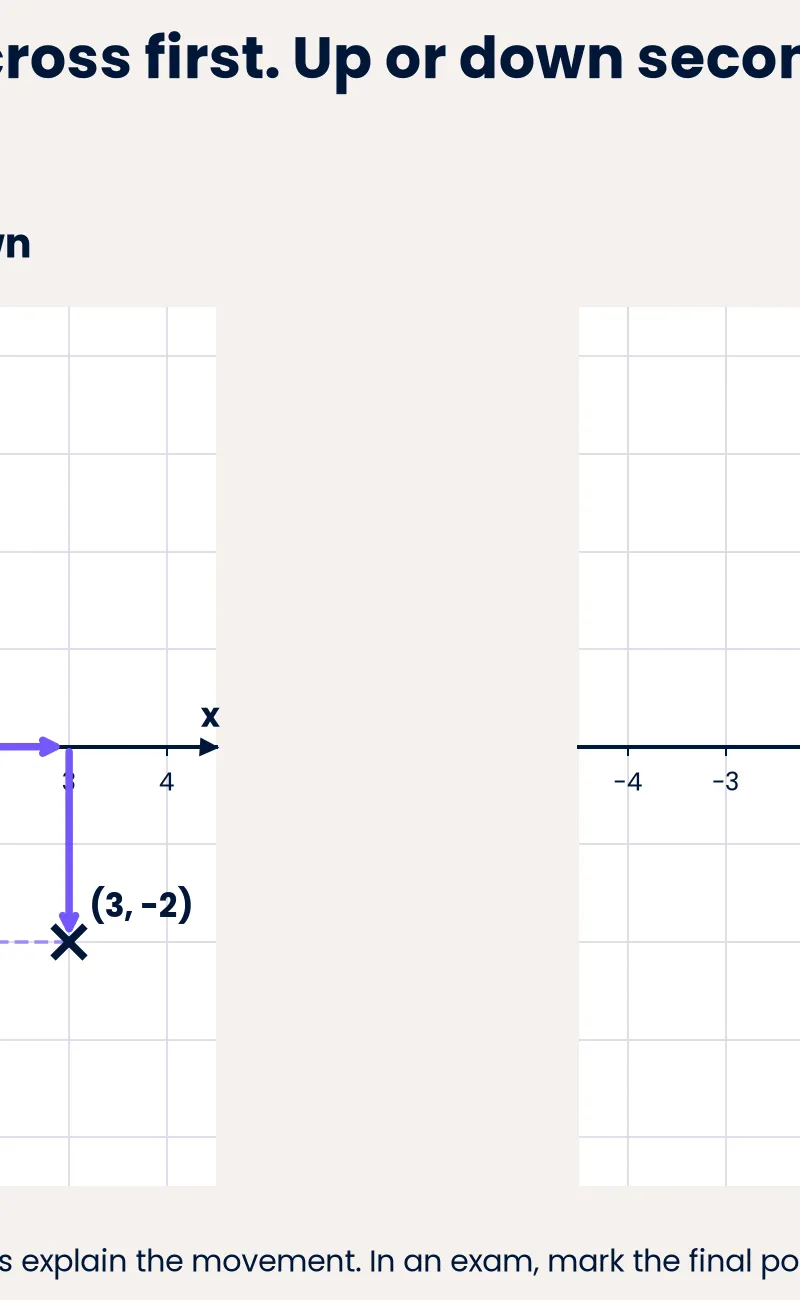
Coordinates locate a point using an ordered pair (x, y). The x-coordinate gives horizontal position from the origin: positive values lie to the right, negative values to the left. The y-coordinate gives vertical position: positive values lie above the origin, negative values below. The axes divide the plane into four quadrants. In the first quadrant both coordinates are positive; in the second x is negative and y is positive; in the third both are negative; in the fourth x is positive and y is negative. To plot (3, −2), move 3 units right from the origin, then 2 units down. To read a point, trace vertically to the x-axis for the first value and horizontally to the y-axis for the second. Reversing the order changes the point, so (3, −2) and (−2, 3) are different. Points on an axis have one coordinate equal to zero.
Key words
Say what each word means before you turn the card.
ordered pair
Try answering aloud or in your head before turning the card.
x-coordinate
Try answering aloud or in your head before turning the card.
y-coordinate
Try answering aloud or in your head before turning the card.
quadrants
Try answering aloud or in your head before turning the card.
See every definition
- ordered pair
- Coordinates locate a point using an ordered pair (x, y), and reversing the order changes the point.
- x-coordinate
- Gives horizontal position from the origin: positive values lie to the right, negative values to the left.
- y-coordinate
- Gives vertical position: positive values lie above the origin, negative values below.
- quadrants
- The axes divide the plane into four quadrants, in which the signs of both coordinates follow set patterns.
There is more to this lesson
The full lesson goes on to check your understanding and help you earn the marks. Create a free account to carry on, with your progress saved.
7 days Premium · Then the free plan continues · No card, no charge
Study Notes
Overview
A coordinate pair is a precise address for a point: the first number locates it horizontally, and the second locates it vertically. This guide develops AQA GCSE Mathematics 3.2.2 Graphs, A8: work with coordinates in all four quadrants. A8 is basic Foundation content and is also assessed at Higher tier. The wider Graphs section includes other objectives, but this resource focuses on the coordinate objective supplied in the brief. 1
Candidates must read and plot positive, negative and zero coordinates, interpret the scale, and use coordinates to describe positions accurately. Typical questions ask you to write down a point's coordinates, plot labelled points, correct a reversed pair, or find a missing vertex using a shape's properties. These skills also underpin straight-line graphs, transformations and coordinate geometry.
The central habit is simple: across first, up or down second. Understanding the two axes makes the method reliable even when scales change or a point lies on an axis. The worked examples and practice questions here are original AQA-style tasks. Their stated mark allocations are illustrative teaching schemes, not reproduced AQA questions or guaranteed live marking rules.
Key Concepts
1. The coordinate plane and the origin
The coordinate plane is formed by two perpendicular number lines. The x-axis is horizontal; the y-axis is vertical. They meet at the origin, whose coordinates are (0, 0). Positive x-values lie to the right of the origin, while negative x-values lie to the left. Positive y-values lie above it, while negative y-values lie below it.
Each axis measures a different component of position. Knowing only x = 3 tells you that a point is three units to the right, but it could be at many different heights. Knowing y as well selects one exact point. Think of an address with both a street and a house number: one piece of information alone may not identify the destination. The analogy is only a memory aid; coordinates are numerical positions measured from an origin.
Cover and recall: sketch the two axes without looking. Label x, y and the origin, then mark the positive direction on each axis. Check that the horizontal axis has not accidentally become y.
2. Ordered pairs: why the order matters
Write a point as (x, y), with brackets and a comma. The order is a mathematical convention, not a choice you make in each question. For (3, −2), x = 3 and y = −2. This means three units right and two units down.
Reversing the entries gives (−2, 3), which means two units left and three units up. These points lie in different regions. A candidate who correctly reads both numbers but reverses them has given the wrong point.
There is an important exception: reversing (2, 2) changes nothing because the entries are equal. Therefore, say that reversal generally changes the point, rather than claiming that it always does. This is useful when an explain question asks you to test a statement.
Why does this work? The two perpendicular measurements are independent. Keeping their order fixed tells the reader which number belongs to which axis.
3. Plotting coordinates accurately
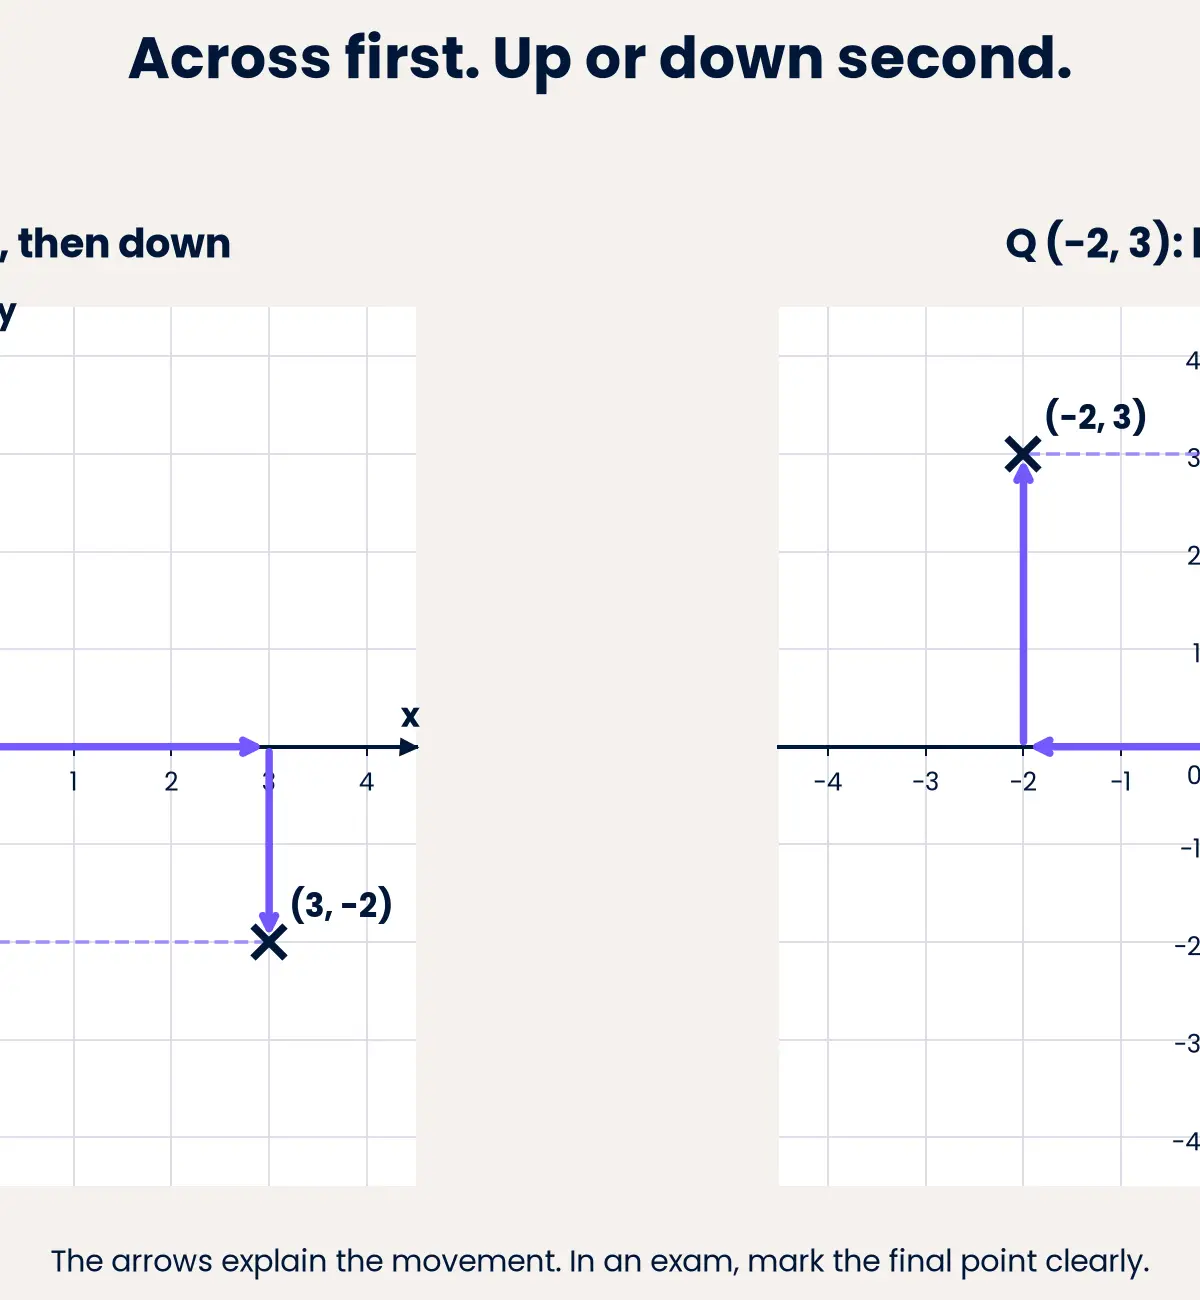
To plot P(3, −2), locate the origin, use the horizontal scale to find x = 3, then use the vertical scale to find y = −2. Mark their intersection with a small, clear cross and label it P if requested. You can imagine moving right and then down, but the exam answer is the final point, not a drawing of your journey.
For Q(−4, 3), move four units left and three units up. For R(−3, −2), move three units left and two units down. Read each negative sign separately: a negative x does not mean that y must also be negative.
A point may fall between numbered grid lines. For example, (1.5, −0.5) is perfectly valid. Use the axis labels to find the correct fractional position rather than rounding to the nearest integer.
Examiner focus: when instructed to plot, candidates must place the point on the grid. Writing the coordinate pair in an answer space does not replace that action. Do not join separate points unless the question requests a line, graph or shape.
4. Reading coordinates from a diagram
Read the x-coordinate by tracing vertically from the point to the horizontal axis. Read the y-coordinate by tracing horizontally to the vertical axis. Then write the ordered pair with x first. Although the first tracing movement is vertical, it gives the horizontal-axis reading. This distinction prevents a common confusion.
Suppose a point is four units left of the origin and two units above it. Its coordinates are (−4, 2). Check by plotting that pair mentally: left four, up two returns you to the original point.
Do not measure from the left or bottom edge of the picture. Those edges are not necessarily zero. If an axis has an unusual orientation in a contextual diagram, follow its actual labels and scale rather than assuming the picture follows a familiar layout.
Cover and recall: a point is two units right and five units below the origin. Write its coordinates before checking. The answer is (2, −5).
5. The four quadrants
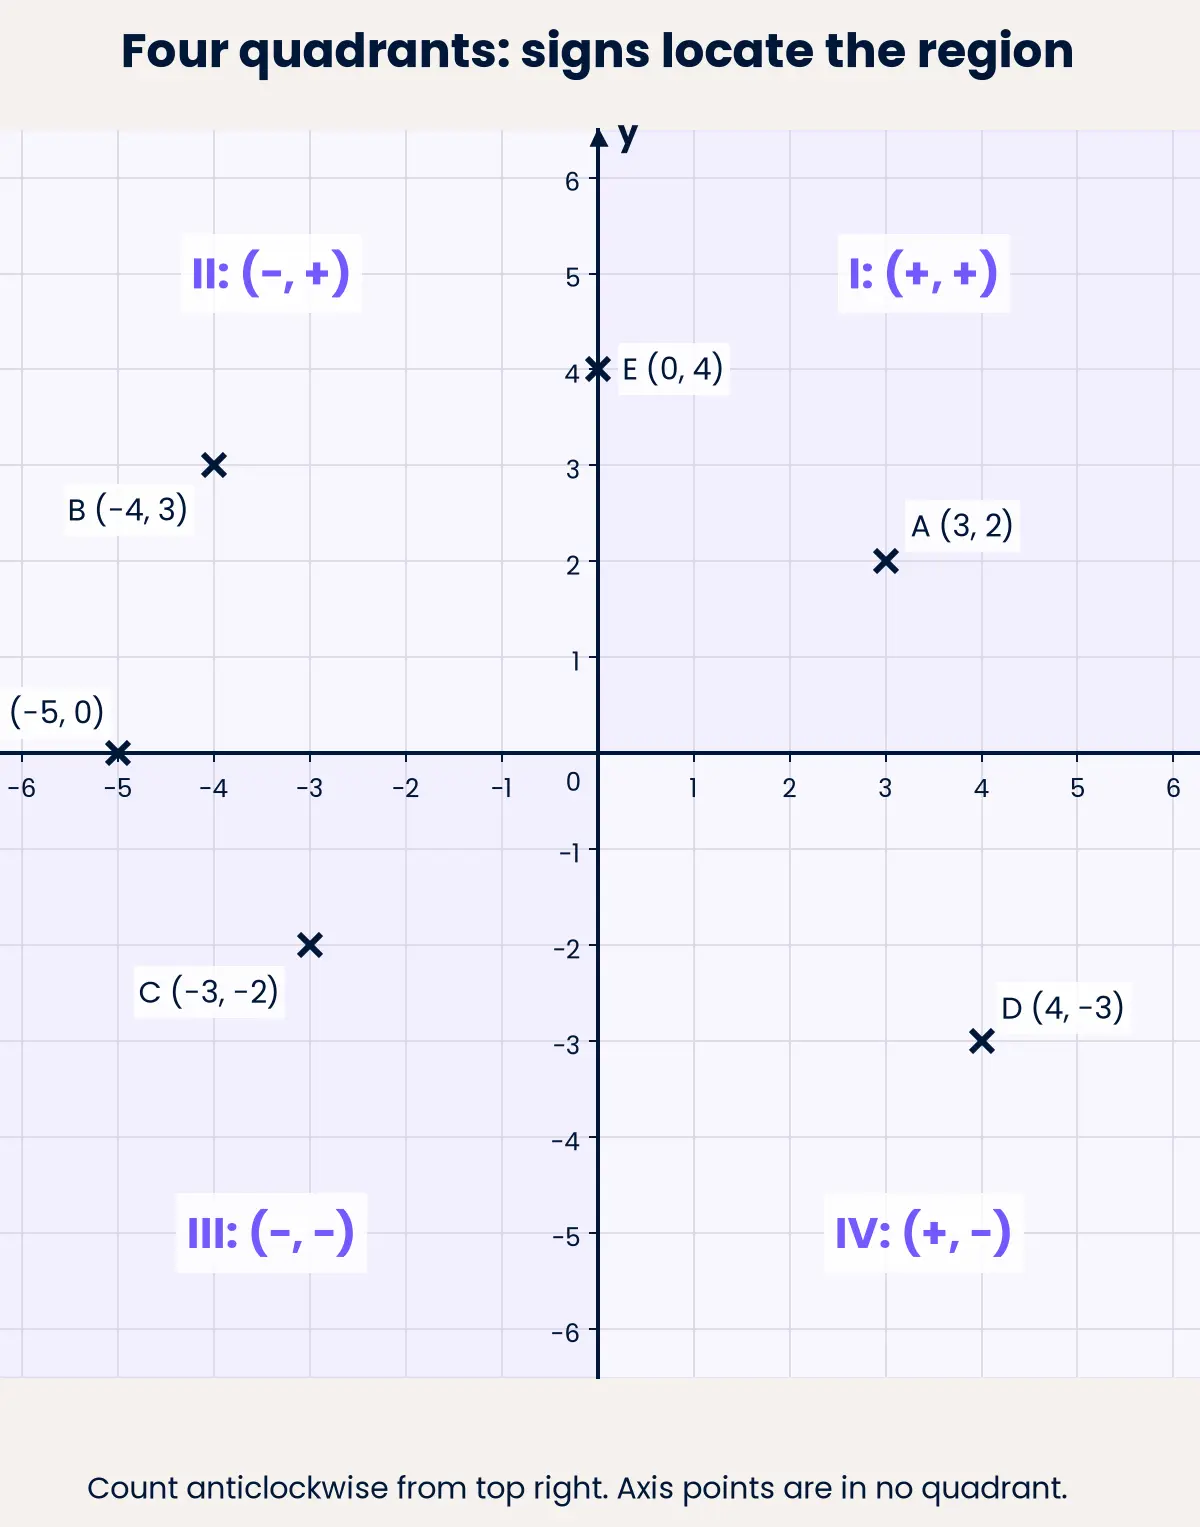
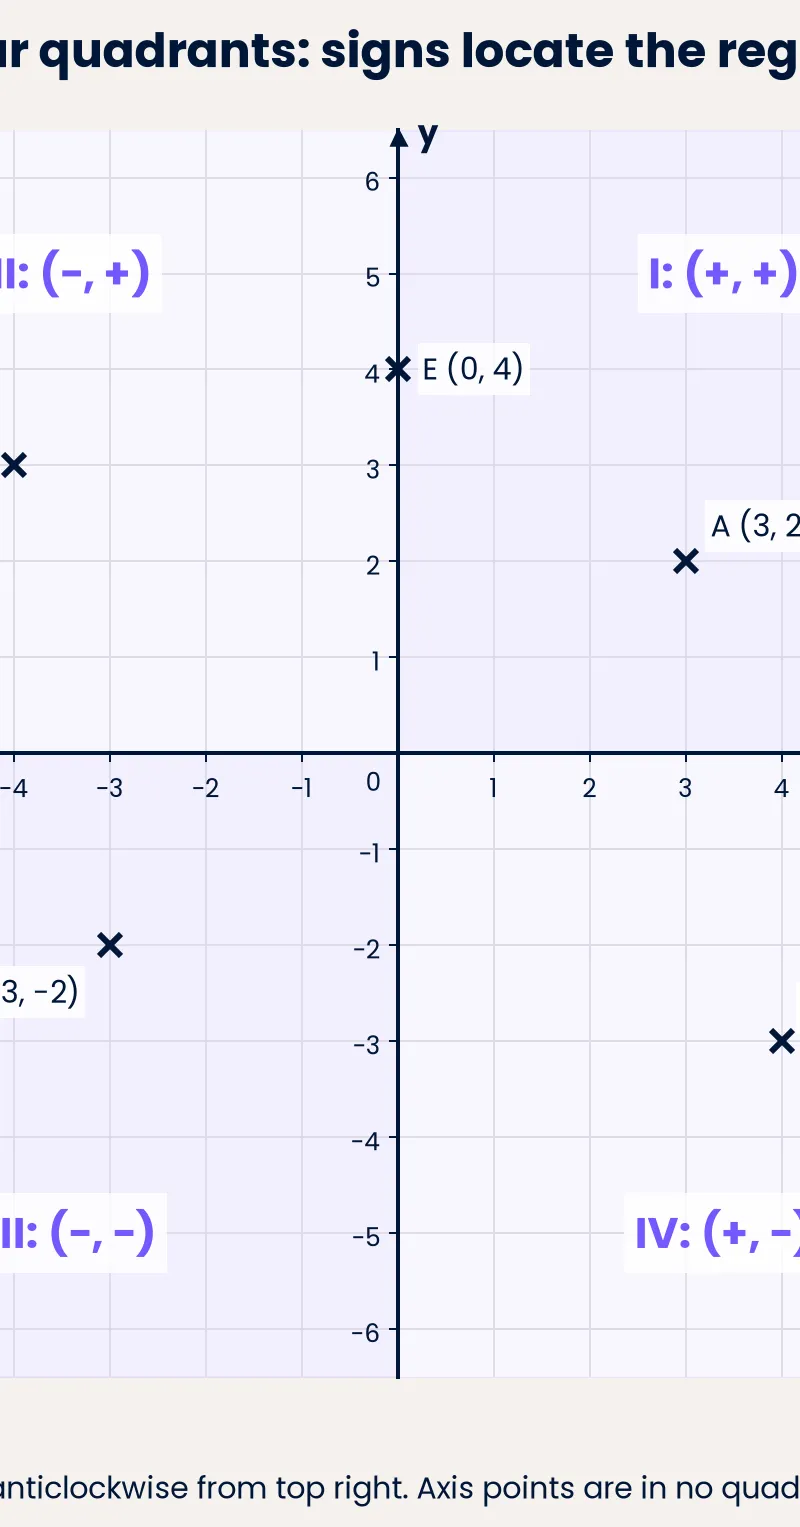
The axes divide the plane into four regions called quadrants. Number them anticlockwise, starting in the top-right region. Quadrant I has x > 0 and y > 0. Quadrant II has x < 0 and y > 0. Quadrant III has x < 0 and y < 0. Quadrant IV has x > 0 and y < 0.
Use signs as a quick checking tool. (−5, 2) belongs in Quadrant II because it is left of the y-axis and above the x-axis. (4, −3) belongs in Quadrant IV because it is right and below. If your plotted point appears in a different region, recheck its signs and coordinate order.
The words top-left and bottom-right explain location clearly, but use the quadrant number if that is what the question asks for. Remember that the numbering is anticlockwise, not clockwise.
Why question: can a point with two negative coordinates lie in Quadrant II? No. Quadrant II requires a positive y-coordinate, so the point would need to be above the x-axis.
6. Zero coordinates and points on the axes
If y = 0, the point lies on the x-axis. For example, (−5, 0) is five units left with no vertical displacement. If x = 0, the point lies on the y-axis. For example, (0, 4) is four units up with no horizontal displacement.
This often feels backwards: an x-coordinate of zero places you on the y-axis. The reason is straightforward. Having no horizontal displacement means you have not moved away from the vertical axis.
Points on either axis are not inside any quadrant. The origin lies on both axes and is also in no quadrant. Zero is neither positive nor negative, so it does not satisfy a quadrant's strict sign conditions.
Examiner focus: for an explain question, write a reason such as, 'The point lies on the y-axis because its x-coordinate is zero.' Naming the axis alone does not provide the explanation.
7. Scale: count values, not just squares
One small square does not automatically represent one unit. If x increases from 0 to 2 over four equal spaces, each space represents 2 ÷ 4 = 0.5 units. Three spaces right of zero therefore gives x = 1.5. Determine the y-scale separately: it need not match the x-scale.
If y increases from 0 to 3 over six equal spaces, each space also represents 0.5 units. Five spaces below the origin gives y = −2.5. The point three spaces right and five spaces down is (1.5, −2.5).
Count intervals, not the printed grid lines. Between the lines at 0 and 2 there may be four spaces but five boundary lines. Dividing by five would produce the wrong scale.
A decimal is not a unit conversion. It may simply represent part of an axis unit. In contextual graphs, check units explicitly: an x-value of 2 on an hours axis means two hours, not two minutes. Convert only when asked or when a calculation requires consistent units; 1 hour = 60 minutes.
8. Coordinates in shape problems
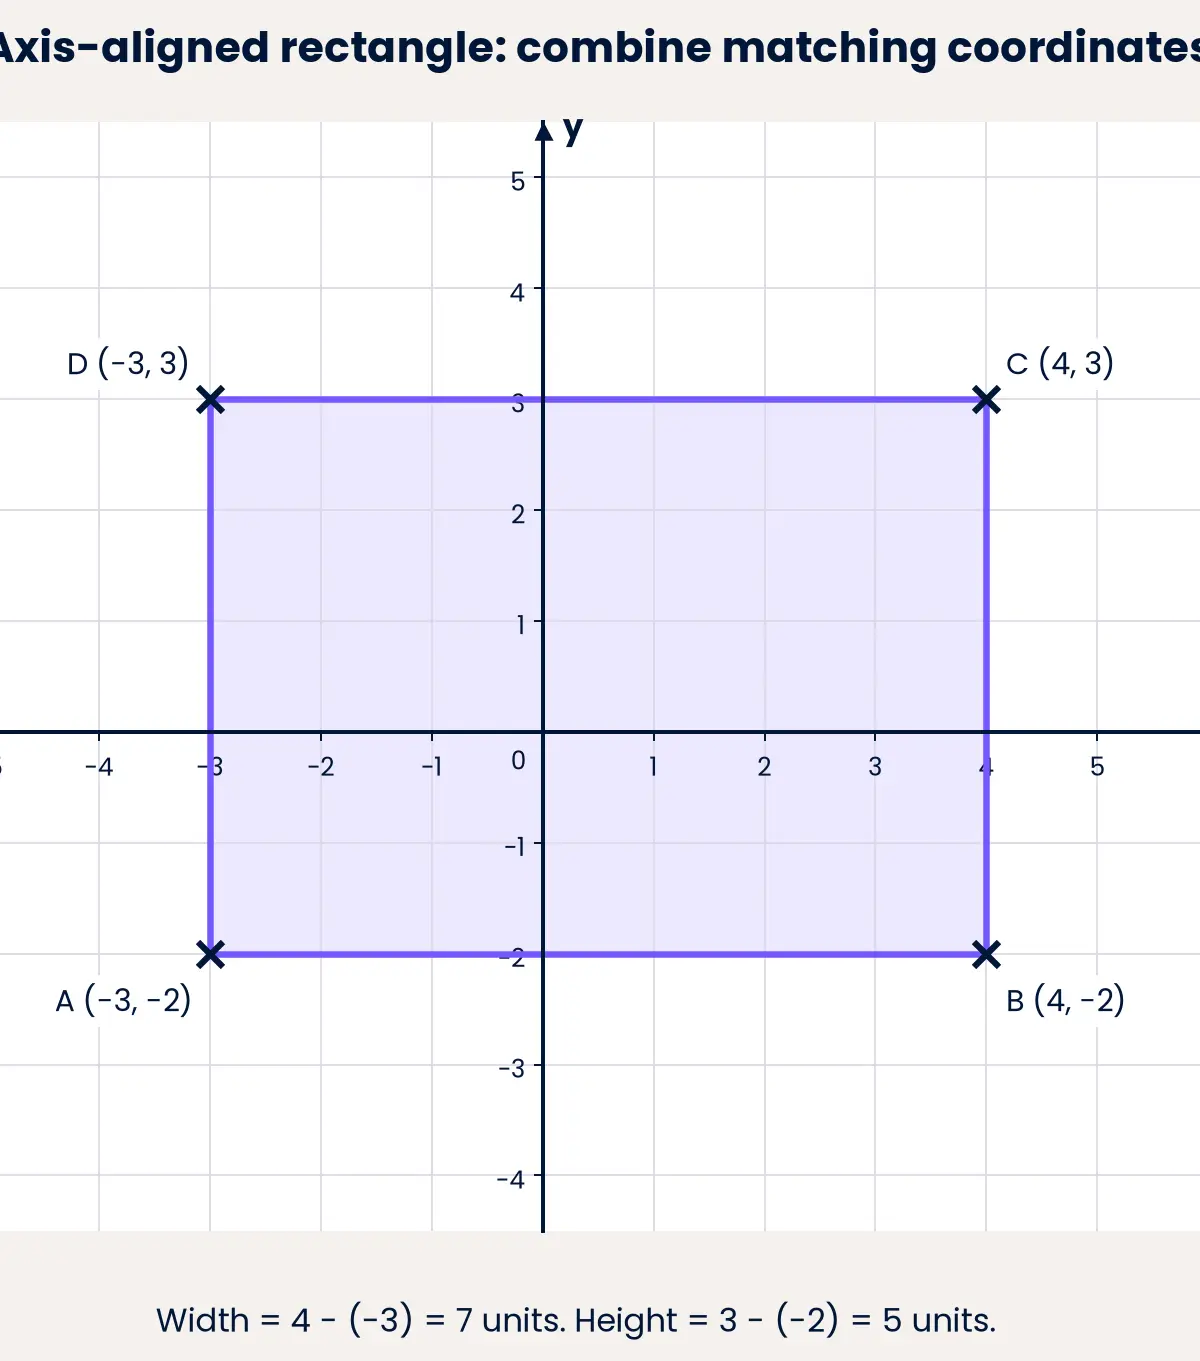
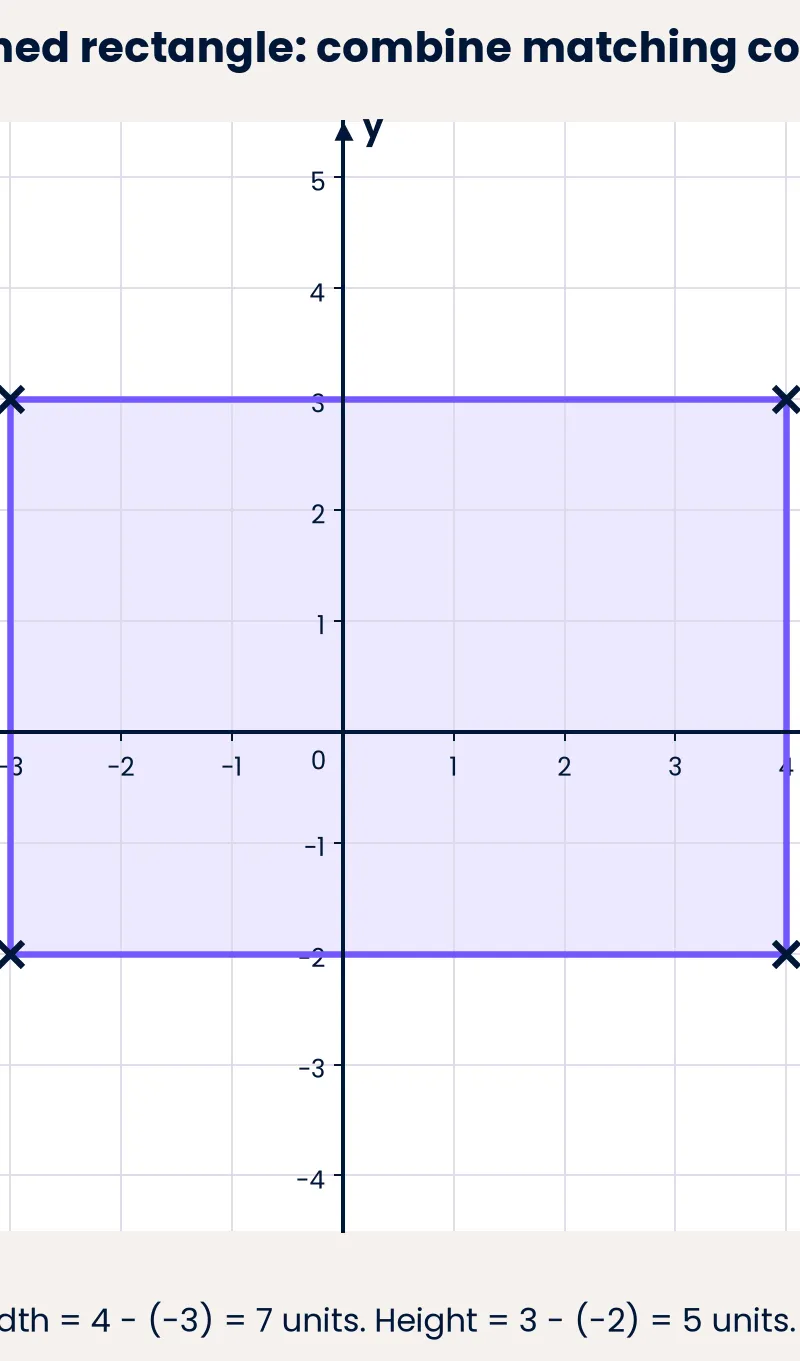
Coordinates can be combined with known geometrical properties. For an axis-aligned rectangle, horizontal sides have constant y-values and vertical sides have constant x-values. With consecutive vertices A(−3, −2), B(4, −2) and C(4, 3), the fourth vertex is D(−3, 3). D shares A's x-coordinate and C's y-coordinate.
The width is 4 − (−3) = 7 units. The height is 3 − (−2) = 5 units. When an interval crosses zero, the negative portion still contributes to its length. Distances are non-negative, even though the endpoint coordinates may be negative.
This matching shortcut depends on the sides being parallel to the axes. Do not apply it automatically to a tilted rectangle. Read the shape information first and support your answer with the relevant property. Merely saying that a point 'looks right' is not mathematical justification.
Mathematical Relationships
Core rules and formulas
Must memorise: the ordered-pair convention is P = (x, y). Here P names the point, x gives horizontal position, and y gives vertical position. This is notation, not a formula supplied for A8.
Must memorise: the origin is O = (0, 0); the x-axis has equation y = 0; the y-axis has equation x = 0. Use these relationships when identifying axis points.
Must memorise: value per equal interval = difference between labelled values ÷ number of intervals. Apply it separately to each axis.
Must memorise: for points on the same horizontal line, horizontal distance = |x₂ − x₁|; for points on the same vertical line, vertical distance = |y₂ − y₁|. The vertical bars mean absolute value: take the non-negative magnitude. These are not general diagonal-distance formulas.
Must memorise: for the axis-aligned rectangle above, D = (x_A, y_C). This is a consequence of the specified consecutive vertices and side alignment, not a universal formula for all rectangles.
Given on formula sheet: no dedicated A8 coordinate rule is required from a formula sheet. Learn the conventions and reasoning instead. This guide does not cover diagonal distance, gradient or midpoint formulas; those belong to linked lessons rather than its core objective.
Tier boundaries
All core coordinate content here is relevant to Foundation and Higher. A9 straight-line graphs and A10 gradients and intercepts are linked objectives, not inherently Higher-only. Higher-only material elsewhere in 3.2.2 includes function transformations A13, non-linear gradient and area interpretation A15, and origin-centred circle equations and tangents A16. Those are outside this A8 guide. 1
Practical Applications
Coordinates describe locations on maps, positions in computer graphics and movements of objects on a screen. Always check the system: a screen may measure vertical positions downwards from a top corner, unlike the standard mathematical plane. The shared idea is an agreed origin, ordered measurements and a defined scale.
There is no required practical for this GCSE Mathematics objective. A useful learning activity is to draw axes from memory, plot one point in every quadrant and one on each axis, and explain each position aloud. Compare your attempt with the diagrams only after finishing. Repeat tomorrow, then again later in the week: retrieve the method rather than merely rereading it.
Exam-Focused Revision Podcast
Use the ten-minute podcast actively. Its structure is introduction 0:00–1:00, core concepts 1:00–6:00, exam tips 6:00–8:00, recall quiz 8:00–9:00, and summary 9:00–10:00. Pause playback if you need more thinking time. Try plotting the spoken examples before checking the answers.
How Credit Is Awarded
AQA's June 2015 updated specimen 8300/1F scheme, Q17(a), gives B2 for the correct straight line and B1 for two correctly plotted points. This illustrates that plotted accuracy can earn credit, but it is a straight-line question with its own scheme, not a universal rule of one mark per point. The glossary identifies B marks as independent of method, M marks as method marks and A marks as accuracy following a method. 3
For this guide's original questions, use the supplied breakdowns. Do not assume that half a correct pair earns a half-mark, or that mentioning a linked topic earns a bonus. Candidates receive credit for the mathematics required by the particular question. AQA assesses routine techniques, reasoning and connected problem solving. 4
Each AQA paper has 80 marks in 90 minutes. Aim for approximately one minute per mark on routine coordinate tasks and use the remaining time for checks. This is advice, not a compulsory time limit. Paper 1 is non-calculator; Papers 2 and 3 permit calculators. Coordinates can be assessed on any of them. 2
References
Visual Resources
4 diagrams and illustrations
Interactive Diagrams
2 interactive diagrams to visualise key concepts
Conceptual Flow Outline
A reliable plotting routine: read, scale, locate x, locate y, mark, check.
Conceptual Flow Outline
Test for zero before assigning a quadrant.
Worked Examples
3 worked examples — open one to explore the question and available guidance.
Practice Questions
Try the question, then reveal an answer plan or example response
Write down the coordinates of each point: A is 4 units left and 3 units up; B is 2 units right and 5 units down; C is on the x-axis 6 units left of the origin. [3 marks]
Hint: Convert directions to signs. A point on the x-axis has y = 0.
State the quadrants of P(−2, 5), Q(−3, −4) and R(6, −1). Then explain why S(0, −3) is not in any quadrant. [4 marks]
Hint: Use the signs of x and y. Treat a zero coordinate separately.
A grid has four equal horizontal spaces between x = 0 and x = 2, and six equal vertical spaces between y = 0 and y = 3. Point T is three spaces right and five spaces below the origin. Calculate the value of one horizontal space and one vertical space, then write down T's coordinates. [3 marks]
Hint: Divide the labelled change by the number of spaces on each axis.
A candidate writes: “U(−5, 0) lies on the y-axis, V(0, 4) lies in Quadrant I, and reversing (−3, −3) gives a different point.” Correct each statement and give a reason. [3 marks]
Hint: Identify which coordinate is zero, then consider whether equal entries change under reversal.
E(−2, −3), F(5, −3) and G(5, 2) are consecutive vertices of an axis-aligned rectangle. Write down the fourth vertex H and calculate EF and FG, showing working. [5 marks]
Hint: H shares E's x-value and G's y-value. Lengths crossing zero include both sides.
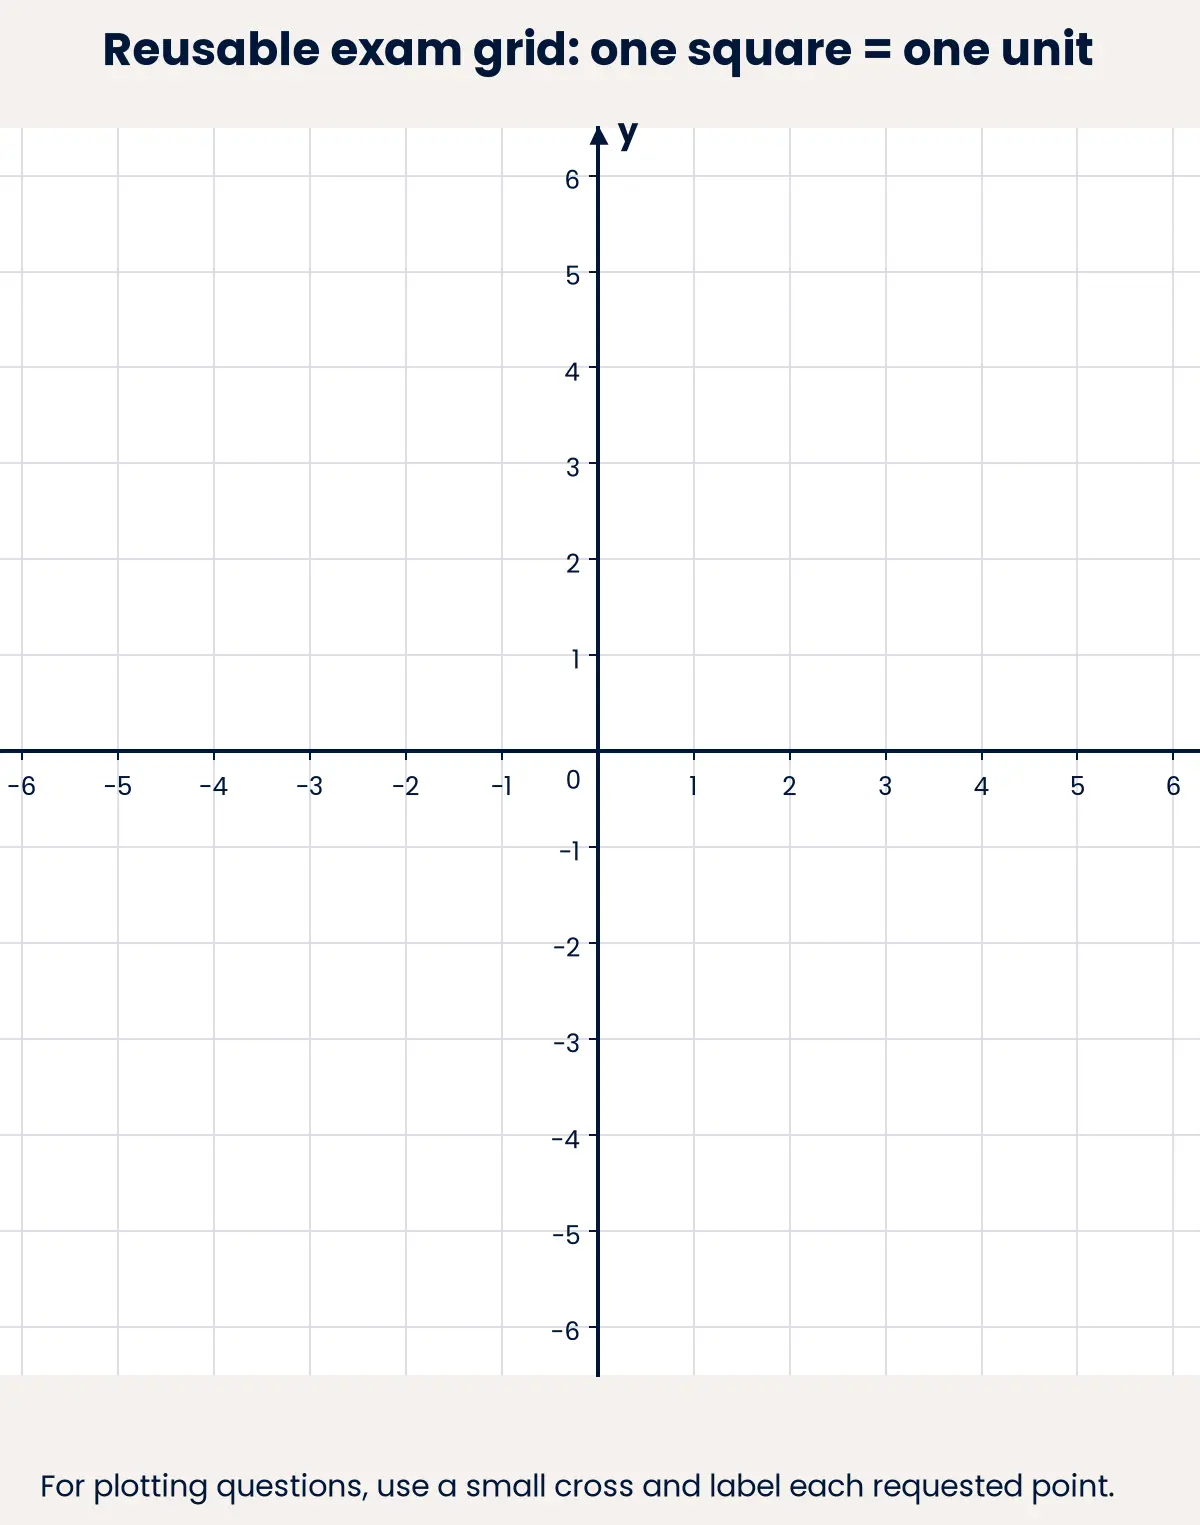
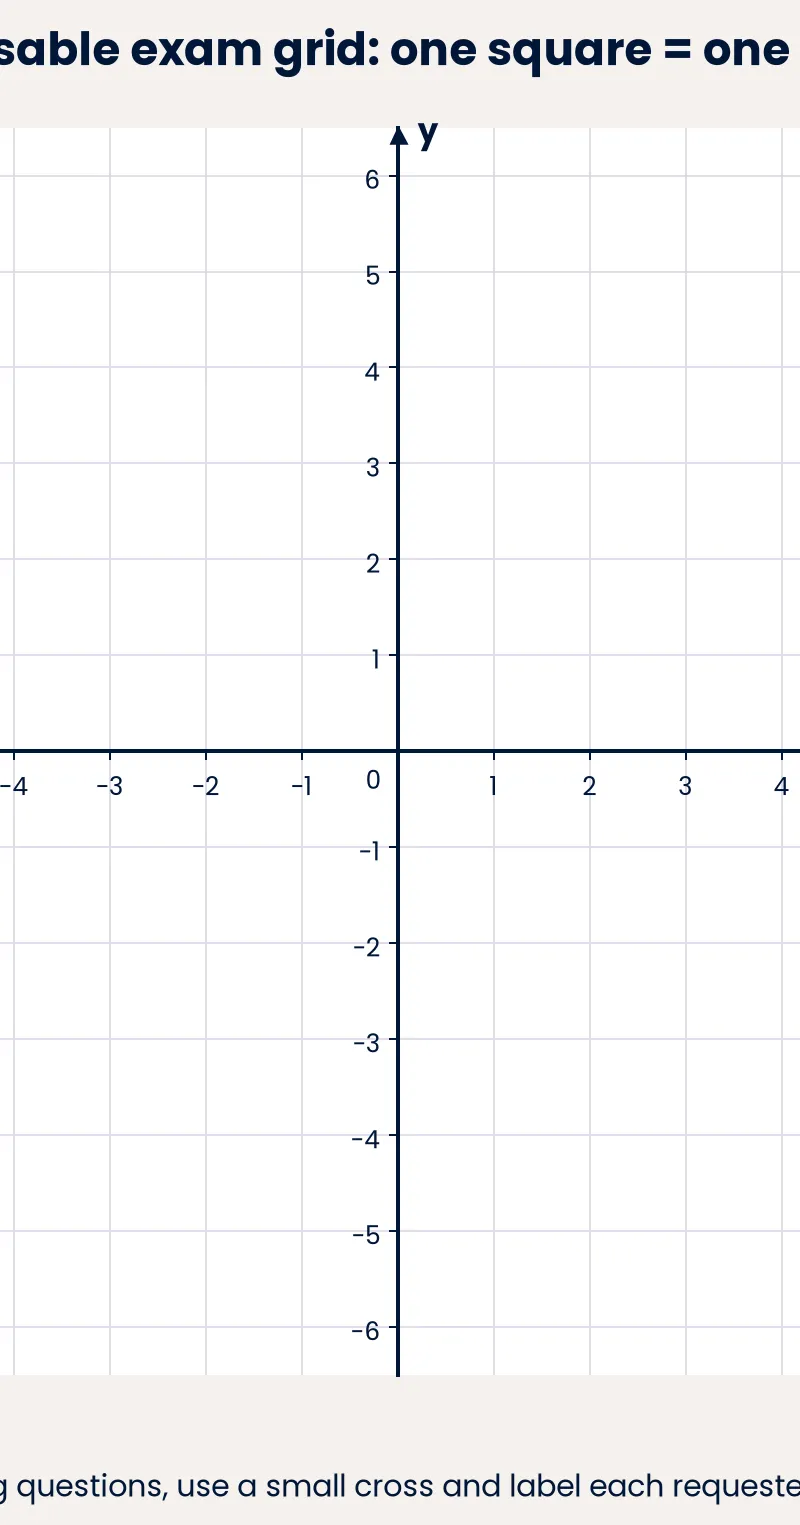
Plot and label A(−2, 4), B(4, 1) and C(0, −2) on the supplied one-unit grid. Do not join the points. [3 marks] {{asset:exam_grid.png}}
Hint: Locate x first, then y. C has no horizontal displacement.
Exam technique
How to turn what you know into marks
How to approach the question
Identify the command word, count the requested responses, locate the origin and inspect both scales. Separate x from y, interpret each sign, and predict the quadrant or axis before plotting. For shape questions, establish the relevant geometrical property before combining coordinates.
How to structure your answer
For a 1-mark write-down task, give one complete ordered pair. For a 3-mark plot task with three points, place and label three clear crosses. For explanation, give the conclusion plus a mathematical reason. For 2-mark distance calculations, show the endpoint difference and state the non-negative length. Follow the actual allocation rather than assuming one mark per written step.
Timing
Practical target: about 1 minute per mark on routine coordinate tasks, so around 3 minutes for 3 marks or 6 minutes for a 6-mark composite question. AQA papers have 90 minutes for 80 marks, a raw average of 1.125 minutes per mark. The difference provides checking time; it is not an official per-question limit.
Common pitfalls
- Reversing the entries: write x first, then y.
- Reversing a negative direction: negative x goes left; negative y goes down.
- Counting quadrants clockwise: start top right and count anticlockwise.
- Putting an axis point in a quadrant: if either coordinate is zero, it lies on a boundary.
- Assuming one square equals one unit: read each axis scale separately and count intervals.
- Giving coordinates instead of plotting: respond on the grid when instructed to plot.
- Applying matching-coordinate rectangle shortcuts to tilted shapes: check axis alignment first.
What the command words want
- Plot
- Mark the requested position on the supplied grid, using a small clear cross. Add labels if requested; do not join unrelated points.
- Compare
- Make a specific mathematical comparison, such as the same x-coordinate but different y-coordinates. Include only similarities or differences relevant to the task.
- Explain
- Give the answer and a mathematical reason, for example: it lies on the y-axis because x = 0.
- Describe
- Describe the mathematical movement or position using direction and magnitude, with any representation the question requests.
- Evaluate
- For a numerical expression, calculate its value. For a statement or method, assess it using mathematical evidence. Do not treat this as a generic essay instruction.
- Calculate
- Show useful arithmetic, such as 4 − (−3) = 7. Give length units when appropriate; coordinate pairs are positions, not lengths.
- Show that
- Provide a clear chain of mathematical reasoning leading to the stated result. Repeating the result alone does not show it.
- State/Give
- Provide exactly the requested result, such as Quadrant II or (−4, 3). A coordinate answer needs both entries, not just a word.
- Write down
- Read or deduce the requested pair and state it directly, with x first. Do not add an unnecessary essay.
Test your understanding of Graphs
Active recall beats re-reading. Take an instant quiz now to test what you’ve learned and lock it into long-term memory.
7 days Premium · Then the free plan continues · No card, no charge