AQA · GCSE · Mathematics
Course version: 8300 · Version from Sept 2015
Graphs: calculate or estimate gradients of graphs and areas under graphs (including quadratic and other non- linear graphs), and interpret results in cases such as distance-time graphs, velocity-time graphs and graphs in financial contexts (Higher tier only)
Turn a graph into a rate of change or an accumulated total, then explain exactly what your answer means. Master tangents, trapezia and motion or financial interpretations to tackle AQA Higher-tier multi-step questions confidently. Download the [complete JSON study guide](/home/ubuntu/graph_study_guide/aqa_gcse_graphs_study_guide.json).
- 14 min read
- 5 worked examples
- 6 practice questions
- 3 key terms
Try the lesson
The start of the Graphs: calculate or estimate gradients of graphs and areas under graphs (including quadratic and other non- linear graphs), and interpret results in cases such as distance-time graphs, velocity-time graphs and graphs in financial contexts (Higher tier only) lesson, made from checked teaching notes for this specification point.
Have a go first
A car travels along a straight road. Its distance-time graph is a straight line passing through the points (0, 0) and (4, 60), where distance is in metres and time is in seconds. Work out the gradient of the graph and state what it represents.
Listen
This Higher tier skill has two halves. To calculate a gradient, pick two points on the graph, form the right-angled triangle between them and divide the change in y by the change in x; for a curve this gives the gradient of the chord, and estimating the gradient at one point means drawing a tangent there and reading its slope. To estimate an area under a graph, split the region into strips, often trapezia, and add their areas; more, narrower strips improve the estimate. Interpretation matters: on a distance-time graph the gradient is speed, on a velocity-time graph the gradient is acceleration and the area under it is distance travelled, and in financial contexts a gradient can be a rate of change such as cost per unit while an area can represent total accumulated value.
Key words
Say what each word means before you turn the card.
Gradient as a rate of change
Try answering aloud or in your head before turning the card.
Area under a graph as an accumulated total
Try answering aloud or in your head before turning the card.
Tangent and chord methods for curves
Try answering aloud or in your head before turning the card.
See every definition
- Gradient as a rate of change
- Found by dividing the change in y by the change in x, and in financial contexts can be a rate of change such as cost per unit.
- Area under a graph as an accumulated total
- Estimated by splitting the region into strips, often trapezia, and adding their areas, and in financial contexts can represent total accumulated value.
- Tangent and chord methods for curves
- A chord gives the gradient between two points on a curve, while a tangent drawn at one point is used to estimate the gradient there.
There is more to this lesson
The full lesson goes on to check your understanding and help you earn the marks. Create a free account to carry on, with your progress saved.
7 days Premium · Then the free plan continues · No card, no charge
Study Notes

Overview
A graph can answer two different questions: how quickly is something changing, and how much has accumulated? Gradient answers the first; area answers the second. AQA GCSE Mathematics 8300 places estimating gradients and areas for non-linear graphs in 3.2.2 Graphs, A15, Higher tier only. Straight-line gradients are prerequisite knowledge from A9 and A10, rather than exclusively Higher content. 1
Candidates may calculate a slope, draw a tangent to a curve, estimate an area using trapezia, or explain a result in a motion or financial context. Questions can combine several skills: reading scales, using geometry, converting units and giving a justified conclusion. This topic connects algebra with rates of change and mensuration. It also explains why speed is not simply the height of a distance-time graph.
Your central rule is slope tells a rate; area tells a total, but the axes decide which rate or total. Practise identifying those quantities before calculating. Work through the examples, cover each solution, then reproduce the method. All questions and mark allocations in this guide are original AQA-style teaching examples, not official AQA questions or guaranteed future marking rules.
Key Concepts
1. Read the graph before choosing a method
Identify both axis quantities, their units, the scale and the required interval or point. If a horizontal square represents 2 seconds and a vertical square represents 5 metres, counting squares without converting gives the wrong gradient. Use numerical coordinate differences, not the line's apparent angle. Stretching an axis changes the visual angle without changing the underlying rate.
Plot coordinates in the order (horizontal value, vertical value). For a function, calculate a table of values, choose an even scale, plot accurately and draw the intended shape. A quadratic or other smooth function needs a smooth curve; a stated piecewise-linear graph needs straight segments. Do not join isolated measured data without considering the question's instructions.
Cover and recall: what four things must you check before calculating from a graph? Name the axes, units, scales and requested point or interval.
2. Straight-line gradient and average rate
For points (x₁, y₁) and (x₂, y₂), gradient m = (y₂ − y₁)/(x₂ − x₁). Subtract in the same order in numerator and denominator. A line rising from left to right has positive gradient; a falling line has negative gradient. A horizontal line has zero gradient. A vertical line has undefined gradient because its horizontal change is zero.
Example: a distance-time line passes through (2, 5) and (8, 23), with seconds and metres on the axes. Its gradient is (23 − 5)/(8 − 2) = 18/6 = 3 m/s, so its speed is 3 m/s. The starting distance does not need to be zero: changes, not absolute coordinates, determine the rate.
For a straight line, every suitably chosen pair gives the same gradient. Two points on a curve define a chord. Its gradient measures an average rate across that interval, not generally the instantaneous rate at either endpoint. This distinction often separates a correct calculation from an incorrect method.
3. Estimate a curve's gradient using a tangent
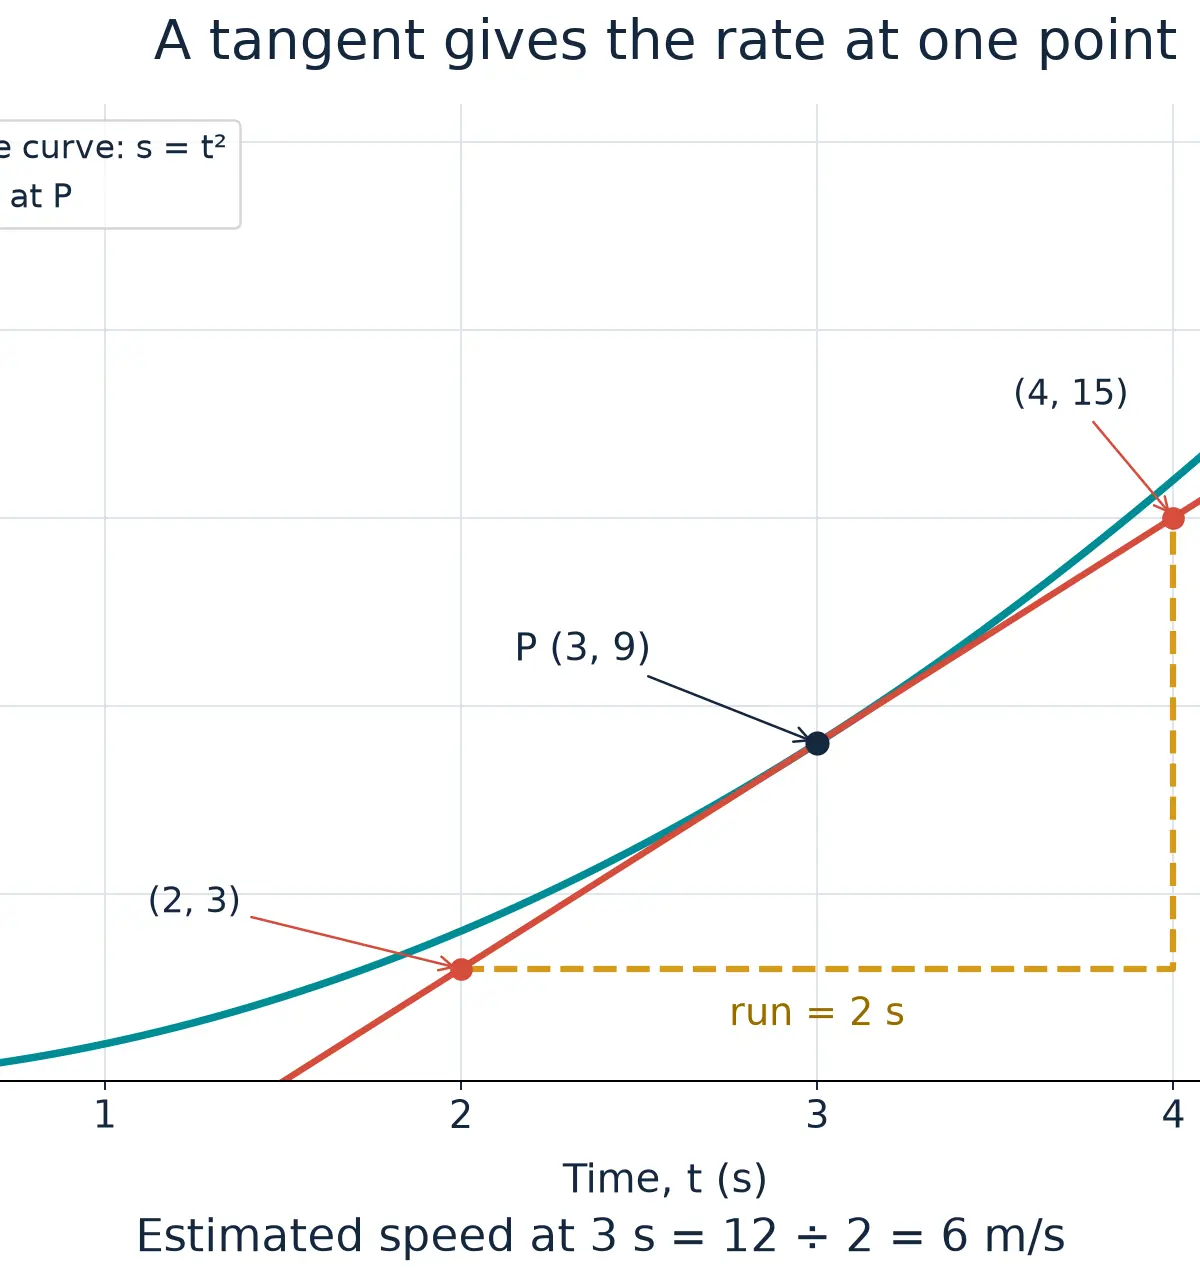
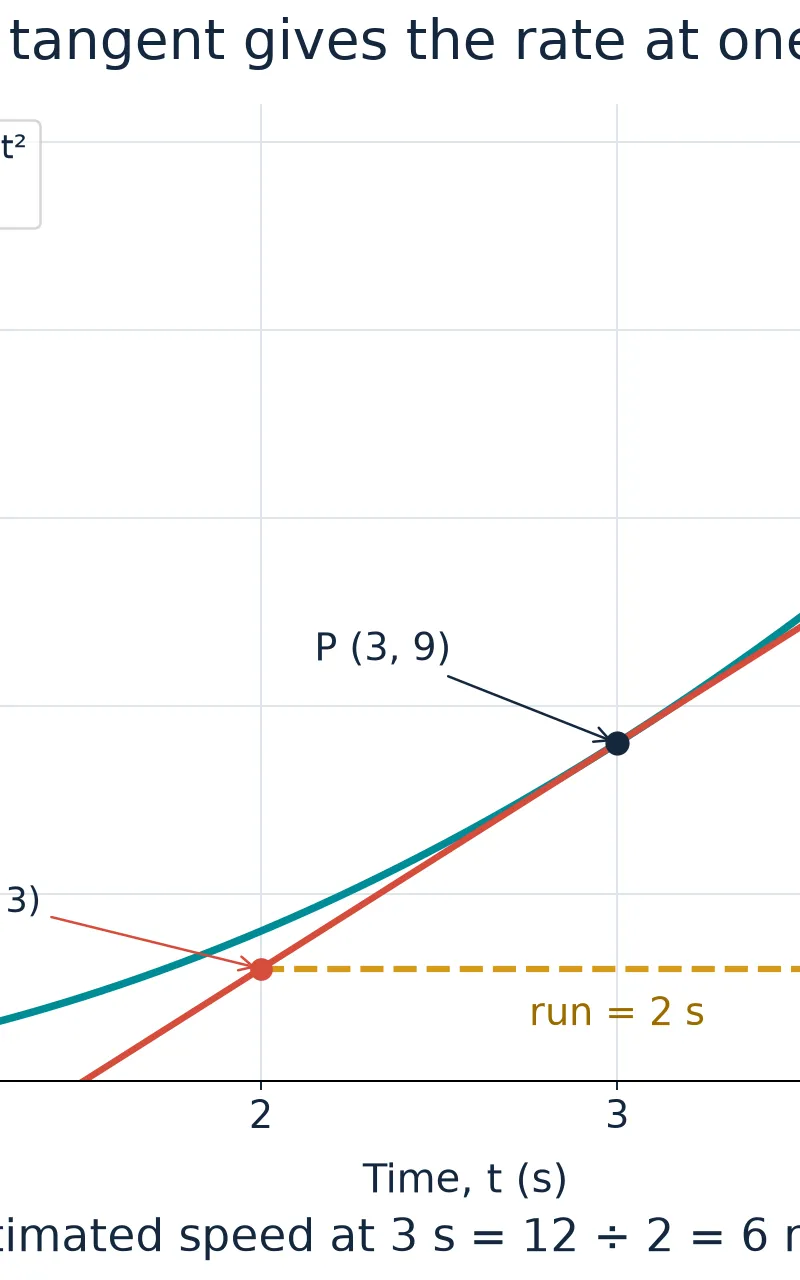
A tangent is a straight line matching the curve's local direction at the requested point. For GCSE work, position a ruler through that point so the line follows the curve's direction nearby, then extend the tangent. Do not assume a tangent can never meet the curve elsewhere.
Choose two well-separated, readable points on the tangent, draw a large gradient triangle, and calculate vertical change divided by horizontal change. The points do not need to lie on the original curve. A large triangle reduces the proportional effect of a small coordinate-reading error. Leave your tangent and triangle visible for the examiner.
Example: at P = (3, 9), the illustrated distance curve has a tangent through (2, 3) and (4, 15). Gradient ≈ (15 − 3)/(4 − 2) = 6 m/s. This estimates speed at 3 seconds. The curve's height, 9 metres, is distance, not speed. At a smooth turning point a horizontal tangent gives gradient zero. Differentiation is not required for this GCSE technique.
4. Interpret motion gradients correctly
On a graph of total distance travelled against time, gradient is speed: a horizontal section means stationary; a steeper rising section means faster. Total distance travelled cannot decrease. If the vertical axis instead represents distance from a fixed point, a falling section can mean returning towards that point; interpret that slope carefully and use its magnitude for speed when appropriate.
On a displacement-time graph, signed gradient is velocity. On a velocity-time graph, gradient is acceleration. A straight segment from 12 m/s at 2 s to 4 m/s at 6 s has acceleration (4 − 12)/(6 − 2) = −2 m/s². Since velocity remains positive, the object slows down.
Negative acceleration does not always mean slowing down. If velocity and acceleration are both negative, the magnitude of velocity increases: the object speeds up in the negative direction. A horizontal velocity-time section means constant velocity, which is stationary only when its height is zero.
Why does this work? Velocity change divided by time change has units (m/s)/s = m/s², exactly the units of acceleration.
5. Exact areas for straight-sided regions
For a constant positive velocity, distance = velocity × time, represented by a rectangle under the graph. For a line increasing from zero velocity, use a triangle. If both endpoint velocities are non-zero, use a trapezium or a rectangle plus a triangle.
Example: velocity increases linearly from 4 m/s to 10 m/s over 3 seconds. Area = ½(4 + 10) × 3 = 21 m. This is exact for the stated straight segment. The parallel sides of the trapezium are the two vertical heights; their perpendicular separation is the horizontal interval. Sloping edge length is not the strip width.
If a boundary is curved, those familiar shapes generally give an approximation rather than an exact area. Match the method to the shape supplied, not to the formula you remember best.
6. Estimate curved areas using trapezia
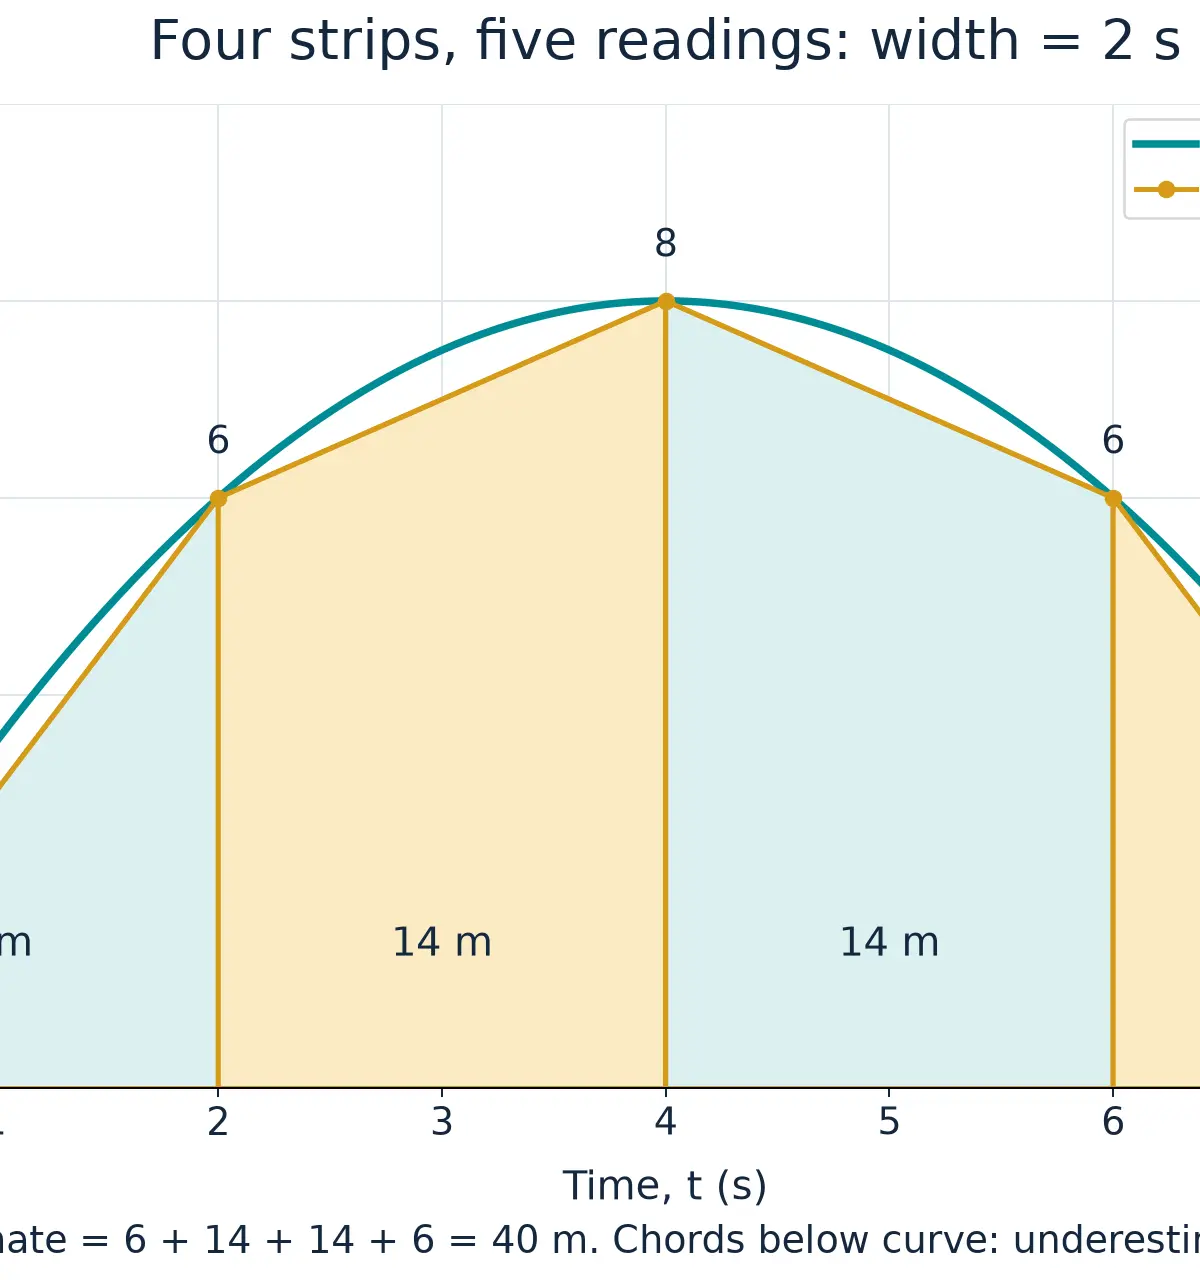
Split the requested interval into strips, read the vertical height at every boundary, join adjacent readings with straight chords, and add the trapezium areas. For n equal strips between x = a and x = b, width h = (b − a)/n. You need n + 1 readings, including both endpoints.
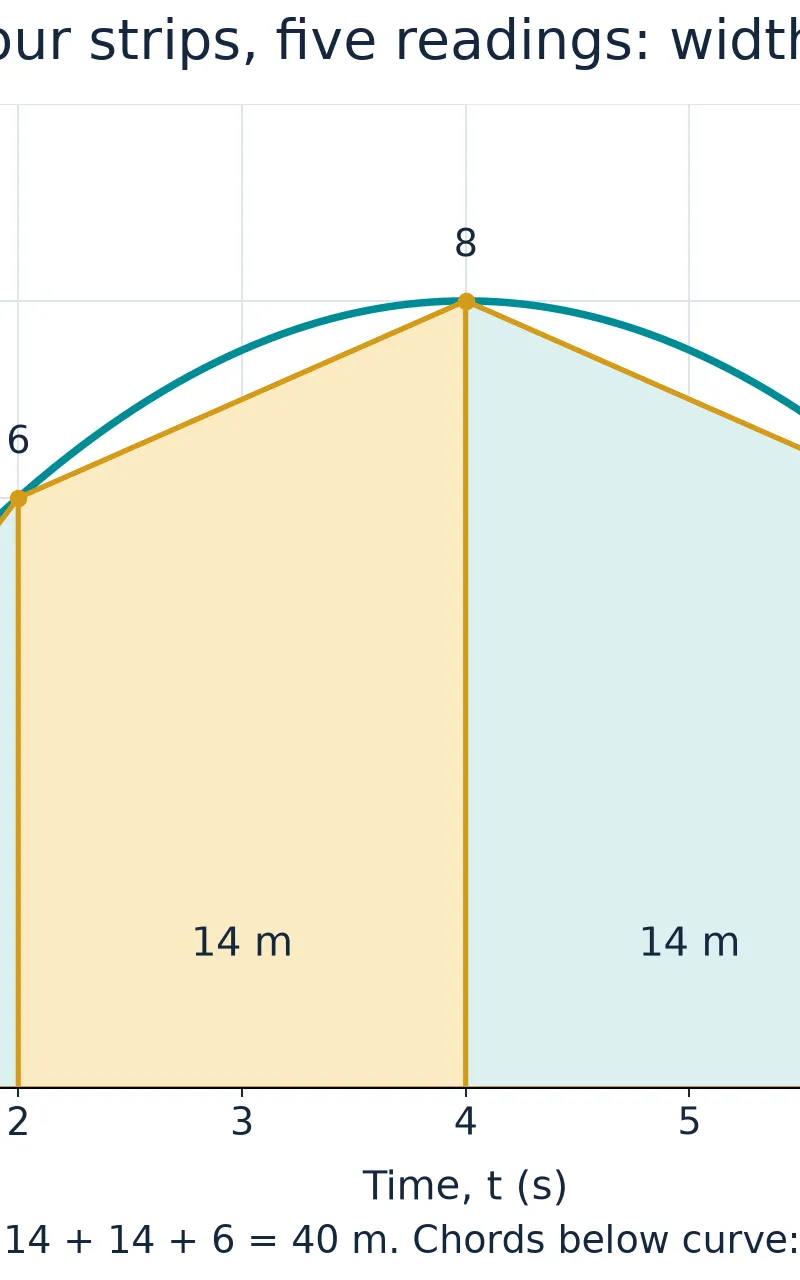
The illustrated readings at t = 0, 2, 4, 6, 8 seconds are v = 0, 6, 8, 6, 0 m/s. Width = 2 seconds. The areas are ½(0 + 6) × 2 = 6 m; ½(6 + 8) × 2 = 14 m; then 14 m and 6 m. Total estimated area = 40 m. With non-negative velocity, this is estimated distance travelled and displacement.
For equal widths, a compact formula is A ≈ h/2 × [y₀ + 2(y₁ + … + yₙ₋₁) + yₙ]. Interior heights occur in two adjacent trapezia, so they are doubled; endpoints occur once. Remember ends once, middles twice. Unequal strips require separate calculations using each actual width. Do not use the equal-strip formula unchanged.
7. Explain overestimates, underestimates and accuracy
Decide whether the straight chord tops lie above or below the curve over the interval. For a curve bending upwards like a cup, chords lie above the curve, giving an overestimate. For a curve bending downwards like a cap, chords lie below it, giving an underestimate, as in the 40 m example.
A rising curve can give either type of error. The relevant feature is bending, not simply increasing or decreasing. If bending changes across the interval, some strip errors may oppose others, so an overall conclusion needs more evidence.
Using more, narrower strips generally improves approximation for a smooth curve with sufficiently accurate readings. It does not repair inaccurate plotting or guarantee improvement for every arbitrary set of noisy data. If a question specifies four strips, use four: a different method may not meet the instruction.
Exam-quality explanation: 'This is an underestimate because the straight chords forming the trapezium tops lie below the curve.' Merely saying 'trapezia are approximate' does not justify the direction of error.
8. Signed area: distance is not always displacement
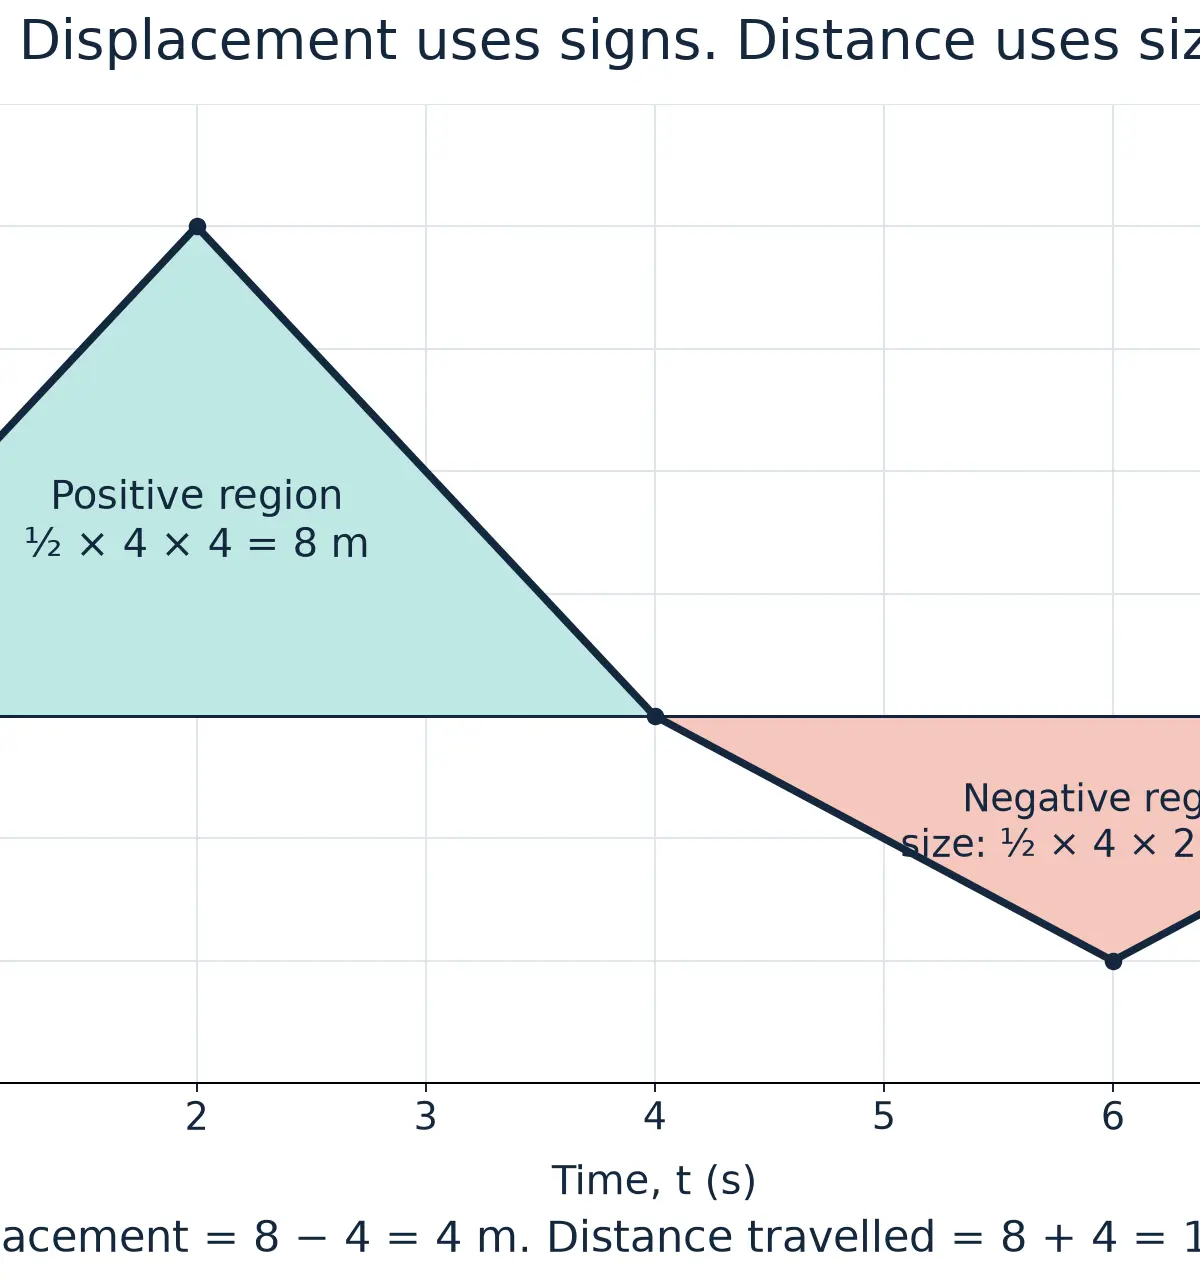
Area under a velocity-time graph represents signed displacement. Positive regions contribute positively; negative regions contribute negatively. To calculate total distance travelled, add the positive sizes of all regions, splitting wherever velocity crosses zero. On a speed-time graph, speed is non-negative, so area gives distance directly.
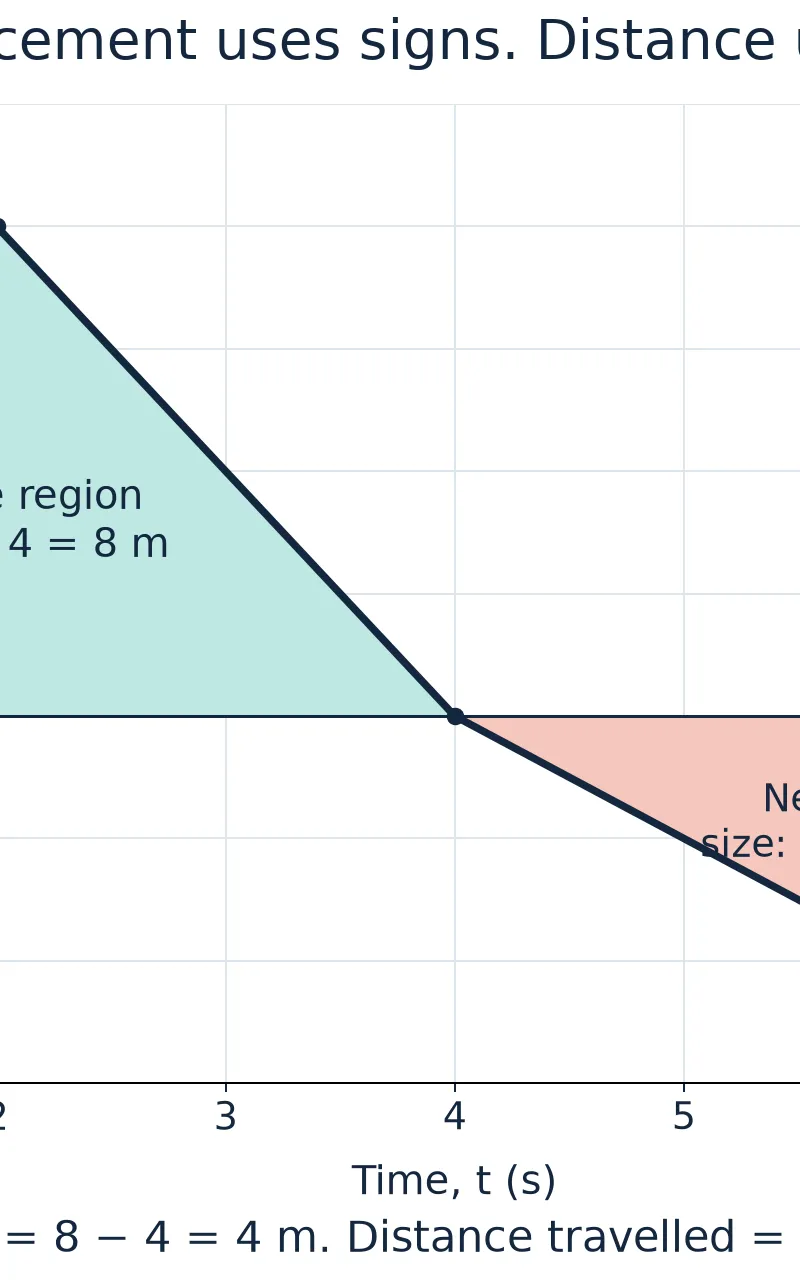
In the illustration, the positive triangle has area ½ × 4 × 4 = 8 m. The negative region has geometric size ½ × 4 × 2 = 4 m. Displacement = 8 − 4 = 4 m in the positive direction. Distance = 8 + 4 = 12 m. The object reverses direction at 4 seconds; zero velocity at a single instant does not mean it was stationary for an interval.
What if? Equal positive and negative areas produce zero final displacement, but the object has still travelled a non-zero distance. Do not let cancellation erase the journey.
9. Financial contexts: inspect the units
If total cost C in pounds is plotted against quantity q, gradient ΔC/Δq gives pounds per item. A straight-line model C = 12 + 3q has a £12 fixed charge and a £3-per-item marginal rate. The intercept is the fixed charge, not the gradient.
If income rate is in £/hour and time is in hours, area estimates accumulated income in pounds. Rates of 20, 30 and 40 £/hour at 0, 2 and 4 hours give trapezia of £50 and £70: £120 in total. For a stated linear rate graph this is exact; for sampled curved data it is an estimate.
A balance-time graph has a different interpretation: gradient is net balance change per unit time, while area has units £·hour, not income. Not every financial area represents money. Apply the unit test: gradient divides axis units; area multiplies axis units.
Mathematical/Scientific Relationships
Formula status below uses AQA's 2027 Higher formula sheet, whose content AQA confirms is unchanged from 2026. 'Must memorise' means not supplied on that sheet, although a particular question may provide a formula. 3 4
Gradient: m = Δy/Δx = (y₂ − y₁)/(x₂ − x₁). Must memorise. Δ means change; use two line points, chord endpoints for an average, or tangent points for an instantaneous estimate. Straight-line equation y = mx + c is Must memorise; c is the vertical intercept.
Motion: average speed = total distance/total time; average velocity = displacement/time; acceleration = Δv/Δt. Each is Must memorise. Rearrangements distance = speed × time and time = distance/speed apply to constant speed or to the appropriately calculated average speed. Gradient of distance-time = speed; gradient of displacement-time = velocity; gradient of velocity-time = acceleration: Must memorise.
Shape areas: rectangle A = bh and triangle A = ½bh are Must memorise, with perpendicular base b and height h. Trapezium A = ½(a + b)h is Given on formula sheet, where a and b are parallel-side lengths and h is their perpendicular separation. On graph strips the two heights replace a and b; the horizontal width replaces h.
Strip calculation: Aᵢ ≈ ½(yᵢ + yᵢ₊₁)(xᵢ₊₁ − xᵢ); equal-strip width h = (b − a)/n; total A ≈ h/2[y₀ + 2(y₁ + … + yₙ₋₁) + yₙ]. Each is Must memorise (or derive from trapezium area); the compact summation formula is not provided and is not essential if you add individual strips.
Accumulation: displacement = positive area − negative-region size; distance = positive area + negative-region size. Income = area under income-rate/time; change in balance per time = financial gradient. These interpretation relationships are Must memorise. General units are gradient = vertical unit/horizontal unit and area = vertical unit × horizontal unit.
Graph and Unit Checks
Use 1 minute = 60 seconds, 1 hour = 3600 seconds, 1 kilometre = 1000 metres, 1 metre = 100 centimetres and £1 = 100 pence. To change m/s to km/h multiply by 3.6; reverse by dividing by 3.6. These conversions are Must memorise, not supplied on the Higher sheet.
If velocity is in m/s but time is in minutes, convert widths to seconds before calculating distance. A 2-minute rectangle at 3 m/s gives 3 × 120 = 360 m, not 6 m. A cost gradient in pence/item must be divided by 100 before being quoted in pounds/item. Keep unrounded readings and calculations until the final answer, then follow any requested precision.
Practical Applications and Exam Use
There is no required practical for this GCSE Mathematics topic. Useful applications include estimating a runner's instantaneous speed, a vehicle's journey distance, or income from a changing sales rate. Cross-topic questions may involve a quadratic graph, a straight-line cost model or a compound unit conversion.
AQA papers each have 80 marks in 90 minutes. Paper 1 is non-calculator; Papers 2 and 3 permit calculators, and this topic can be assessed on any paper. 2 The whole-paper average is 1.125 minutes per mark. As a working strategy, aim for roughly one minute per mark and retain time for checking.
AQA distinguishes method, accuracy and independent marks. For example, June 2023 Higher Paper 2, Q16 awards M1 for each of two gradients and A1 for using them to answer the comparison. 5 A numerical result alone may not complete an explanation or comparison. Your final sentence should answer the command word and identify the contextual quantity.
Listen, Retrieve and Revisit
The ten-minute female-narrated podcast follows introduction 0:00–1:00, core concepts 1:00–6:00, exam tips 6:00–8:00, recall quiz 8:00–9:00 and summary 9:00–10:00. Answer aloud before the quiz answers. After listening, close the guide and redraw the tangent triangle and four trapezia from memory. Revisit uncertain points tomorrow and later in the week rather than simply replaying everything passively.
References
Visual Resources
3 diagrams and illustrations
Interactive Diagrams
2 interactive diagrams to visualise key concepts
Conceptual Flow Outline
Choose the calculation by the requested quantity and graph shape; a curve over an interval can also give an average rate using a chord.
Conceptual Flow Outline
Signed velocity area gives displacement; adding absolute region sizes gives distance.
Worked Examples
5 worked examples — open one to explore the question and available guidance.
Practice Questions
Try the question, then reveal an answer plan or example response
Original AQA-style, 3 marks. Calculate the gradient of a straight line through (−2, −1) and (4, 11). State whether it rises or falls from left to right.
Hint: Use coordinate differences in the same order.
Original AQA-style, 4 marks. A tangent to a velocity-time curve at t = 3 s passes through (1, 4) and (5, 16), with time in seconds and velocity in m/s. Calculate the acceleration at 3 s and explain why the two points must be on the tangent.
Hint: The vertical unit is velocity, so divide a velocity change by a time change.
Original AQA-style, 5 marks. A non-negative curved velocity-time graph has readings (0, 1), (2, 5), (4, 7), (6, 9), in seconds and m/s. Use three equal trapezia to estimate distance travelled. Explain why using more accurately read, narrower strips is generally preferable.
Hint: Three strips need all four readings; width is 2 seconds.
Original AQA-style, 6 marks. Velocity decreases linearly from 6 m/s at t = 0 to −2 m/s at t = 4 s. Find the acceleration, time when velocity is zero, displacement and total distance travelled.
Hint: Locate the zero crossing before adding geometric areas.
Original AQA-style, 4 marks. A curved income-rate graph has readings (0 h, £10/h), (1 h, £14/h), (3 h, £20/h). Estimate income with the two trapezia. State the resulting units and explain why a single equal-width formula is inappropriate.
Hint: The time intervals are 1 hour and 2 hours.
Original AQA-style, 5 marks. (a) A constant velocity of 3 m/s is maintained for 2 minutes. Calculate distance travelled. (b) On a different non-negative graph, a smooth curve bends upwards throughout the requested interval. Explain whether a trapezium estimate is above or below the true area. (c) State how the gradient of a distance-time graph differs from the gradient of a velocity-time graph.
Hint: Convert time first, then distinguish the two vertical-axis quantities.
Exam technique
How to turn what you know into marks
How to approach the question
Identify axes, units and scale. Underline the command word and requested point or interval. Decide between a straight-line gradient, tangent estimate, exact shape area or trapezium estimate. Check signs, show a valid calculation, and finish with the contextual quantity and units. A15 is Higher-only; a practice label of foundation describes difficulty, not exam-tier entitlement.
How to structure your answer
For a short gradient question, show coordinates, differences and the quotient. For a tangent question, retain the drawn tangent and a large triangle. For an area question, show widths, one or more strip calculations and the complete sum. For a 5–6 mark contextual question, add sign handling or a justified conclusion as requested. Mark allocations depend on the question, not a fixed one-mark-per-line template.
Timing
Each AQA paper gives 90 minutes for 80 marks, averaging 1.125 minutes per mark. Aim for roughly 1 minute per mark and keep checking time: about 3–4 minutes for 3 marks and 6–7 minutes for 6 marks. This is a strategy, not an AQA instruction.
Common pitfalls
- Inverting Δy/Δx: use vertical change divided by horizontal change.
- Treating two curve points as an instantaneous rate: draw a tangent at the requested point.
- Using curve height as speed: the height is the vertical-axis quantity, not the gradient.
- Counting five readings as five strips: five readings create four intervals.
- Using a single equal width when intervals differ: calculate each actual width.
- Forgetting endpoint weights: endpoints once, interior heights twice for equal strips.
- Calling signed velocity area distance without checking signs: add region sizes for distance.
- Claiming a rising curve must give an overestimate: compare chords with the curve instead.
- Ignoring minutes versus seconds or pounds versus pence: convert consistently.
- Quoting a universal tolerance or guaranteed follow-through: these are question-specific.
What the command words want
- Draw
- Construct the requested tangent or graph accurately with a ruler where appropriate; a written description does not replace the drawing.
- Compare
- Make an explicit comparison using calculated gradients or areas on compatible scales and units. Address the requested comparison, not unrelated similarities.
- Explain
- Give a reason linked to the claim, for example an underestimate because chord tops lie below the curve.
- Describe
- Identify the relevant feature, such as constant speed or a gradient becoming steeper. Refer to the interval and named quantity.
- Estimate
- Use a graphical or approximate method with sensible readings and precision; show the tangent or strip construction when appropriate.
- Evaluate
- In mathematics this commonly means find the numerical value of an expression. If the question asks about the quality of an estimate, make a justified judgement using the graph; do not automatically write a two-sided essay.
- Calculate
- Use the appropriate numerical method and show sufficient working, especially when instructed. Give the requested units and precision.
- Show that
- Demonstrate the stated result through a valid chain of working. Repeating the given answer is not evidence.
- State/Give
- Give the requested fact or value directly, with units or direction if needed. Do not assume the answer must be exactly one or two words.
Test your understanding of Graphs: calculate or estimate gradients of graphs and areas under graphs (including quadratic and other non- linear graphs), and interpret results in cases such as distance-time graphs, velocity-time graphs and graphs in financial contexts (Higher tier only)
Active recall beats re-reading. Take an instant quiz now to test what you’ve learned and lock it into long-term memory.
7 days Premium · Then the free plan continues · No card, no charge