AQA · GCSE · Mathematics
Course version: 8300 · Version from Sept 2015
Graphs: identify and interpret roots, intercepts and turning points of quadratic functions graphically deduce roots algebraically
A quadratic function has the form y = ax² + bx + c and its graph is a parabola.
- 4 key terms
Study notes
From the checked teaching notes for this specification point.
The idea
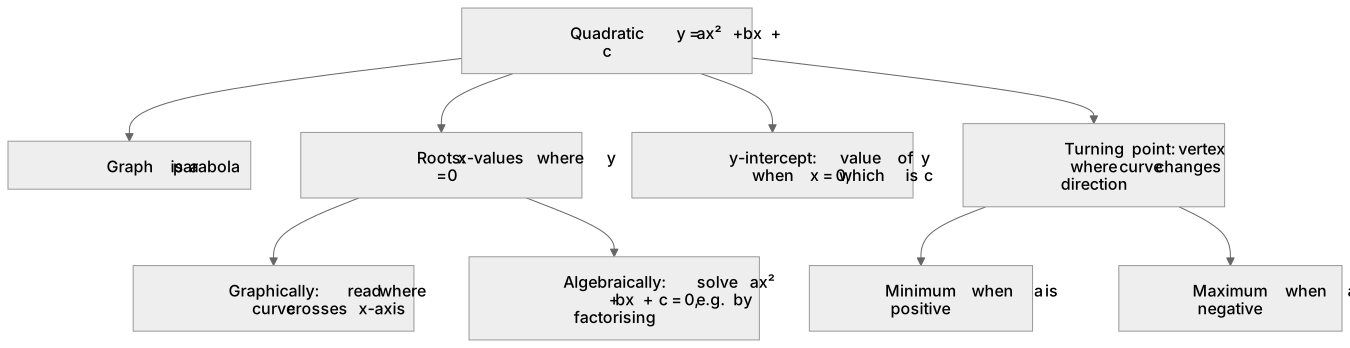
A quadratic function has the form y = ax² + bx + c and its graph is a parabola. The roots are the x-values where y = 0, so they are the x-intercepts of the curve. The y-intercept is the value of y when x = 0, which is c. The turning point is the vertex where the curve changes direction; it is a minimum when a is positive and a maximum when a is negative. Graphically, read roots where the curve crosses the x-axis, read the y-intercept where it crosses the y-axis, and read the turning point at the peak or trough. Algebraically, deduce roots by solving ax² + bx + c = 0, for example by factorising x² − 5x + 6 = 0 as (x − 2)(x − 3) = 0, giving roots x = 2 and x = 3.
What earns the marks
- Roots of a quadratic are the x-values where the graph crosses the x-axis, that is where y = 0.
- The y-intercept of y = ax² + bx + c is the constant term c, at x = 0.
- The turning point is the vertex where the curve changes from decreasing to increasing or vice versa.
- A positive coefficient of x² gives a minimum turning point; a negative coefficient gives a maximum turning point.
- Roots can be deduced algebraically by solving the quadratic equation, for example by factorising.
Common mistakes and how to put them right
Confusing roots with the y-intercept.
Put it right by remembering roots are x-values where y = 0 and the y-intercept is where x = 0.
Reading the turning point as a root.
Put it right by identifying the vertex as the maximum or minimum point, not necessarily on the x-axis.
Forgetting that a quadratic may have no real roots if the graph does not cross the x-axis.
Put it right by checking whether the curve meets the x-axis at all.
Assuming the turning point always lies on the y-axis.
Put it right by locating the vertex from the symmetry of the curve or by completing the square.
Exam tips
- Sketch the parabola to see where it crosses the axes and where the turning point lies.
- When factorising to find roots, set each factor equal to zero and solve for x.
- Check whether the turning point is a maximum or minimum by looking at the sign of the x² coefficient.
Try the lesson
The start of the Graphs: identify and interpret roots, intercepts and turning points of quadratic functions graphically deduce roots algebraically lesson, made from checked teaching notes for this specification point.
Have a go first
A quadratic equation y = f(x) is plotted on a graph. The curve intersects the x-axis at the points (−4, 0) and (1, 0), and intersects the y-axis at (0, −4). What are the roots of the equation f(x) = 0?
Listen
A quadratic function has the form y = ax² + bx + c and its graph is a parabola. The roots are the x-values where y = 0, so they are the x-intercepts of the curve. The y-intercept is the value of y when x = 0, which is c. The turning point is the vertex where the curve changes direction; it is a minimum when a is positive and a maximum when a is negative. Graphically, read roots where the curve crosses the x-axis, read the y-intercept where it crosses the y-axis, and read the turning point at the peak or trough. Algebraically, deduce roots by solving ax² + bx + c = 0, for example by factorising x² − 5x + 6 = 0 as (x − 2)(x − 3) = 0, giving roots x = 2 and x = 3.
See it
Key words
Say what each word means before you turn the card.
Roots
Try answering aloud or in your head before turning the card.
y-intercept
Try answering aloud or in your head before turning the card.
Turning point
Try answering aloud or in your head before turning the card.
Quadratic function
Try answering aloud or in your head before turning the card.
See every definition
- Roots
- The x-values where y = 0, so they are the x-intercepts of the curve.
- y-intercept
- The value of y when x = 0, which is c in y = ax² + bx + c.
- Turning point
- The vertex where the curve changes direction; it is a minimum when a is positive and a maximum when a is negative.
- Quadratic function
- A function of the form y = ax² + bx + c whose graph is a parabola.
Label the diagram
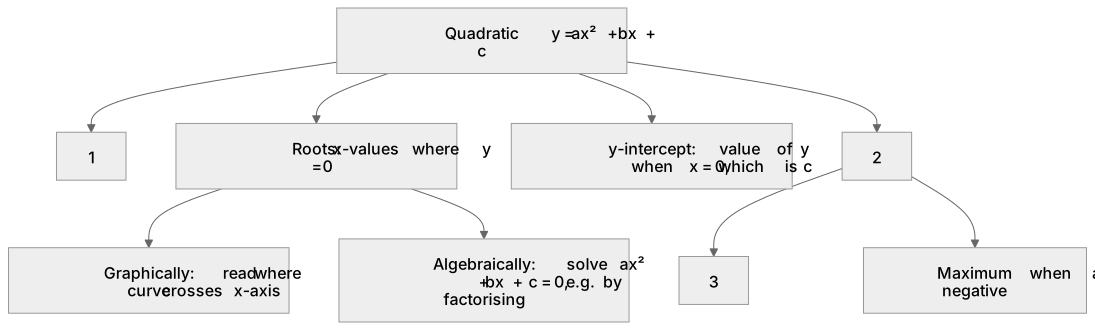
Some boxes have lost their names. Pick the right name for each number.
1Box 1
2Box 2
3Box 3
There is more to this lesson
The full lesson goes on to check your understanding and help you earn the marks. Create a free account to carry on, with your progress saved.
7 days Premium · Then the free plan continues · No card, no charge
Test your understanding of Graphs: identify and interpret roots, intercepts and turning points of quadratic functions graphically deduce roots algebraically
Active recall beats re-reading. Take an instant quiz now to test what you’ve learned and lock it into long-term memory.
7 days Premium · Then the free plan continues · No card, no charge