AQA · GCSE · Mathematics
Course version: 8300 · Version from Sept 2015
Graphs: including exponential functions y = kˣ for positive values of k, and the trigonometric functions (with arguments in degrees) y = sin x, y = cos x and y = tan x for angles of any size (Higher tier only)
This Higher tier point covers exponential graphs y = kˣ for positive k, and trigonometric graphs y = sin x, y = cos x and y = tan x in degrees.
- 4 key terms
Study notes
From the checked teaching notes for this specification point.
The idea
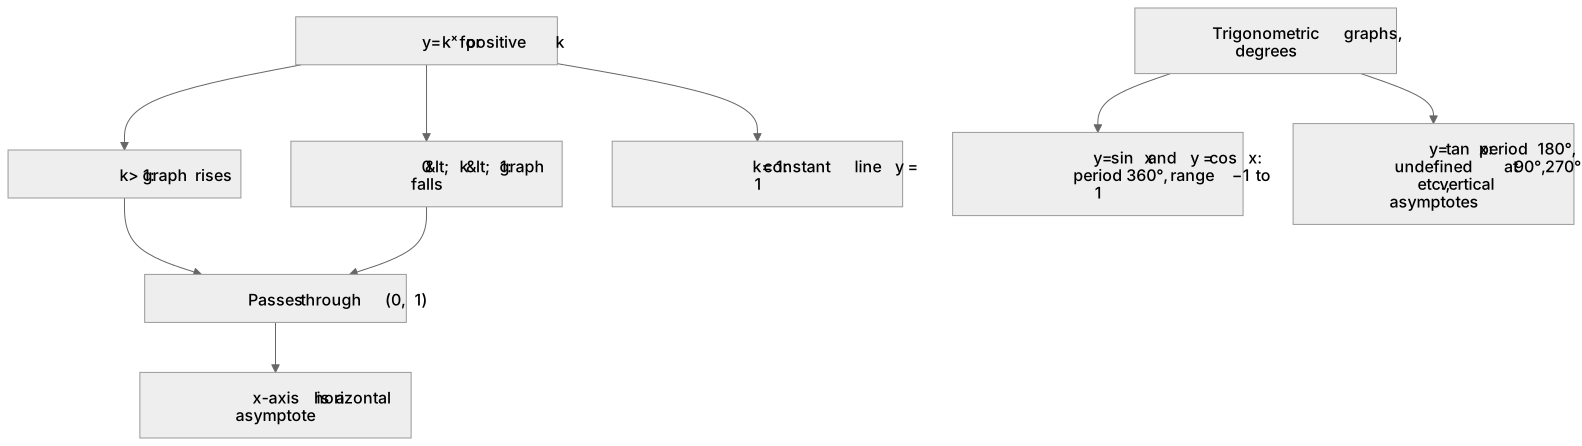
This Higher tier point covers exponential graphs y = kˣ for positive k, and trigonometric graphs y = sin x, y = cos x and y = tan x in degrees. For y = kˣ with k > 1, the graph rises, passes through (0, 1) since k⁰ = 1, and has the x-axis as a horizontal asymptote. For 0 < k < 1, the graph falls but still passes through (0, 1). The trigonometric graphs are periodic: y = sin x and y = cos x have a period of 360° and range from −1 to 1. The graph of y = tan x has a period of 180° and is undefined at 90°, 270°, etc., where it has vertical asymptotes. You must recognise these shapes, state key features, and use them to solve simple trigonometric equations for angles of any size, including negative angles.
What earns the marks
- Recognises that y = kˣ for k > 0 and k ≠ 1 passes through (0, 1) and has the x-axis as a horizontal asymptote; when k = 1 it is the constant line y = 1.
- Describes the shape of y = kˣ: increasing for k > 1, decreasing for 0 < k < 1, and never touching the x-axis; handles k = 1 as y = 1.
- States that y = sin x and y = cos x have period 360° and range −1 ≤ y ≤ 1, and sketches their wave shapes.
- States that y = tan x has period 180°, is undefined at 90° + 180°n, and has vertical asymptotes at those values.
- Uses the graphs to find all solutions in a given interval for equations such as sin x = 0.5 or tan x = 1, including angles of any size.
Common mistakes and how to put them right
Thinking that y = kˣ can be zero or negative.
Put it right: For positive k, kˣ is always positive; for k ≠ 1 the graph approaches but never touches or crosses the x-axis, while k = 1 gives y = 1.
Believing that y = tan x is defined at 90°.
Put it right: Tan 90° is undefined, so the graph has a vertical asymptote there, not a point.
Assuming y = sin x and y = cos x have period 180°.
Put it right: Their period is 360°, while y = tan x has period 180°.
Exam tips
- When sketching trigonometric graphs, mark the key points such as maximum, minimum and intercepts, and label the period clearly.
- For exponential graphs, always mark the y-intercept at (0, 1) and draw the horizontal asymptote along the x-axis.
- When solving trigonometric equations, use the graph or the unit circle to find all solutions in the required interval, and remember to include negative angles if the interval extends below 0°.
Try the lesson
The start of the Graphs: including exponential functions y = kˣ for positive values of k, and the trigonometric functions (with arguments in degrees) y = sin x, y = cos x and y = tan x for angles of any size (Higher tier only) lesson, made from checked teaching notes for this specification point.
Have a go first
Consider the graph of y = cos x for angles of any size, with x measured in degrees. Which statement about this graph is correct?
Listen
This Higher tier point covers exponential graphs y = kˣ for positive k, and trigonometric graphs y = sin x, y = cos x and y = tan x in degrees. For y = kˣ with k > 1, the graph rises, passes through (0, 1) since k⁰ = 1, and has the x-axis as a horizontal asymptote. For 0 < k < 1, the graph falls but still passes through (0, 1). The trigonometric graphs are periodic: y = sin x and y = cos x have a period of 360° and range from −1 to 1. The graph of y = tan x has a period of 180° and is undefined at 90°, 270°, etc., where it has vertical asymptotes. You must recognise these shapes, state key features, and use them to solve simple trigonometric equations for angles of any size, including negative angles.
See it
Key words
Say what each word means before you turn the card.
Exponential growth and decay
Try answering aloud or in your head before turning the card.
Periodic functions and their properties
Try answering aloud or in your head before turning the card.
Asymptotes and domain restrictions
Try answering aloud or in your head before turning the card.
Solving trigonometric equations graphically
Try answering aloud or in your head before turning the card.
See every definition
- Exponential growth and decay
- For y = kˣ with k > 1 the graph rises, and for 0 < k < 1 the graph falls, but both pass through (0, 1) and have the x-axis as a horizontal asymptote.
- Periodic functions and their properties
- y = sin x and y = cos x have a period of 360° and range from −1 to 1, while y = tan x has a period of 180°.
- Asymptotes and domain restrictions
- The x-axis is a horizontal asymptote for y = kˣ, and y = tan x is undefined at 90°, 270°, etc., where it has vertical asymptotes.
- Solving trigonometric equations graphically
- The graphs are used to solve simple trigonometric equations for angles of any size, including negative angles.
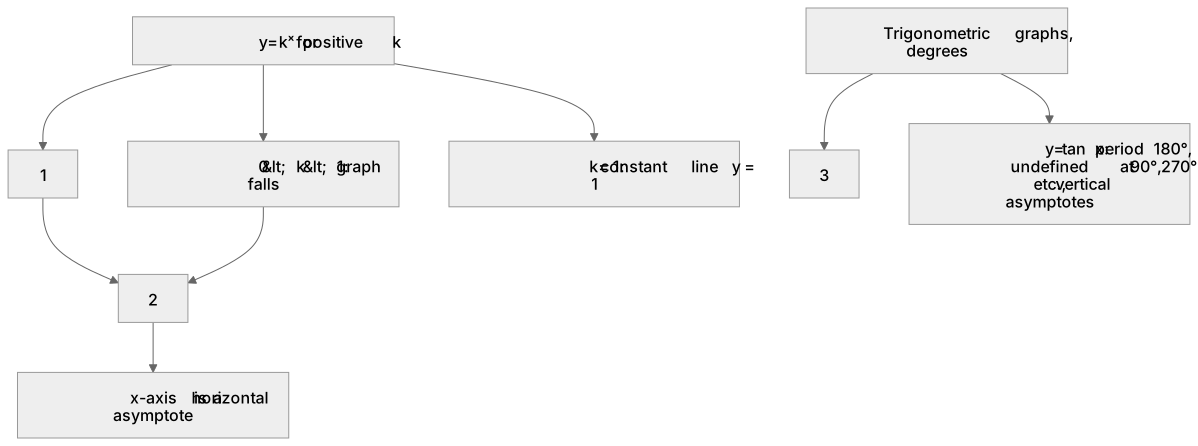
Label the diagram
Some boxes have lost their names. Pick the right name for each number.
1Box 1
2Box 2
3Box 3
There is more to this lesson
The full lesson goes on to check your understanding and help you earn the marks. Create a free account to carry on, with your progress saved.
7 days Premium · Then the free plan continues · No card, no charge
Test your understanding of Graphs: including exponential functions y = kˣ for positive values of k, and the trigonometric functions (with arguments in degrees) y = sin x, y = cos x and y = tan x for angles of any size (Higher tier only)
Active recall beats re-reading. Take an instant quiz now to test what you’ve learned and lock it into long-term memory.
7 days Premium · Then the free plan continues · No card, no charge