AQA · GCSE · Mathematics
Course version: 8300 · Version from Sept 2015
Graphs: plot graphs of equations that correspond to straight-line graphs in the coordinate plane
Turn an equation into an accurate straight-line graph using a method you can repeat under exam pressure. Master coordinate order, careful substitution and ruled-line checks, then tackle negative gradients, rearranged equations and horizontal or vertical lines. These AQA GCSE skills apply to both Foundation and Higher tiers.
- 12 min read
- 4 worked examples
- 6 practice questions
- 2 key terms
Try the lesson
The start of the Graphs: plot graphs of equations that correspond to straight-line graphs in the coordinate plane lesson, made from checked teaching notes for this specification point.
Have a go first
A student is plotting the straight-line graph of y = 4x - 2 on a coordinate plane. They plot the y-intercept first. Which of the following describes the correct method to plot the next point using the gradient?
Listen
An equation such as y = 2x + 1 pairs each x-value with exactly one y-value, producing a straight-line graph. To plot it, choose several x-values, substitute each into the equation to find the matching y-value, and record the results as coordinate pairs. For y = 2x + 1, x = 0 gives y = 1, so (0, 1) lies on the line; x = 2 gives y = 5, so (2, 5) lies on it. Plot the points on axes with a suitable scale, then draw a straight line through them with a ruler. A minimum of three points is a sensible check because a misplotted point will not lie on the straight line through the others. Equations of the form x = a produce vertical lines and y = b produce horizontal lines.
Key words
Say what each word means before you turn the card.
Generating coordinate pairs from a linear equation
Try answering aloud or in your head before turning the card.
Plotting points accurately on a scaled coordinate grid
Try answering aloud or in your head before turning the card.
See every definition
- Generating coordinate pairs from a linear equation
- Choosing several x-values, substituting each into the equation to find the matching y-value, and recording the results as coordinate pairs.
- Plotting points accurately on a scaled coordinate grid
- Marking the coordinate pairs on axes with a suitable scale, with the x-value first and the y-value second.
There is more to this lesson
The full lesson goes on to check your understanding and help you earn the marks. Create a free account to carry on, with your progress saved.
7 days Premium · Then the free plan continues · No card, no charge
Study Notes
Overview
A straight-line graph turns an algebraic rule into a visible relationship between two quantities. Each point on the line is a coordinate pair that satisfies the equation. Your task is to calculate some of those pairs, plot them accurately and draw the line they determine. This is not an artistic exercise: a clear method makes your working checkable and helps candidates secure credit for the mathematics.
The core skill appears in AQA GCSE Mathematics 8300, section 3.2.2, statement A9 and is required at both Foundation and Higher tiers. It builds on four-quadrant coordinates in A8 and connects to gradients and intercepts in A10. Questions can ask you to complete a table, draw a graph over a stated interval, recognise a horizontal or vertical line, or use a graph to read a value. More developed problems link plotting to rearranging equations and comparing real-life costs. 1
Learn the sequence choose, substitute, plot, check. Understand why it works, then practise without looking at the solution. All questions and suggested mark allocations in this guide are original teaching examples, not official AQA past-paper mark schemes.
Key Concepts
1. Coordinates are ordered pairs
A coordinate pair is written (x, y). The x-coordinate tells you the horizontal position; the y-coordinate tells you the vertical position. The origin is (0, 0). For (-2, 3), move two units left from the origin and then three units up. For (3, -2), move three right and two down. These are different points because order matters.
The four quadrants have sign patterns (+,+), (-,+), (-,-) and (+,-), starting at the top right and moving anticlockwise. Points on an axis are not inside a quadrant. A point on the y-axis has x = 0; a point on the x-axis has y = 0.
Cover and recall: where would (-3, -1) lie? Say the movements before plotting. Credit for plotting depends on the final position, not on how confidently you describe it.
2. An equation selects points on the graph
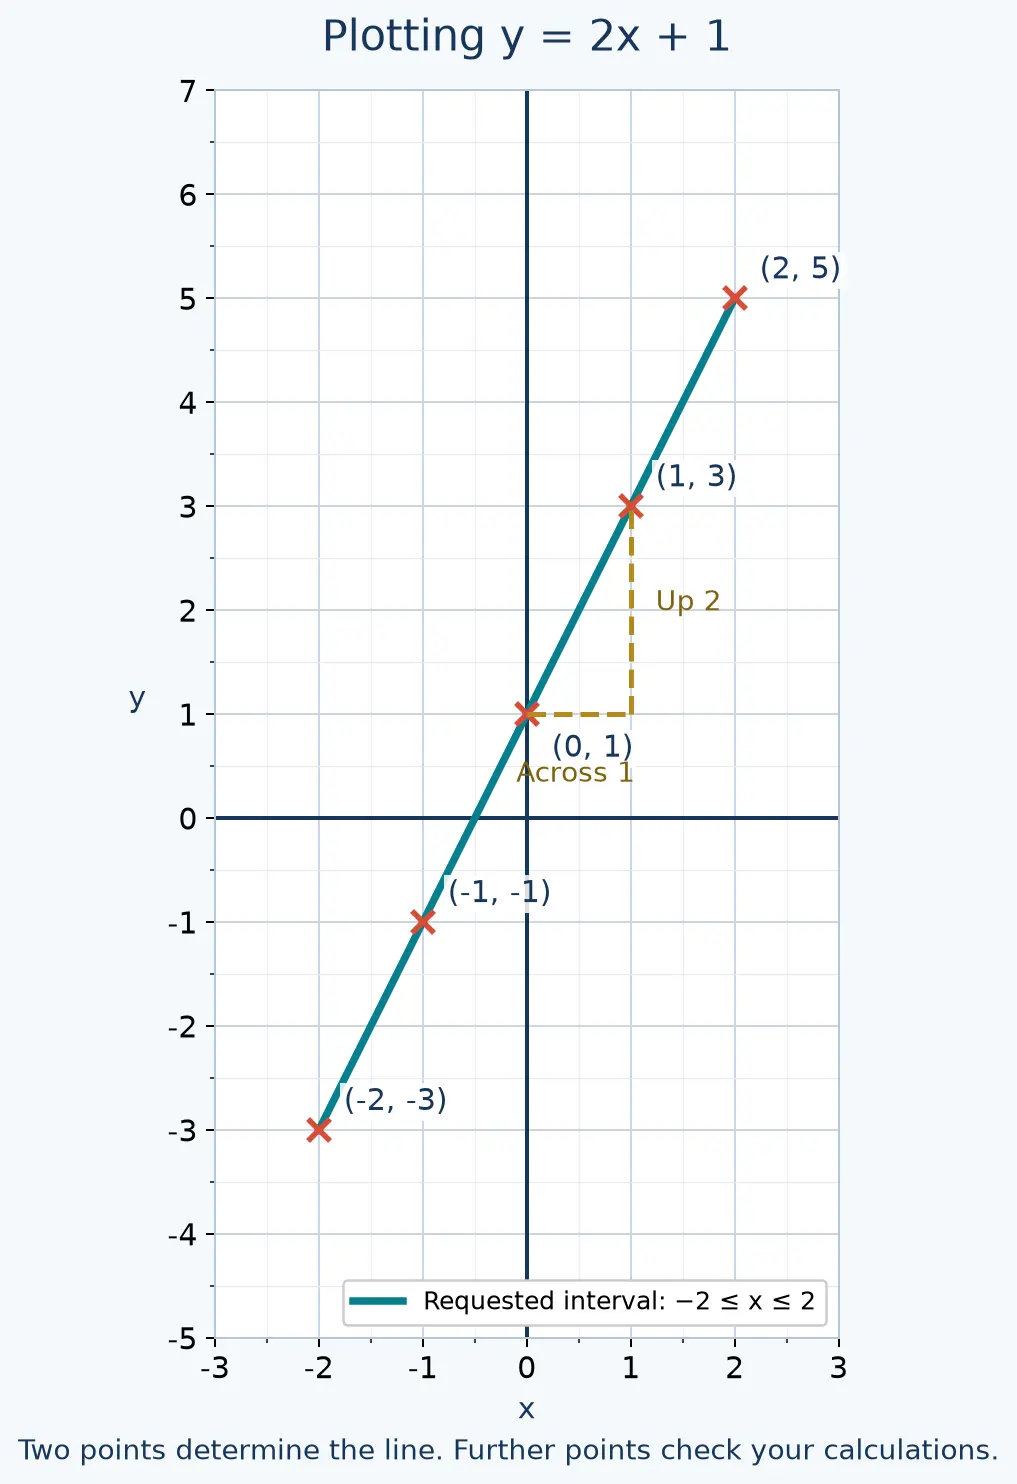
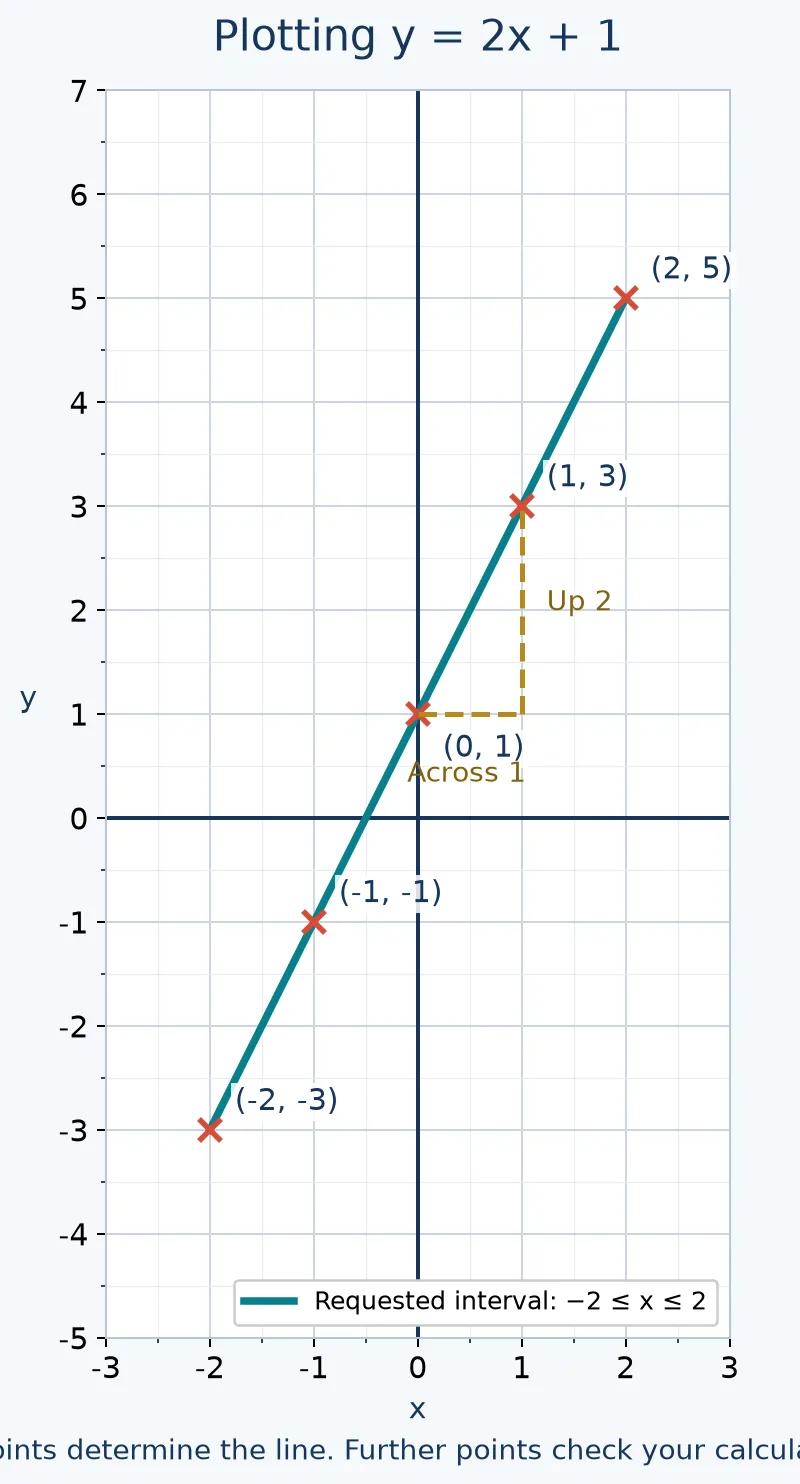
For y = 2x + 1, each chosen x-value produces a matching y-value. Substituting x = 0 gives y = 2(0) + 1 = 1, so (0, 1) belongs on the graph. Substituting x = 2 gives y = 5, so (2, 5) belongs too.
The graph includes all real coordinate pairs satisfying the equation, not only the values in your table. For example, x = 0.5 gives y = 2, so (0.5, 2) lies between two integer-input points. Conversely, (2, 4) does not belong: when x = 2, the equation requires y = 5.
Why does this work? Plotting converts the equation's solutions into positions in the coordinate plane. A straight-line equation has a constant rate of change: equal increases in x produce equal changes in y.
3. Substitute carefully and construct a table
Read 2x + 1 as multiply x by two, then add one. It is not 2(x + 1). When substituting a negative value, brackets make the sign clear: 2(-2) + 1 = -4 + 1 = -3.
For y = 2x + 1, useful inputs are -2, -1, 0, 1, 2:
| x | -2 | -1 | 0 | 1 | 2 |
|---|---|---|---|---|---|
| y | -3 | -1 | 1 | 3 | 5 |
Each column is one pair. Therefore the points are (-2, -3), (-1, -1), (0, 1), (1, 3) and (2, 5). When x increases by one, y increases by two. This pattern is a useful arithmetic check, not a replacement for substitution when the inputs have unequal gaps.
Use the inputs printed in the question if supplied. Otherwise choose values spread across the required interval, including zero when possible. With fractional coefficients, inputs that cancel the denominator often simplify calculations. Do not select points outside the supplied grid and then guess where they would go.
4. Plot accurately and draw one ruled line
First read the grid's scales. One small square might represent 0.5, 1, 2 or another amount. Keep the scale constant along each axis. The two axes may use different scales, but then the visual angle alone is not a reliable measure of gradient.
Use a sharp pencil and small crosses. Plot x horizontally first, then y vertically. Two distinct correct points determine a straight line. Calculate and plot at least a third point as a check unless the question specifies otherwise. If three points do not align, recalculate the suspect coordinate and inspect the scale. Do not draw a bent line to include an error.
Place a ruler through the correct points and draw a single thin straight line. Follow the stated range: for -2 ≤ x ≤ 2, show the graph from x equal to negative two to x equal to two. If no restricted interval is specified, extend the line suitably across the available grid. A table alone is not a completed graph, and a collection of crosses alone is not a ruled-line answer when the question says draw the graph.
5. Recognise rising and falling lines
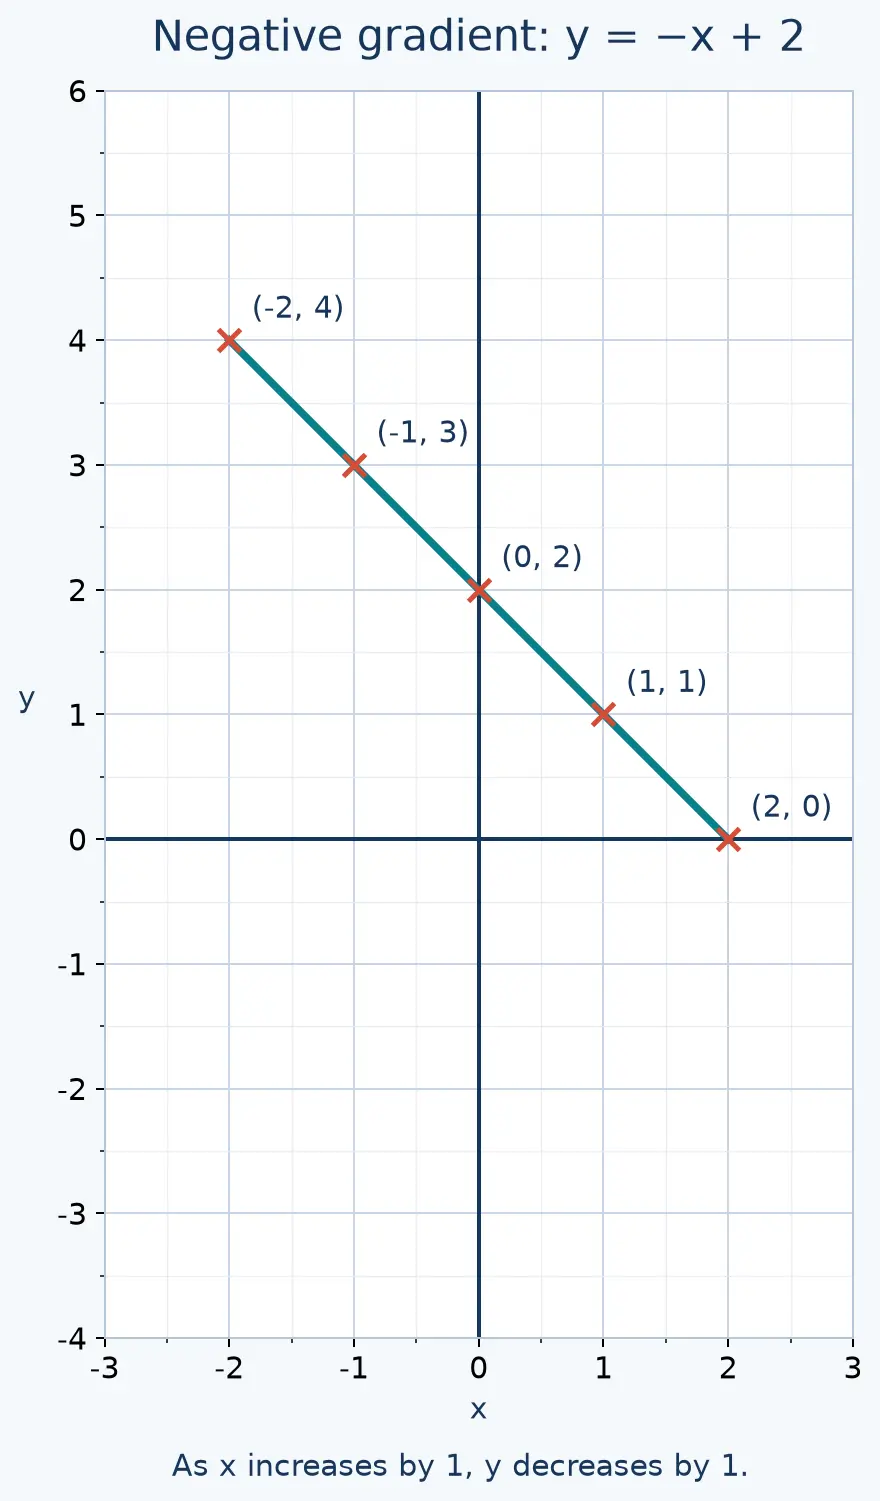
In y = mx + c, m is the gradient and c is the y-intercept. For y = 2x + 1, m is two and c is one. Increasing x by one increases y by two, so the line rises from left to right. Its y-axis crossing is (0, 1).
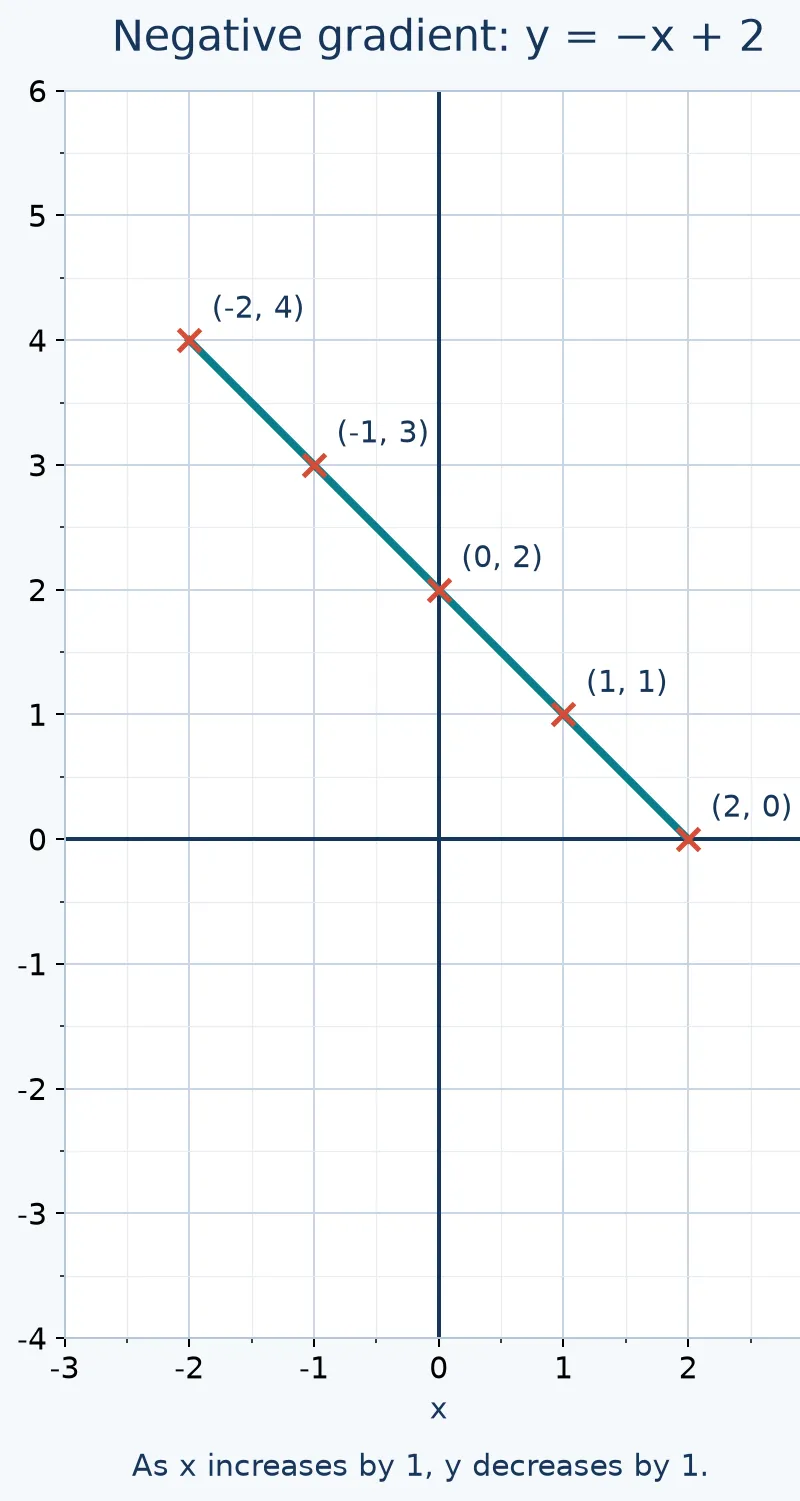
For y = -x + 2, increasing x by one decreases y by one. The line falls from left to right and crosses the y-axis at (0, 2). When x = -2, remember -(-2) = 2, giving y = 4.
The intercept is a coordinate on an axis, not a vague region. To find a y-intercept, set x to zero. To find an x-intercept, set y to zero. For y = 2x + 1, solving 0 = 2x + 1 gives x = -0.5, so the x-intercept is (-0.5, 0).
6. Handle horizontal and vertical lines
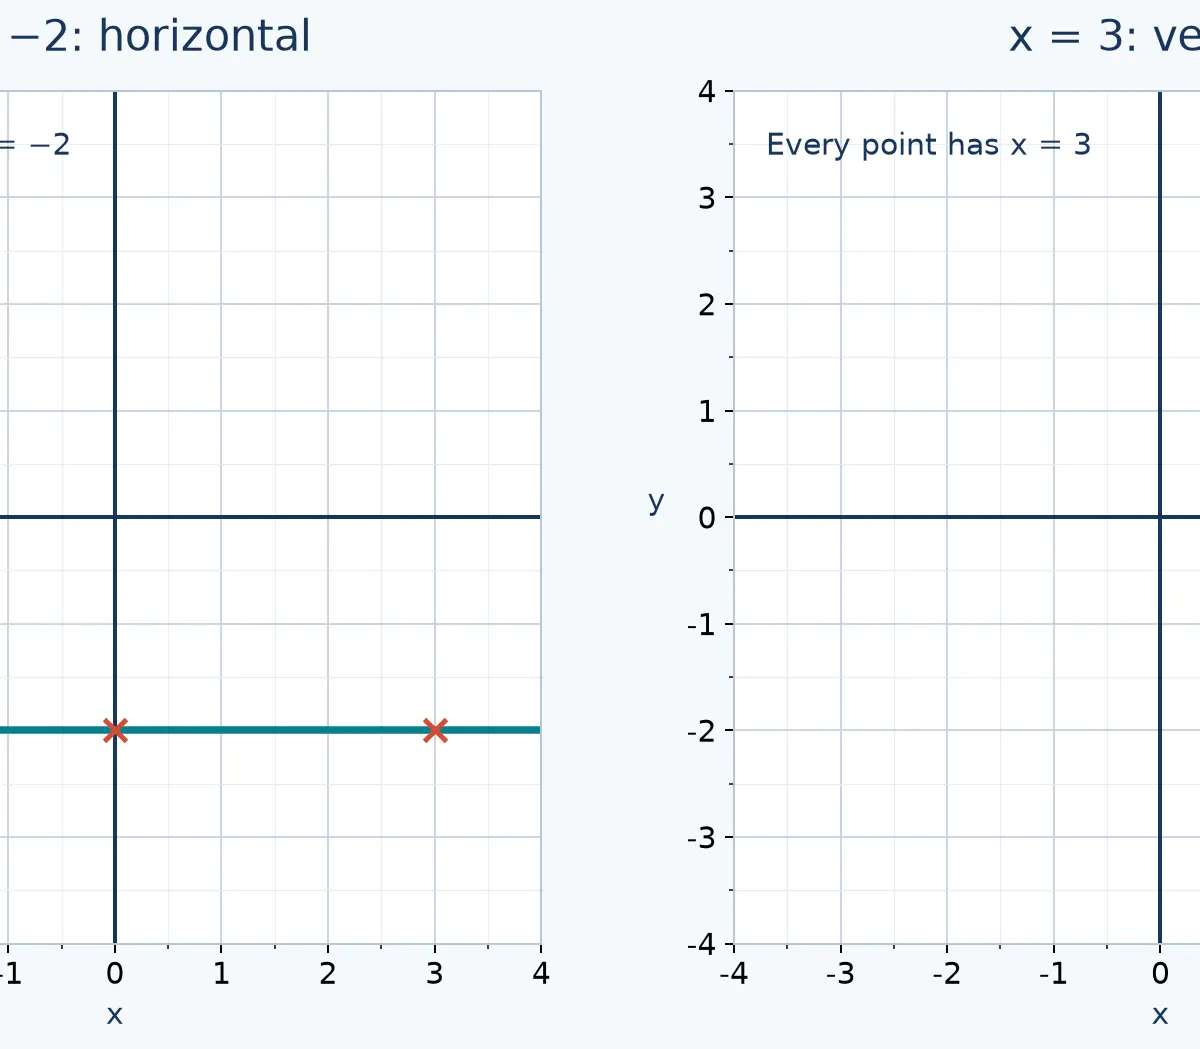
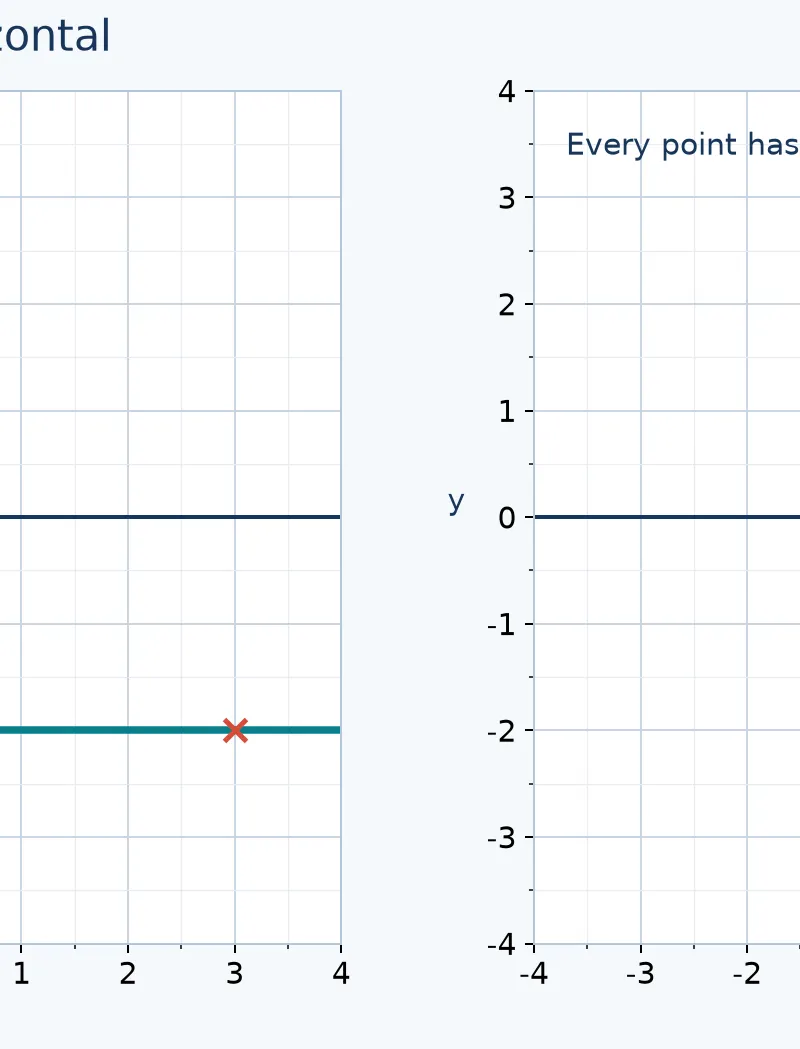
The equation y = -2 fixes the y-coordinate at negative two while allowing x to change. Examples are (-3, -2), (0, -2) and (3, -2). The graph is horizontal and its gradient is zero.
The equation x = 3 fixes the x-coordinate at three while allowing y to change. Examples are (3, -3), (3, 0) and (3, 3). The graph is vertical. Its gradient is undefined because calculating change in y divided by change in x would involve division by zero.
Do not assume the named letter tells you the line's direction. Ask which coordinate stays fixed. Fixed y, flat line; fixed x, upright line. The coordinate axes themselves are y = 0 and x = 0. Vertical lines cannot be written as y = mx + c with a finite value of m.
7. Rearrange when y is not isolated
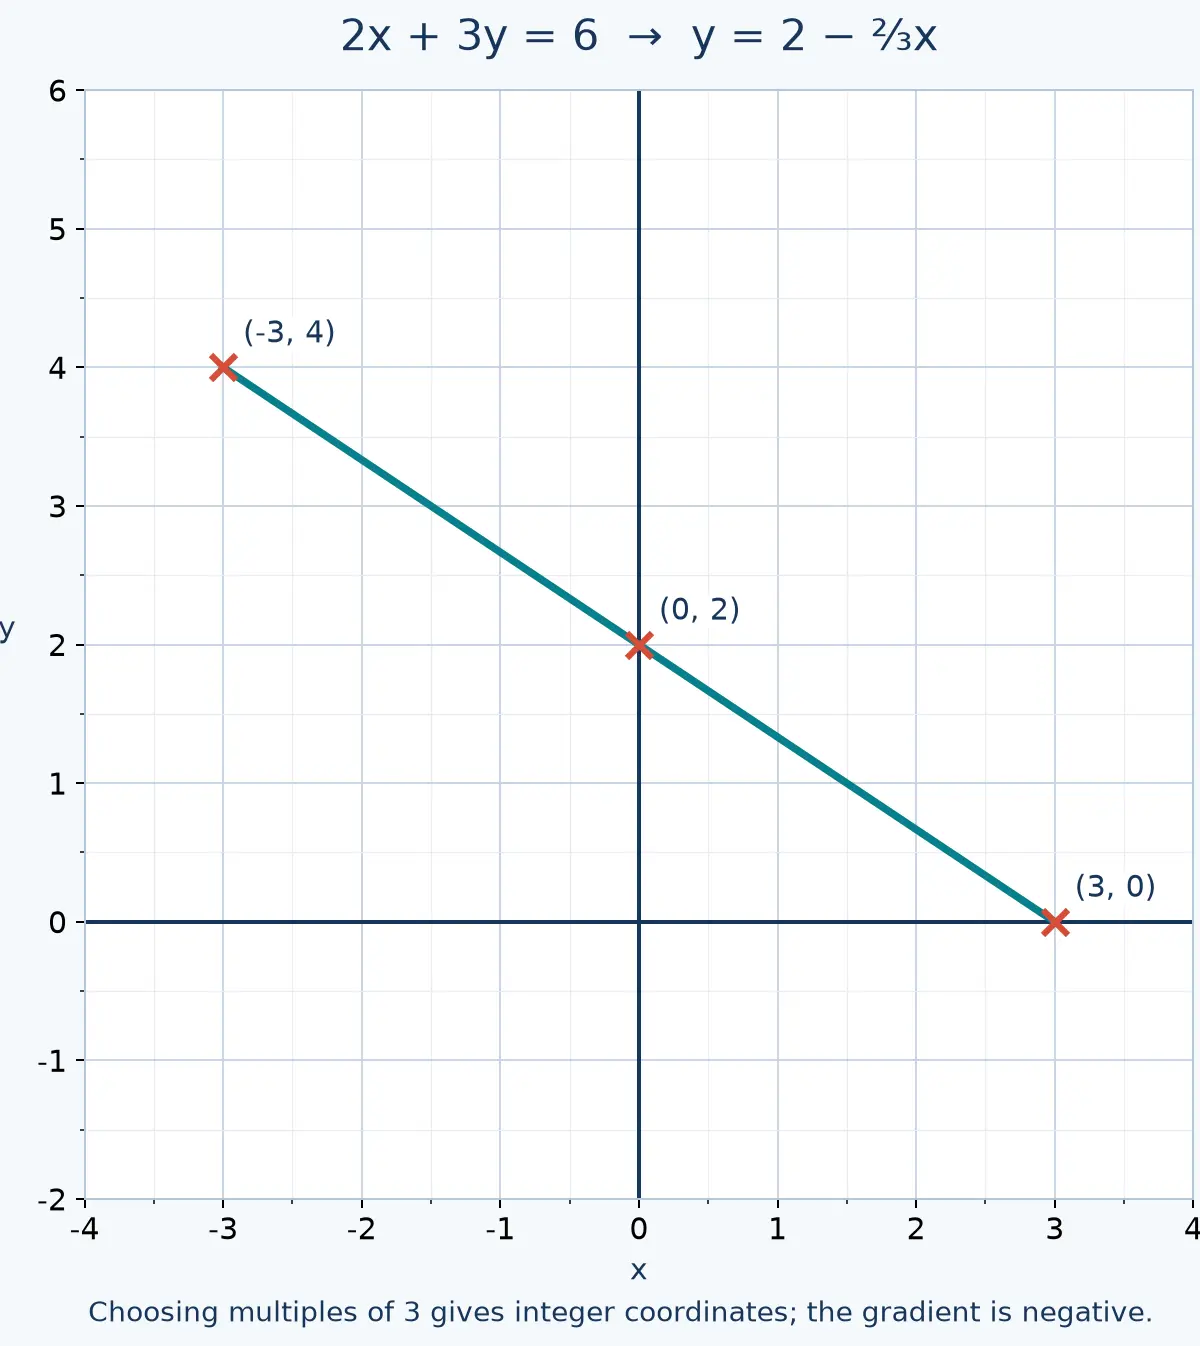
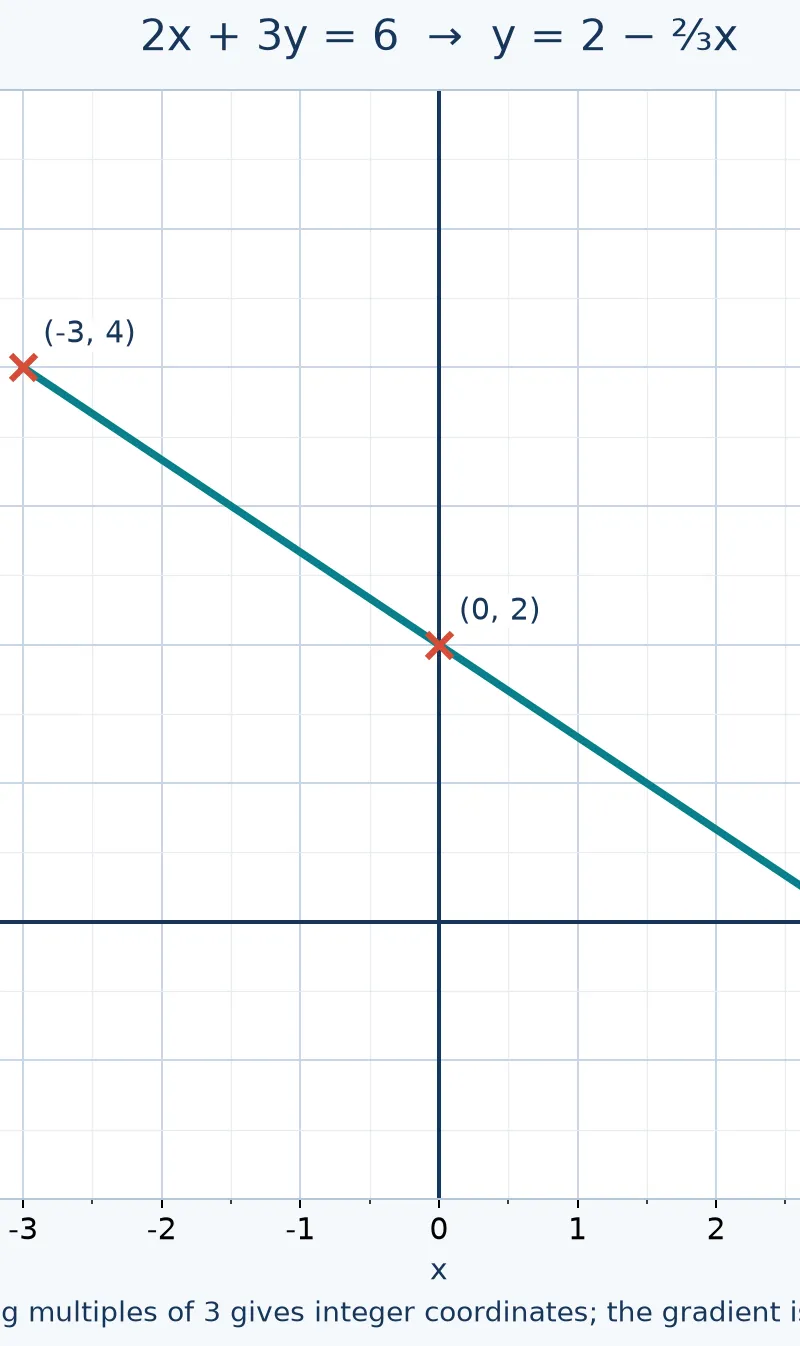
An equation such as 2x + 3y = 6 still describes a straight line. Subtract 2x from both sides to obtain 3y = 6 - 2x. Divide every term on the right by three: y = 2 - (2/3)x. Writing y = 6 - (2/3)x would fail to divide the six and would change the graph.
Choose x = -3, 0, 3. The corresponding y-values are 4, 2, 0, giving three convenient points. Check one in the original equation: 2(-3) + 3(4) = -6 + 12 = 6. This verifies the rearrangement and the coordinate together.
Rearrangement is not compulsory if you can substitute directly into the original equation and solve for y correctly. The best method is the one you can execute accurately and show clearly.
Mathematical Relationships
Formula knowledge
Must memorise: y = mx + c, where x and y are coordinates, m is the gradient and c is the y-intercept. It represents non-vertical straight lines and provides checks on a table and drawing.
Must memorise: m = (y₂ - y₁)/(x₂ - x₁) = change in y/change in x, for two distinct points on a non-vertical line. Keep the subtraction order consistent. Use coordinate units, not just numbers of squares.
Must memorise: y = b is horizontal with gradient zero; x = a is vertical with undefined gradient. Here a and b are fixed constants. Must memorise: the y-axis has x = 0, and the x-axis has y = 0; these facts identify intercepts.
Must memorise: ax + by = d rearranges to y = -(a/b)x + d/b when b ≠ 0. This is a useful general form, but you may derive it by ordinary rearrangement rather than recite it. If b = 0 and a ≠ 0, the equation instead gives the vertical line x = d/a.
None of these graph relationships appears on the checked AQA 2026 Foundation or Higher formula sheets. AQA states the 2027 sheets have unchanged content. Here, 'Must memorise' means know or be able to derive the relationship without relying on the supplied sheet. 3 4 5
Tier boundaries
Everything needed for plotting in this guide is applicable to both tiers. Negative numbers, fractions and rearrangement do not automatically make a straight-line question Higher-only. A9 also includes parallel-line and line-equation work in additional Foundation content. Identifying perpendicular lines using their equations is Higher-only and outside this guide's core plotting objective. 1
Reading and Interpreting Your Graph
To read y for a given x, locate x on the horizontal axis, move vertically to the line, then move horizontally to the y-axis. To find x for a given y, reverse that route. Use light construction lines if helpful. For y = 2x + 1, the graph gives approximately y = 4 at x = 1.5; substitution confirms the exact answer.
If the question says use your graph, show or clearly indicate the graphical reading. An algebraic calculation may check it, but does not necessarily satisfy that instruction. Report precision supported by the grid and any stated rounding requirement. Do not claim several decimal places from a coarse drawing.
A plotted intersection of two lines gives a pair satisfying both equations. This links straight-line plotting to simultaneous equations, but candidates must read both coordinates, not only the x-value. 1
Practical Applications and Units
A taxi model might be C = 2d + 4, where C is the cost in pounds and d is distance in kilometres. The graph begins at (0, 4) and increases by £2 for each additional kilometre. The intercept represents a fixed starting charge, so the relationship is not direct proportion: it does not pass through the origin.
At d = 3, C = £10. Label the axes Distance (km) and Cost (£). Do not extend this model to negative distances simply because an algebraic straight line can extend in both directions. If the tariff applies only from zero to ten kilometres, show only that domain.
Must memorise: £1 = 100p, 1 km = 1000 m and 1 hour = 60 minutes. Use these conversions only when relevant to a context. For example, 1500 metres is 1.5 kilometres, not 1500 kilometres. Coordinate-only questions have no physical units unless the question supplies them.
There is no required practical for this mathematics topic. Pencil, ruler, eraser and graph paper are practice equipment, not an AQA science-style required-practical assessment.
Exam Technique and Active Revision
AQA's three papers each have 80 marks and last 90 minutes. Paper 1 is non-calculator; Papers 2 and 3 allow calculators. The whole-paper average is 90 ÷ 80 = 1.125 minutes per mark, about 68 seconds. Aim around one minute per mark in practice to preserve checking time, but allow sensible extra time for careful graph drawing. 2
Read the command word, required interval and scale before calculating. For a multi-part task, complete the table, plot the requested points, draw the line and answer any reading or explanation part. Additional writing is not automatically additional credit. Actual marks and plotting tolerances depend on the particular scheme.
For a concrete example of that specificity, AQA June 2024 Paper 1F question 5(b) awards B2 for the four plotted integer solutions (0, 3), (1, 2), (2, 1) and (3, 0) with no extra points, with alternative and partial-credit routes also given. This is a plotting-solutions task, not a universal rule for drawing lines. 6
Cover the worked answer and rebuild its table yourself. Then draw the graph without copying the picture. Check calculation, coordinate order and straightness separately. Repeat tomorrow and later in the week, mixing a rising line with a falling line and a fixed-coordinate equation. Ask why each graph has its shape: explaining the fixed or constant-changing quantity makes the method easier to recover under exam pressure.
Ten-Minute Audio Revision
Listen to the introduction, five-minute core explanation, two-minute exam advice, one-minute recall quiz and one-minute recap. Answer aloud before hearing each quiz solution. Listening supports revision; the mark-winning plotting skill still needs pencil-and-ruler practice.
References
Visual Resources
4 diagrams and illustrations
Interactive Diagrams
1 interactive diagram to visualise key concepts
Conceptual Flow Outline
A plotting routine that sends a non-collinear point back for checking instead of producing a zigzag.
Worked Examples
4 worked examples — open one to explore the question and available guidance.
Practice Questions
Try the question, then reveal an answer plan or example response
Complete the table for y = 3x - 2 using x = -1, 0, 2. Show one substitution. Original practice question, 3 marks.
Hint: Multiply each x-value by 3 before subtracting 2.
Draw y = x - 1 for -2 ≤ x ≤ 3. Use axes with x from -3 to 4 and y from -4 to 3, with one unit per major square. Calculate at least three points first. Original practice question, 3 marks.
Hint: Include x = -2, 0 and 3 so the requested interval is covered.
On axes from -4 to 4, draw and label x = -1 and y = 3. State their intersection. Original practice question, 3 marks.
Hint: Identify which coordinate is fixed for each line.
Draw y = (1/2)x - 2 for -4 ≤ x ≤ 4, using x = -4, 0, 4. Use axes from -5 to 5 in both directions, one unit per major square. State the y-intercept. Original practice question, 4 marks.
Hint: The chosen inputs make (1/2)x an integer.
Rearrange 3x + 2y = 6 to make y the subject. Draw its graph for -2 ≤ x ≤ 4 using x = -2, 0, 4. Use axes with x from -3 to 5 and y from -4 to 7, one unit per major square. Use the graph to find y when x = 2. Original practice question, 6 marks.
Hint: Subtract 3x, then divide every term by 2. The requested reading is the x-intercept.
A delivery fee is C = 1.5d + 3, where C is in pounds and d is in kilometres. Calculate C for d = 0, 2, 4 and draw the graph for 0 ≤ d ≤ 4 on axes from 0 to 4 km and £0 to £10. Explain the meaning of the intercept. Original practice question, 5 marks.
Hint: The intercept represents the cost when no distance has been travelled.
Exam technique
How to turn what you know into marks
How to approach the question
Identify the command word, given equation, required x-range and grid scale. Use specified table inputs. Substitute with brackets around negative values. Plot x first and y second, then draw the ruled line if requested. Complete any subsequent reading or explanation part.
How to structure your answer
For a table-completion part, put the correct outputs in the supplied cells. For a graph part, show the requested plotted points and line on the grid. For a multi-step question, keep rearrangement, table, graph and graphical reading distinct. Extra prose or extra points are not automatically extra marks. The allocations in this guide are illustrative only.
Timing
AQA papers allow 90 minutes for 80 marks: 1.125 minutes per mark, approximately 68 seconds. Whole-paper averages are 4.5 minutes for 4 marks and 6.75 minutes for 6 marks. Aim around 1 minute per mark in practice to reserve checking time; this is pacing advice, not an AQA instruction.
Common pitfalls
- Replacing 2x + 1 with 2(x + 1): multiply x first, then add 1.
- Reversing (x, y): use the horizontal coordinate first.
- Mishandling signs: -(-2) = 2, but 2(-2) = -4.
- Assuming a square means one unit: inspect the labels and count subdivisions.
- Joining an incorrect point with a zigzag: recalculate instead and use one ruled straight line.
- Swapping x = a and y = b: identify the coordinate that is fixed.
- Dividing only one term when rearranging: divide the whole right-hand side.
- Ignoring the interval or context: draw the required range and use the stated units.
What the command words want
- Draw
- Produce the requested accurate graph with a ruler for a straight line, appropriate scale and required interval.
- Plot
- Place the requested points accurately on the grid. Do not add an unnecessary line unless the question requires it.
- Sketch
- Show the correct overall shape and important intercepts or labels; this is not a substitute for precise plotting when the question says draw.
- Compare
- Compare matching features or values, for example gradients or costs at the same distance. Not every comparison needs both a similarity and a difference.
- Explain
- Give a mathematical reason, for example 'the line is horizontal because y remains constant while x varies'.
- Complete
- Fill the missing table entries using the stated equation and the inputs already supplied.
- Describe
- Use mathematical features such as 'falls from left to right' or 'crosses the y-axis at (0, 2)'.
- Evaluate
- In mathematics, this commonly means work out the value of an expression. It does not automatically mean discuss advantages and disadvantages.
- Calculate
- Show a suitable calculation and give the requested value, with units only when the context requires them.
- State/Give
- Provide the requested value, coordinate or equation directly. A coordinate needs both numbers in the correct order.
- Use your graph
- Read from the drawn graph and indicate the reading route or relevant point. Give precision justified by the scale.
Test your understanding of Graphs: plot graphs of equations that correspond to straight-line graphs in the coordinate plane
Active recall beats re-reading. Take an instant quiz now to test what you’ve learned and lock it into long-term memory.
7 days Premium · Then the free plan continues · No card, no charge