AQA · GCSE · Mathematics
Course version: 8300 · Version from Sept 2015
Solving equations and inequalities: solve linear inequalities in one or two variable(s), and quadratic inequalities in one variable represent the solution set on a number line, using set notation and on a graph (Higher tier only)
At Higher tier, inequalities extend to linear inequalities in one or two variables and quadratic inequalities in one variable.
- 4 key terms
Study notes
From the checked teaching notes for this specification point.
The idea
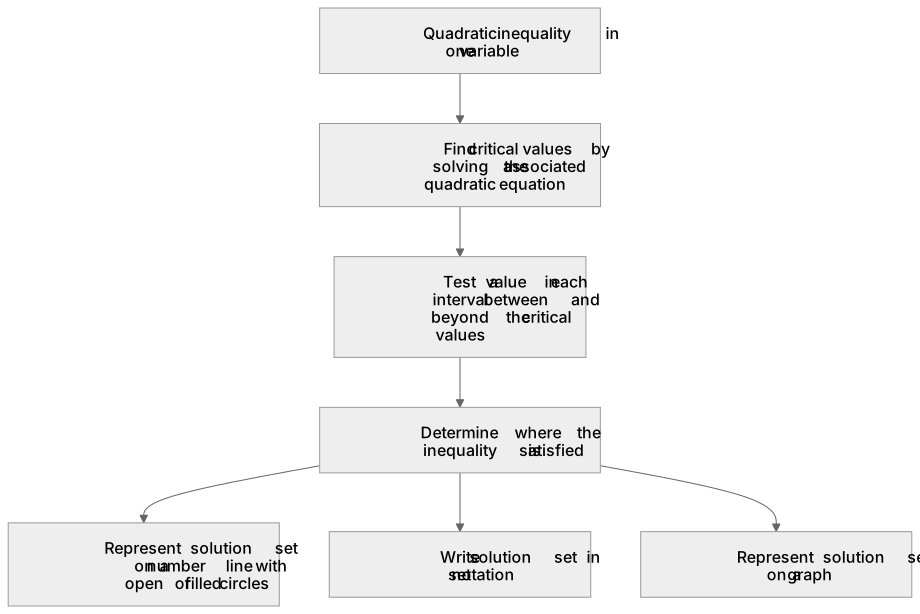
At Higher tier, inequalities extend to linear inequalities in one or two variables and quadratic inequalities in one variable. A linear inequality in two variables, such as y < 2x + 1, is solved by rearranging to make y the subject and then representing the solution set as a region on a graph, using a dashed boundary line for strict inequalities and a solid line for ≤ or ≥. A quadratic inequality in one variable, such as x² − 5x + 6 < 0, is solved by finding the critical values where the quadratic equals zero, then testing intervals to determine where the inequality holds. The solution set can be shown on a number line, in set notation such as {x : 2 < x < 3}, and on a graph.
What earns the marks
- Solves a linear inequality in one or two variables by rearranging correctly and, where necessary, reversing the inequality sign when multiplying or dividing by a negative number.
- Finds the critical values of a quadratic inequality by solving the associated quadratic equation.
- Tests intervals between and beyond the critical values to determine where the quadratic inequality is satisfied.
- Represents the solution set on a number line with correct open or filled circles and direction.
- Uses set notation correctly, for example {x : 2 < x < 3} or {x : x ≤ −1} ∪ {x : x ≥ 4}.
- Draws the boundary line correctly on a graph, using a dashed line for strict inequalities and a solid line for inclusive inequalities, and shades the correct region.
Common mistakes and how to put them right
Assuming a quadratic inequality is satisfied between the critical values without testing.
Put it right: Test a value in each interval to determine the correct region.
Using a solid boundary line for a strict inequality on a graph.
Put it right: Use a dashed line for < and > and a solid line for ≤ and ≥.
Writing set notation incorrectly, such as omitting the variable or using the wrong inequality signs.
Put it right: Write the set clearly, for example {x : x > 2}.
Forgetting to reverse the inequality sign when dividing by a negative number in a two-variable inequality.
Put it right: Reverse the sign whenever the multiplier or divisor is negative.
Exam tips
- For quadratic inequalities, always find the critical values first and then test a value in each interval to confirm the solution set.
- When drawing a graph, label the boundary line clearly and use the correct line style for strict or inclusive inequalities.
- Write the solution set in more than one form where possible, such as on a number line and in set notation, to show full understanding.
- Check whether the inequality is strict or inclusive before deciding on open or filled circles and dashed or solid lines.
Try the lesson
The start of the Solving equations and inequalities: solve linear inequalities in one or two variable(s), and quadratic inequalities in one variable represent the solution set on a number line, using set notation and on a graph (Higher tier only) lesson, made from checked teaching notes for this specification point.
Have a go first
Solve the inequality x^2 - 2x - 15 < 0. Choose the correct solution set.
Listen
At Higher tier, inequalities extend to linear inequalities in one or two variables and quadratic inequalities in one variable. A linear inequality in two variables, such as y < 2x + 1, is solved by rearranging to make y the subject and then representing the solution set as a region on a graph, using a dashed boundary line for strict inequalities and a solid line for ≤ or ≥. A quadratic inequality in one variable, such as x² − 5x + 6 < 0, is solved by finding the critical values where the quadratic equals zero, then testing intervals to determine where the inequality holds. The solution set can be shown on a number line, in set notation such as {x : 2 < x < 3}, and on a graph. A strong answer earns marks for these points. Solves a linear inequality in one or two variables by rearranging correctly and, where necessary, reversing the inequality sign when multiplying or dividing by a negative number. Finds the critical values of a quadratic inequality by solving the associated quadratic equation. Tests intervals between and beyond the critical values to determine where the quadratic inequality is satisfied. Represents the solution set on a number line with correct open or filled circles and direction. A common slip: Assuming a quadratic inequality is satisfied between the critical values without testing. Instead, test a value in each interval to determine the correct region. Exam tip: For quadratic inequalities, always find the critical values first and then test a value in each interval to confirm the solution set.
See it
Key words
Say what each word means before you turn the card.
Linear inequalities in one and two variables
Try answering aloud or in your head before turning the card.
Quadratic inequalities in one variable
Try answering aloud or in your head before turning the card.
Set notation for solution sets
Try answering aloud or in your head before turning the card.
Graphical representation of inequalities
Try answering aloud or in your head before turning the card.
See every definition
- Linear inequalities in one and two variables
- Inequalities solved by rearranging correctly, and where necessary reversing the inequality sign when multiplying or dividing by a negative number.
- Quadratic inequalities in one variable
- Inequalities solved by finding the critical values where the quadratic equals zero, then testing intervals to determine where the inequality holds.
- Set notation for solution sets
- A way of writing the solution set, for example {x : 2 < x < 3} or {x : x ≤ −1} ∪ {x : x ≥ 4}.
- Graphical representation of inequalities
- Showing the solution set as a region on a graph, using a dashed boundary line for strict inequalities and a solid line for ≤ or ≥.
Label the diagram
Some boxes have lost their names. Pick the right name for each number.
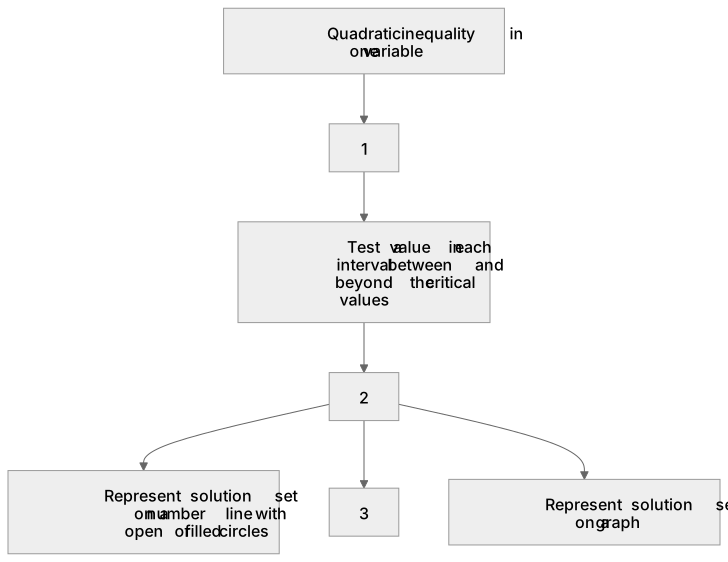
1Box 1
2Box 2
3Box 3
There is more to this lesson
The full lesson goes on to check your understanding and help you earn the marks. Create a free account to carry on, with your progress saved.
A week of Premium from your first lesson · Then the free plan continues · No card, no charge
Test your understanding of Solving equations and inequalities: solve linear inequalities in one or two variable(s), and quadratic inequalities in one variable represent the solution set on a number line, using set notation and on a graph (Higher tier only)
Active recall beats re-reading. Take an instant quiz now to test what you’ve learned and lock it into long-term memory.
A week of Premium from your first lesson · Then the free plan continues · No card, no charge