AQA · GCSE · Mathematics
Course version: 8300 · Version from Sept 2015
Statistics: infer properties of populations or distributions from a sample, whilst knowing the limitations of sampling
Use a sample to infer properties about a whole population or distribution, while knowing the limitations of sampling.
Study notes
From the checked teaching notes for this specification point.
The idea
Use a sample to infer properties about a whole population or distribution, while knowing the limitations of sampling. For example, measuring the hand spans of 50 random students from a school of 900 lets you estimate the mean hand span of all 900 students. You can also compare distributions: if a sample median is higher, you may infer the population median is likely higher too. A key limitation is that a sample can be biased or too small, making estimates uncertain. A random sample is more trustworthy than a convenience sample, and a larger sample usually gives a more reliable estimate. Describe inferences as estimates rather than exact facts, and always consider how the sampling method affects the reliability of your conclusions.
What earns the marks
- Use a sample statistic, such as a mean, median, range or proportion, to make an estimate about the corresponding population or distribution.
- Recognise that a sample gives an estimate rather than the exact population value, so the inference carries uncertainty.
- Explain that a larger sample generally gives a more reliable estimate than a smaller sample.
- Identify that a biased sampling method, such as asking only volunteers or one group, can make the sample unrepresentative.
- Compare two samples or distributions and infer which population is likely to have the higher or lower typical value, while noting the sample limitation.
Common mistakes and how to put them right
Treating the sample result as the exact population value.
Put it right: Report it as an estimate and state that the true population value may differ.
Assuming any sample is automatically representative.
Put it right: Check how the sample was selected and whether it could be biased.
Thinking a small sample is just as reliable as a large one.
Put it right: Explain that larger samples usually reduce the effect of chance variation.
Ignoring the sampling method when comparing two groups.
Put it right: Comment on whether the samples were random and comparable before drawing an inference.
Exam tips
- Name the sample statistic you are using, such as the sample mean or median, and say what population it estimates.
- Use words such as estimate, likely or probably rather than stating the population value as certain.
- When a question describes how the sample was chosen, comment on whether that method could cause bias.
Try the lesson
The start of the Statistics: infer properties of populations or distributions from a sample, whilst knowing the limitations of sampling lesson, made from checked teaching notes for this specification point.
Have a go first
A random sample of 40 batteries is tested and the mean lifetime is 25 hours. Which statement best describes what can be concluded about the mean lifetime of all the batteries produced?
Listen
Use a sample to infer properties about a whole population or distribution, while knowing the limitations of sampling. For example, measuring the hand spans of 50 random students from a school of 900 lets you estimate the mean hand span of all 900 students. You can also compare distributions: if a sample median is higher, you may infer the population median is likely higher too. A key limitation is that a sample can be biased or too small, making estimates uncertain. A random sample is more trustworthy than a convenience sample, and a larger sample usually gives a more reliable estimate. Describe inferences as estimates rather than exact facts, and always consider how the sampling method affects the reliability of your conclusions. A strong answer earns marks for these points. Use a sample statistic, such as a mean, median, range or proportion, to make an estimate about the corresponding population or distribution. Recognise that a sample gives an estimate rather than the exact population value, so the inference carries uncertainty. Explain that a larger sample generally gives a more reliable estimate than a smaller sample. Identify that a biased sampling method, such as asking only volunteers or one group, can make the sample unrepresentative. A common slip: Treating the sample result as the exact population value. Instead, report it as an estimate and state that the true population value may differ. Exam tip: Name the sample statistic you are using, such as the sample mean or median, and say what population it estimates.
See it
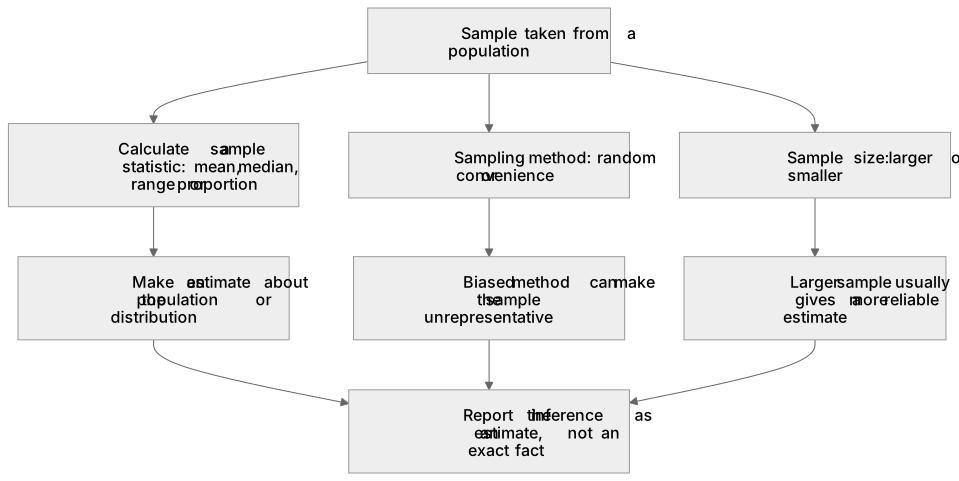
Label the diagram
Some boxes have lost their names. Pick the right name for each number.
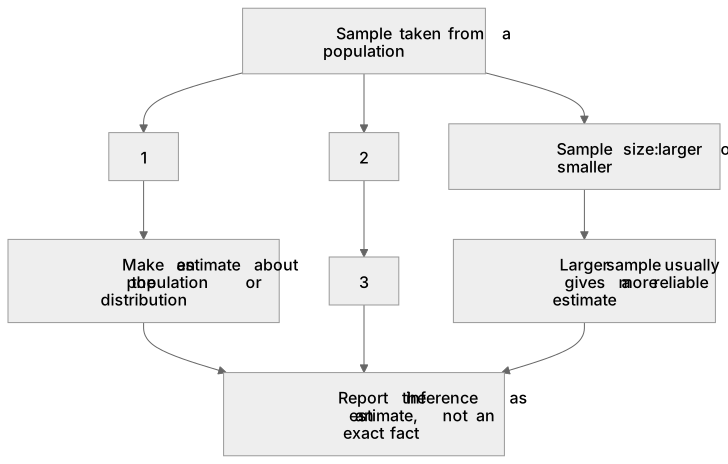
1Box 1
2Box 2
3Box 3
There is more to this lesson
The full lesson goes on to check your understanding and help you earn the marks. Create a free account to carry on, with your progress saved.
A week of Premium from your first lesson · Then the free plan continues · No card, no charge
Test your understanding of Statistics: infer properties of populations or distributions from a sample, whilst knowing the limitations of sampling
Active recall beats re-reading. Take an instant quiz now to test what you’ve learned and lock it into long-term memory.
A week of Premium from your first lesson · Then the free plan continues · No card, no charge