AQA · GCSE · Mathematics
Course version: 8300 · Version from Sept 2015
Statistics: know that it does not indicate causation draw estimated lines of best fit make predictions interpolate and extrapolate apparent trends whilst knowing the dangers of so doing
A scatter graph plots paired bivariate data as points.
- 4 key terms
Study notes
From the checked teaching notes for this specification point.
The idea
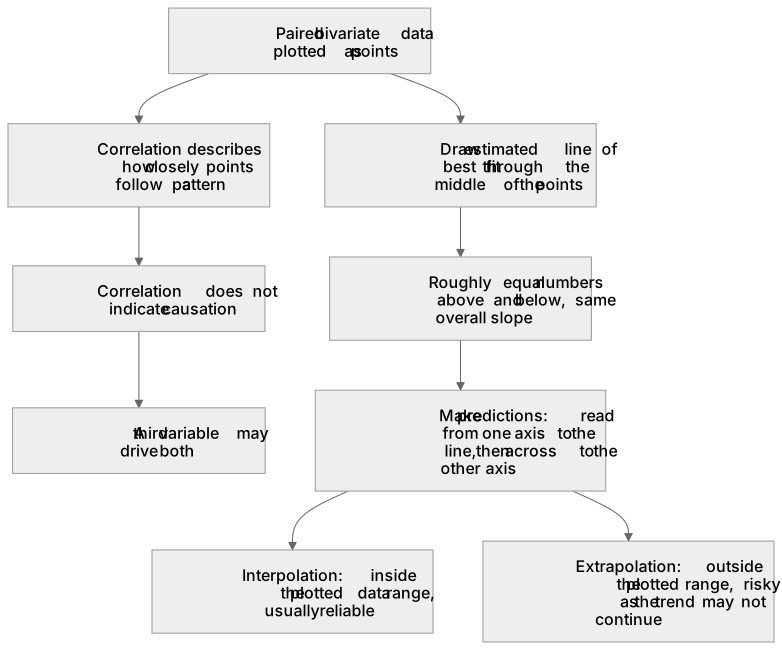
A scatter graph plots paired bivariate data as points. Correlation describes how closely the points follow a pattern, but correlation does not indicate causation: a strong link between two variables does not prove one causes the other, because a third variable may drive both. To draw an estimated line of best fit, place a straight line through the middle of the points, with roughly equal numbers above and below and the same overall slope. Use it to make predictions: read across from a value on one axis to the line, then down to the other axis. Interpolation predicts inside the plotted data range and is usually reliable. Extrapolation predicts outside that range and is risky, because the apparent trend may not continue.
What earns the marks
- Correlation between two variables does not indicate causation; a strong association does not prove that one variable causes the other.
- An estimated line of best fit is drawn through the middle of the plotted points, balancing points above and below and following the overall trend.
- Predictions are made by reading from a given value on one axis to the line of best fit and then across to the other axis.
- Interpolation means predicting within the range of the plotted data and is generally more reliable than extrapolation.
- Extrapolation means predicting outside the range of the plotted data and carries the danger that the apparent trend may not continue.
Common mistakes and how to put them right
Claiming that a strong correlation proves one variable causes the other.
Put it right: Correlation does not indicate causation, since a third variable or coincidence may explain the link.
Joining the first and last data points to form the line of best fit.
Put it right: Draw an estimated line through the middle of all the points so that the numbers above and below are roughly balanced.
Treating an extrapolated prediction as equally trustworthy as an interpolated one.
Put it right: Recognise that extrapolation goes beyond the plotted range, where the apparent trend may change.
Exam tips
- When asked to describe correlation, state both its strength and direction, for example strong positive or weak negative, rather than just saying it is correlated.
- When drawing a line of best fit, check that roughly equal numbers of points lie on each side and that the line follows the overall slope, not just the extreme points.
- When making a prediction, show on the graph how you read from the axis to the line and then to the other axis, and comment on whether the prediction is interpolation or extrapolation.
Try the lesson
The start of the Statistics: know that it does not indicate causation draw estimated lines of best fit make predictions interpolate and extrapolate apparent trends whilst knowing the dangers of so doing lesson, made from checked teaching notes for this specification point.
Have a go first
A scatter graph shows the number of hours spent revising and the mark scored in a test for 20 students. The points lie close to a straight line that slopes upwards. Which statement best describes what this pattern shows?
Listen
A scatter graph plots paired bivariate data as points. Correlation describes how closely the points follow a pattern, but correlation does not indicate causation: a strong link between two variables does not prove one causes the other, because a third variable may drive both. To draw an estimated line of best fit, place a straight line through the middle of the points, with roughly equal numbers above and below and the same overall slope. Use it to make predictions: read across from a value on one axis to the line, then down to the other axis. Interpolation predicts inside the plotted data range and is usually reliable. Extrapolation predicts outside that range and is risky, because the apparent trend may not continue. A strong answer earns marks for these points. Correlation between two variables does not indicate causation; a strong association does not prove that one variable causes the other. An estimated line of best fit is drawn through the middle of the plotted points, balancing points above and below and following the overall trend. Predictions are made by reading from a given value on one axis to the line of best fit and then across to the other axis. Interpolation means predicting within the range of the plotted data and is generally more reliable than extrapolation. A common slip: Claiming that a strong correlation proves one variable causes the other. Instead, correlation does not indicate causation, since a third variable or coincidence may explain the link. Exam tip: When asked to describe correlation, state both its strength and direction, for example strong positive or weak negative, rather than just saying it is correlated.
See it
Key words
Say what each word means before you turn the card.
Correlation
Try answering aloud or in your head before turning the card.
Estimated line of best fit
Try answering aloud or in your head before turning the card.
Interpolation
Try answering aloud or in your head before turning the card.
Extrapolation
Try answering aloud or in your head before turning the card.
See every definition
- Correlation
- Describes how closely the points follow a pattern, but does not indicate causation, because a strong link between two variables does not prove one causes the other.
- Estimated line of best fit
- A straight line placed through the middle of the points, with roughly equal numbers above and below and the same overall slope.
- Interpolation
- Predicting inside the plotted data range, which is usually reliable.
- Extrapolation
- Predicting outside the plotted data range, which is risky because the apparent trend may not continue.
Label the diagram
Some boxes have lost their names. Pick the right name for each number.
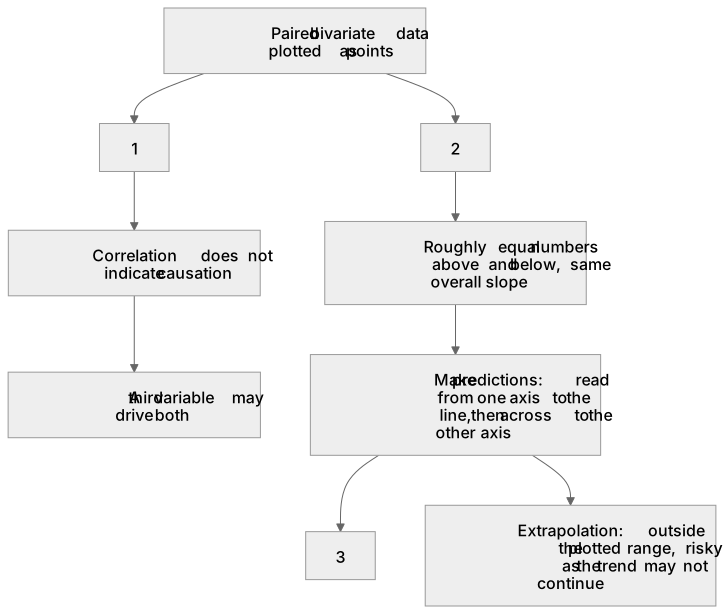
1Box 1
2Box 2
3Box 3
There is more to this lesson
The full lesson goes on to check your understanding and help you earn the marks. Create a free account to carry on, with your progress saved.
A week of Premium from your first lesson · Then the free plan continues · No card, no charge
Test your understanding of Statistics: know that it does not indicate causation draw estimated lines of best fit make predictions interpolate and extrapolate apparent trends whilst knowing the dangers of so doing
Active recall beats re-reading. Take an instant quiz now to test what you’ve learned and lock it into long-term memory.
A week of Premium from your first lesson · Then the free plan continues · No card, no charge