AQA · GCSE · Mathematics
Course version: 8300 · Version from Sept 2015
Statistics: use and interpret scatter graphs of bivariate data recognise correlation
A scatter graph plots paired bivariate data, one variable on the horizontal axis and the other on the vertical axis, with each point representing one item.
- 3 key terms
Study notes
From the checked teaching notes for this specification point.
The idea
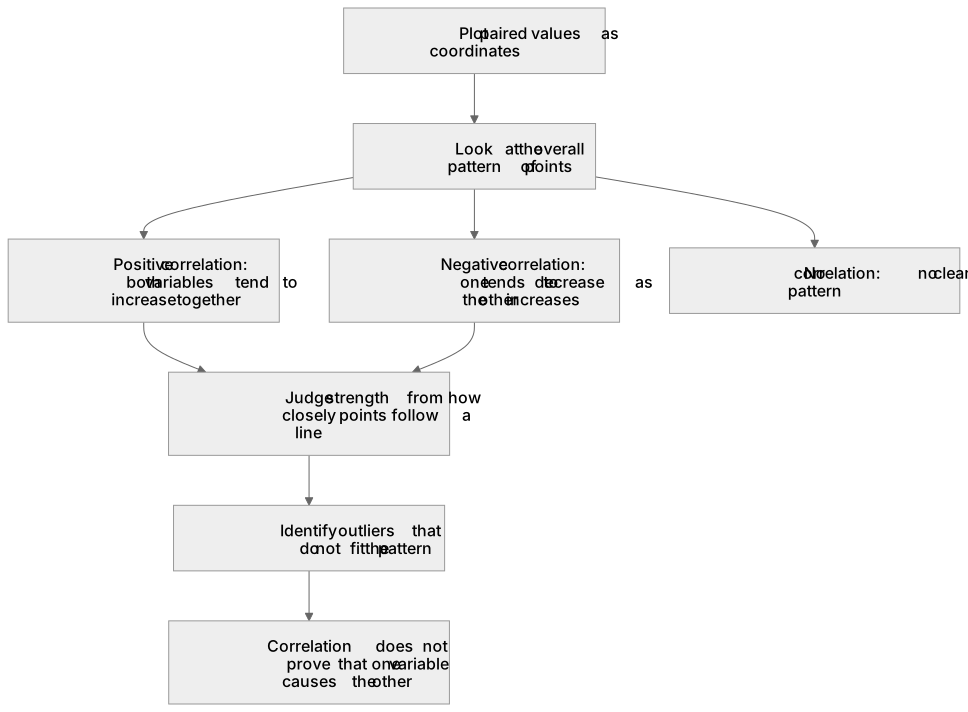
A scatter graph plots paired bivariate data, one variable on the horizontal axis and the other on the vertical axis, with each point representing one item. To use and interpret it, you plot the points, look at the overall pattern, and decide whether there is correlation: positive correlation when both variables tend to increase together, negative correlation when one tends to decrease as the other increases, and no correlation when there is no clear pattern. You also judge the strength of correlation from how closely points follow a line, and identify outliers that do not fit the pattern.
For example: Plotting hours revised against test score may show positive correlation, but correlation does not prove that one variable causes the other.
What earns the marks
- Correctly plots or reads paired values as coordinates on a scatter graph.
- Identifies the type of correlation as positive, negative or none from the overall pattern of points.
- Describes the strength of correlation, for example strong or weak, from how closely points cluster around a line.
- Recognises outliers and explains that correlation does not imply causation.
Common mistakes and how to put them right
Confusing the axes and plotting the variables the wrong way round.
Put it right: Check the axis labels and plot each pair consistently.
Calling any upward trend 'strong' without checking how closely points follow a line.
Put it right: Describe strength separately from direction.
Claiming that correlation proves cause and effect.
Put it right: State that correlation shows a relationship but does not establish causation.
Exam tips
- Read the axis labels and scales carefully before choosing an answer about the relationship.
- Eliminate options that confuse direction with strength, or that claim causation from correlation alone.
- If a graph is described in words, sketch a quick mental picture of the point pattern to test each option.
Try the lesson
The start of the Statistics: use and interpret scatter graphs of bivariate data recognise correlation lesson, made from checked teaching notes for this specification point.
Have a go first
A scatter graph plots the number of hours of sunshine against the number of ice creams sold on the same day. The points lie close to a straight line going upwards from left to right. What type of correlation does the scatter graph show?
Listen
A scatter graph plots paired bivariate data, one variable on the horizontal axis and the other on the vertical axis, with each point representing one item. To use and interpret it, you plot the points, look at the overall pattern, and decide whether there is correlation: positive correlation when both variables tend to increase together, negative correlation when one tends to decrease as the other increases, and no correlation when there is no clear pattern. You also judge the strength of correlation from how closely points follow a line, and identify outliers that do not fit the pattern. For example, plotting hours revised against test score may show positive correlation, but correlation does not prove that one variable causes the other. A strong answer earns marks for these points. Correctly plots or reads paired values as coordinates on a scatter graph. Identifies the type of correlation as positive, negative or none from the overall pattern of points. Describes the strength of correlation, for example strong or weak, from how closely points cluster around a line. Recognises outliers and explains that correlation does not imply causation. A common slip: Confusing the axes and plotting the variables the wrong way round. Instead, check the axis labels and plot each pair consistently. Exam tip: Read the axis labels and scales carefully before choosing an answer about the relationship.
See it
Key words
Say what each word means before you turn the card.
Scatter graphs
Try answering aloud or in your head before turning the card.
Correlation
Try answering aloud or in your head before turning the card.
Outliers and causation
Try answering aloud or in your head before turning the card.
See every definition
- Scatter graphs
- A graph that plots paired bivariate data, one variable on the horizontal axis and the other on the vertical axis, with each point representing one item.
- Correlation
- Positive when both variables tend to increase together, negative when one tends to decrease as the other increases, and none when there is no clear pattern.
- Outliers and causation
- Outliers do not fit the pattern, and correlation does not prove that one variable causes the other.
Label the diagram
Some boxes have lost their names. Pick the right name for each number.
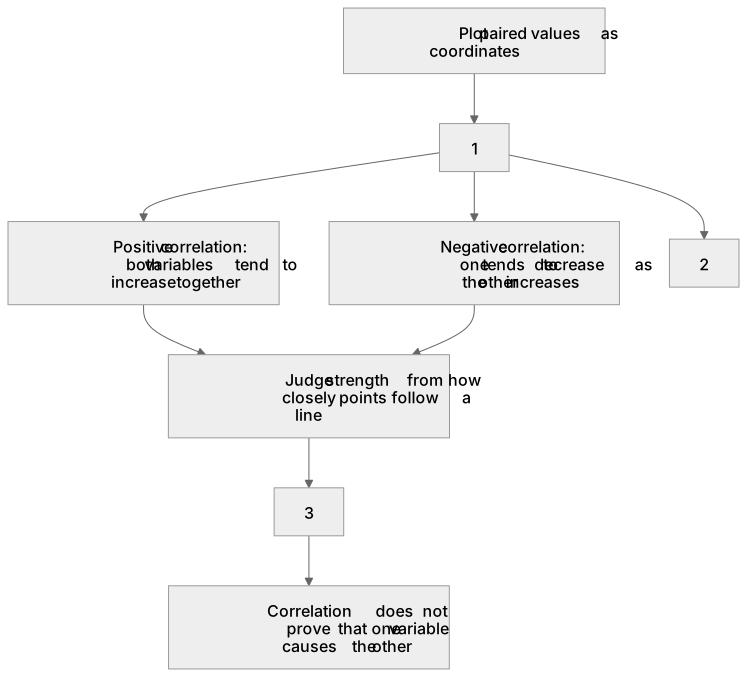
1Box 1
2Box 2
3Box 3
There is more to this lesson
The full lesson goes on to check your understanding and help you earn the marks. Create a free account to carry on, with your progress saved.
A week of Premium from your first lesson · Then the free plan continues · No card, no charge
Test your understanding of Statistics: use and interpret scatter graphs of bivariate data recognise correlation
Active recall beats re-reading. Take an instant quiz now to test what you’ve learned and lock it into long-term memory.
A week of Premium from your first lesson · Then the free plan continues · No card, no charge