Pearson Edexcel · A-Level · Mathematics
Course version: 9MA0 · Version from Mar 2026
Select an appropriate probability distribution for a context, with appropriate reasoning, including recognising when the binomial or Normal model may not be appropriate
Choosing a probability distribution is a high-value Paper 3 modelling skill. Learn to separate counts from measurements, test the assumptions behind Binomial and Normal models, and explain your judgement in the exact context. The payoff is quick, reliable marks before any calculator work begins.
- 10 min read
- 4 worked examples
- 6 practice questions
- 9 key terms
Check what you remember
Read the wording for your board, then hide it and explain random variable in your own words. Rough notes are fine. This is a self-check, with no mark or grade.
Reference: Pearson Edexcel
A variable whose numerical value is determined by the outcome of a random process.
Study Notes

Overview
Specification reference: Pearson Edexcel A Level Mathematics 9MA0, 4.3. This is a decision-making topic, not a formula-hunting topic. In a Paper 3 context, candidates are given a situation and must decide whether a Binomial, Normal, or no model is justified. The highest-value phrase is not simply “use a Binomial distribution”. It is “a Binomial model is suitable because ...”, followed by the assumptions that the context really meets.
Pearson expects you to select an appropriate probability distribution and recognise when the Binomial or Normal model is inappropriate. That means you must identify the type of variable first. Counts, such as the number of defective bulbs in 40 inspected bulbs, are discrete. Measurements, such as packet mass, time, or height, are continuous. A count may fit a Binomial model only when four conditions hold. A continuous measurement may fit a Normal model only when the distribution is plausibly symmetric and bell-shaped in context. Do not force a model onto data just because a question mentions probability.
On Paper 3, this material connects probability, data presentation, statistical sampling and hypothesis testing. Typical question styles ask you to state a model with parameters, justify it using the context, identify a broken assumption, decide whether a Normal approximation is sensible, or use continuity correction. Paper 3 is 2 hours for 100 marks, so use approximately 1.2 minutes per mark. A 3-mark “state and justify” item should normally take no more than four minutes.
Key Concepts
Concept 1: Start with the random variable
Define what is being counted or measured before selecting a model. Write a sentence such as: “Let (X) be the number of customers, out of 30 selected customers, who renew their subscription.” That wording makes (X) a count, so its possible values are 0, 1, 2, ..., 30. This is a discrete random variable. By contrast, “Let (T) be the time in minutes taken by a customer to complete checkout” is continuous, because any value in an interval is possible.
The model must describe the variable, not merely the setting. “Customers” does not automatically mean Binomial. Counting customers who renew could be Binomial. Measuring their waiting times could be Normal. Recording their preferred payment method is neither a continuous measurement nor necessarily a two-outcome experiment.
Examiner test: ask “Can the answer be 4.7?” If no, the variable is likely discrete. Ask “Is the variable a measured quantity which could take any value in a range?” If yes, Normal may be a possibility.

Figure 1. A Binomial model allocates probability to separate integer counts. A Normal model is continuous, so probability is an area under a smooth curve.
Concept 2: The Binomial model, (X \sim B(n,p))
A Binomial distribution models the number of successes in a fixed number of trials. The word “success” is just the category you choose to count. It could mean a bulb is defective, a student passes, or a customer clicks an advert. Success does not mean desirable.
Before using (X \sim B(n,p)), test all four conditions:
- Fixed number of trials: there are exactly (n) opportunities.
- Binary outcome: each trial is classified as success or failure, with no third category.
- Independent trials: one result does not alter another result’s chance.
- Constant probability: the success probability is the same (p) on every trial.
For example, a factory independently checks 25 components from a vast production run, with each component having a 0.04 probability of being defective. If (X) is the number defective, (X \sim B(25,0.04)) is reasonable. The number is fixed, each component is defective or not defective, the checks are independent, and (p) is treated as constant.
A common trap is sampling without replacement from a small population. Suppose eight cards are drawn without replacement from a pack containing winners and non-winners. Once a winner is drawn, fewer winners remain, so both independence and constant (p) fail. A Binomial model is not exact. In a 3-mark explanation, candidates should name the broken assumption and connect it to the context: “The draws are not independent because the card is not replaced, so the probability of a winning card changes after each draw.”
Concept 3: The Normal model, (X \sim N(\mu,\sigma^2))
The Normal distribution is a continuous, symmetric, bell-shaped model. It is described by a mean (\mu), which sets the centre, and a variance (\sigma^2), which sets the spread. The standard deviation is (\sigma), not (\sigma^2). Pearson uses the notation (N(\mu,\sigma^2)), while many calculators ask for (\sigma). Write the square root before typing anything into Normal CD.
A Normal model is plausible when the variable is a continuous measurement and the population is reasonably symmetric and unimodal, with no severe outliers or hard boundary causing pronounced skew. Human heights within a sufficiently homogeneous group often provide a plausible model. The times taken to finish a race may not: times cannot be negative and may have a long right tail. The number of sixes in 20 dice throws is not Normal as the original model because it is a discrete count. That count could, under suitable conditions, be approximated by a Normal distribution, but that is a separate claim.
For a continuous variable, (P(X=a)=0). Therefore (P(X<a)=P(X\leq a)). This is unlike a discrete Binomial variable, where (P(X<6)=P(X\leq5)). Credit is given for recognising this difference when translating words into probability notation.
Concept 4: When a Normal approximation to Binomial is justified
Pearson states that (B(n,p)) may be approximated by (N(np,np(1-p))) when (n) is large and (p) is close to 0.5. State both points in a justification. A useful numerical check is that both (np) and (n(1-p)) should be comfortably above 5. This helps identify a distribution that is not too skewed, but the course wording to use is still “(n) is large and (p) is close to 0.5”.
If (p) is near 0 or 1, a Binomial distribution is skewed. For example, (B(80,0.03)) has (np=2.4), so a symmetric Normal curve would be a poor match. Do not write “(n) is large, therefore use Normal” without checking (p). The approximation also fails as a starting point if the original Binomial conditions fail.
When the approximation is appropriate, set (Y\sim N(np,np(1-p))). The mean and variance come from the Binomial distribution. The final essential step is acontinuity correction, because a discrete count is being replaced by a continuous curve.

Figure 2. Use the context to test the model before calculating.
Concept 5: Continuity correction
Each integer value of a Binomial count represents a bar of width 1 on a graph. A Normal curve has no gaps, so move each boundary by half a unit to capture the same region. For (Y), the Normal approximation to (X):
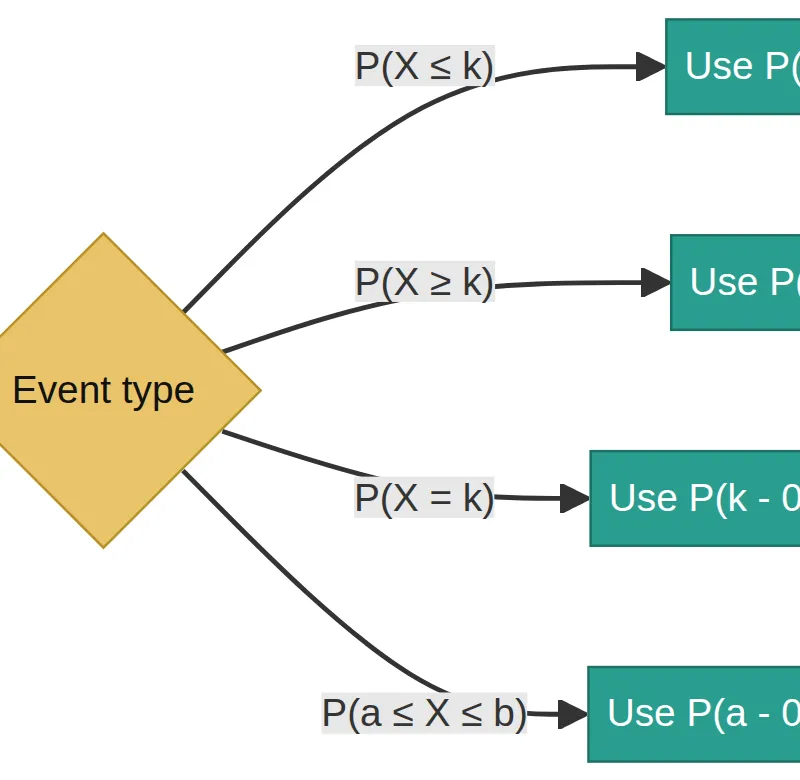
- (P(X\leq k)) becomes (P(Y<k+0.5)).
- (P(X\geq k)) becomes (P(Y>k-0.5)).
- (P(X=k)) becomes (P(k-0.5<Y<k+0.5)).
- (P(a\leq X\leq b)) becomes (P(a-0.5<Y<b+0.5)).
Do not apply a continuity correction to a variable that was originally Normal. It is only used when you are approximating a discrete distribution with a continuous one. A quick sketch of bars centred on the integers prevents the most common sign error.
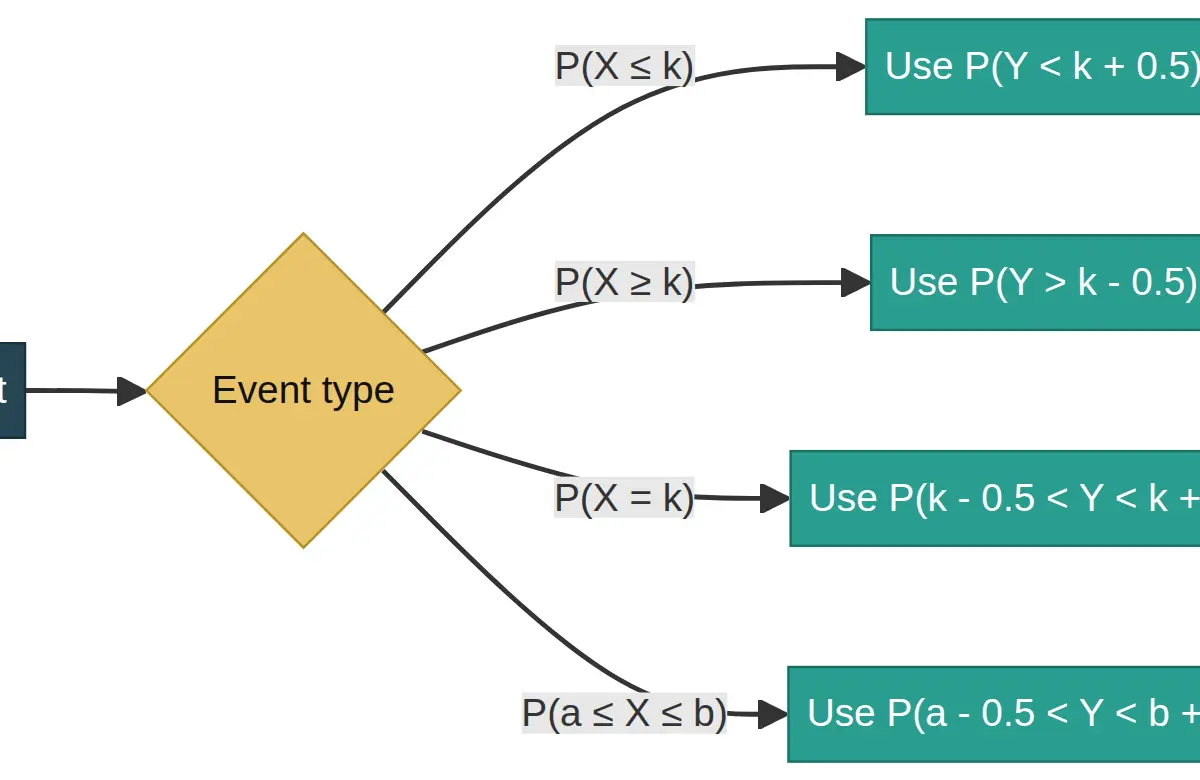
Figure 3. Translate the exact discrete event before using Normal CD.
Mathematical Relationships
Binomial probability:(P(X=x)=\binom{n}{x}p^x(1-p)^{n-x}), where (n) is the number of trials, (x) is the number of successes, and (p) is the probability of success.Given on the Pearson formulae booklet. In practice, calculator Binomial PD and Binomial CD are expected, but write the probability statement first so method marks remain visible.
Binomial mean and variance:(E(X)=np) and (\operatorname{Var}(X)=np(1-p)).Given on the Pearson formulae booklet. These establish the parameters for a Normal approximation.
Normal notation: (X\sim N(\mu,\sigma^2)). Here (\mu) is the mean and (\sigma=\sqrt{\sigma^2}) is the standard deviation. Notation and the Normal distribution form are provided in the Pearson booklet; the interpretation must be understood.
Standardisation: (Z=\dfrac{X-\mu}{\sigma}). Must be understood and used, even if a calculator handles the arithmetic. It explains why a raw observation is compared to the mean in units of standard deviation.
Normal approximation:if suitable, (X\sim B(n,p)) is approximated by (Y\sim N(np,np(1-p))).Must be understood, including the conditions and continuity correction.
Practical Applications and Modelling Judgement
Quality control often creates Binomial contexts. Count the number of defective items in a fixed random sample, then check whether each item can be treated as independent with a stable defect probability. Large, well-mixed production runs make that assumption more credible than a short batch from one faulty machine.
Normal models occur in measurement contexts, including component lengths, packet masses, heights, and instrument error. The practical question is not “does the graph look like a perfect bell?” No real sample does. Ask whether a symmetric, single-peaked approximation is sensible for the decision being made. Strong skew, two distinct groups, an obvious ceiling or floor, or extreme outliers are reasons to challenge the model.
In every model-selection answer, make your assumption visible. The mark is often earned by the phrase after “because”. A candidate who gives correct parameters but no contextual reason risks losing the justification mark. A candidate who identifies a broken assumption and explains its effect has shown the critical modelling judgement required by 4.3.
Calculator discipline
For Binomial CD, write the event in cumulative form first. “At least 6” means (P(X\geq6)=1-P(X\leq5)). For a Normal calculation, write (\sigma=\sqrt{\sigma^2}) and show the continuity-corrected boundary if relevant. Record at least four decimal places from the calculator before giving a final answer, usually to three significant figures unless the question says otherwise.
Audio revision podcast
Use this 10-minute tutor-led recap before a Paper 3 practice session, then complete the quick-fire recall questions without looking at the guide.
Sources used
The authoritative curriculum statements, Paper 3 timing and formulae-booklet guidance are from Pearson Edexcel’s A Level Mathematics Specification, Issue 4 and Mathematical Formulae and Statistical Tables. See the sources field for direct links.
Visual Resources
3 diagrams and illustrations


Interactive Diagrams
2 interactive diagrams to visualise key concepts
Conceptual Flow Outline
A short model-selection route. The context and assumptions decide the distribution.
Conceptual Flow Outline
Continuity-correction translations for a Normal approximation Y to a Binomial variable X.
Worked Examples
4 worked examples — open one to explore the question and available guidance.
Practice Questions
Try the question, then reveal an answer plan or example response
A school records the number of students, out of 25 selected at random, who cycle to school. The chance that a selected student cycles is treated as 0.28 and selections are independent. State a suitable model. (3 marks)
Hint: Identify the number of trials, what counts as success, and whether BICS holds.
A mobile-phone repair time has a strongly right-skewed distribution because a small number of repairs take many days. Explain why a Normal model may be inappropriate. (2 marks)
Hint: A Normal distribution has a specific shape.
X~B(200,0.45). Explain why a Normal approximation is reasonable and state the approximating distribution. (3 marks)
Hint: Use the specification wording before calculating the parameters.
A box contains 6 red and 14 blue counters. Ten counters are selected without replacement. Explain why the number of red counters selected is not exactly Binomial. (3 marks)
Hint: Track what happens to the red-counter probability after one counter is removed.
X~B(80,0.60). Use a Normal approximation to estimate P(X≥55). (5 marks)
Hint: First write the Normal mean and variance. Then translate ‘at least 55’ using a half-unit boundary.
A data set of adult heights has two clear peaks because it combines two populations. Explain why fitting a single Normal distribution could be misleading. (2 marks)
Hint: Think about how many peaks a Normal curve has.
Exam technique
How to turn what you know into marks
How to approach the question
Underline the random variable, decide count or measurement, then test assumptions before naming a model. For a Binomial answer, write BICS in the margin. For a Normal approximation, check n is large and p is close to 0.5, calculate np and np(1-p), then correct the boundary by 0.5.
How to structure your answer
1 mark: state the model and parameters. 2-3 marks: state the model, then give the specific assumptions and connect them to the context. 4-6 marks involving Normal approximation: show the Normal parameters, standard deviation, continuity-corrected event, calculator/standardisation setup and final probability.
Timing
Paper 3 is 2 hours for 100 marks, so plan roughly 1.2 minutes per mark. Spend 3-4 minutes on a 3-mark model-selection answer and move on once the model plus justification are written.
Common pitfalls
- Using Binomial for a without-replacement sample from a small population. Avoid it by explaining that p changes and trials are dependent.
- Using the variance as the calculator’s standard deviation. Avoid it by writing σ=√(σ²) beside every N(μ,σ²) model.
- Forgetting continuity correction. Avoid it by translating the exact discrete event before any Normal CD calculation.
- Writing a distribution name with no contextual reason. Avoid it by finishing every model sentence with ‘because ...’.
What the command words want
- Compare
- Contrast count versus measurement, or discrete bars versus continuous area, then state the consequence for model choice.
- Explain
- Name the assumption and link it to the context. Use ‘because’, for example ‘p changes because cards are not replaced’.
- Describe
- Identify the distributional feature using precise language such as discrete, continuous, symmetric, skewed or bimodal.
- Evaluate
- Give the model’s supporting assumptions and any limitation, then conclude whether it is reasonable, approximate only, or inappropriate.
- Calculate
- Show the distribution, any Normal parameters, σ, continuity correction and probability statement before calculator output.
- State/Give
- Give the model in full notation with parameters, for example X~B(25,0.28) or M~N(500,36).
Watch or listen (optional)
Test your understanding of Select an appropriate probability distribution for a context, with appropriate reasoning, including recognising when the binomial or Normal model may not be appropriate
Active recall beats re-reading. Take an instant quiz now to test what you’ve learned and lock it into long-term memory.
7 days Premium · Then the free plan continues · No card, no charge