Pearson Edexcel · A-Level · Mathematics
Course version: 9MA0 · Version from Mar 2026
Understand the effect of simple transformations on the graph of y = f(x), including sketching associated graphs: y = af(x), y = f(x) + a, y = f(x + a), y = f(ax) and combinations of these transformations
Graph transformations turn a familiar curve into a new graph by moving its coordinates in predictable ways. This Pearson Edexcel 2.9 guide turns the usual sign-confusion into a mark-winning routine: track key features, transform them accurately, then sketch the right shape.
- 10 min read
- 3 worked examples
- 5 practice questions
- 8 key terms
Check what you remember
Read the wording for your board, then hide it and explain Translation in your own words. Rough notes are fine. This is a self-check, with no mark or grade.
Reference: Pearson Edexcel
A transformation that moves every point by the same vector without changing the graph’s shape, size or orientation.
Study Notes
Overview
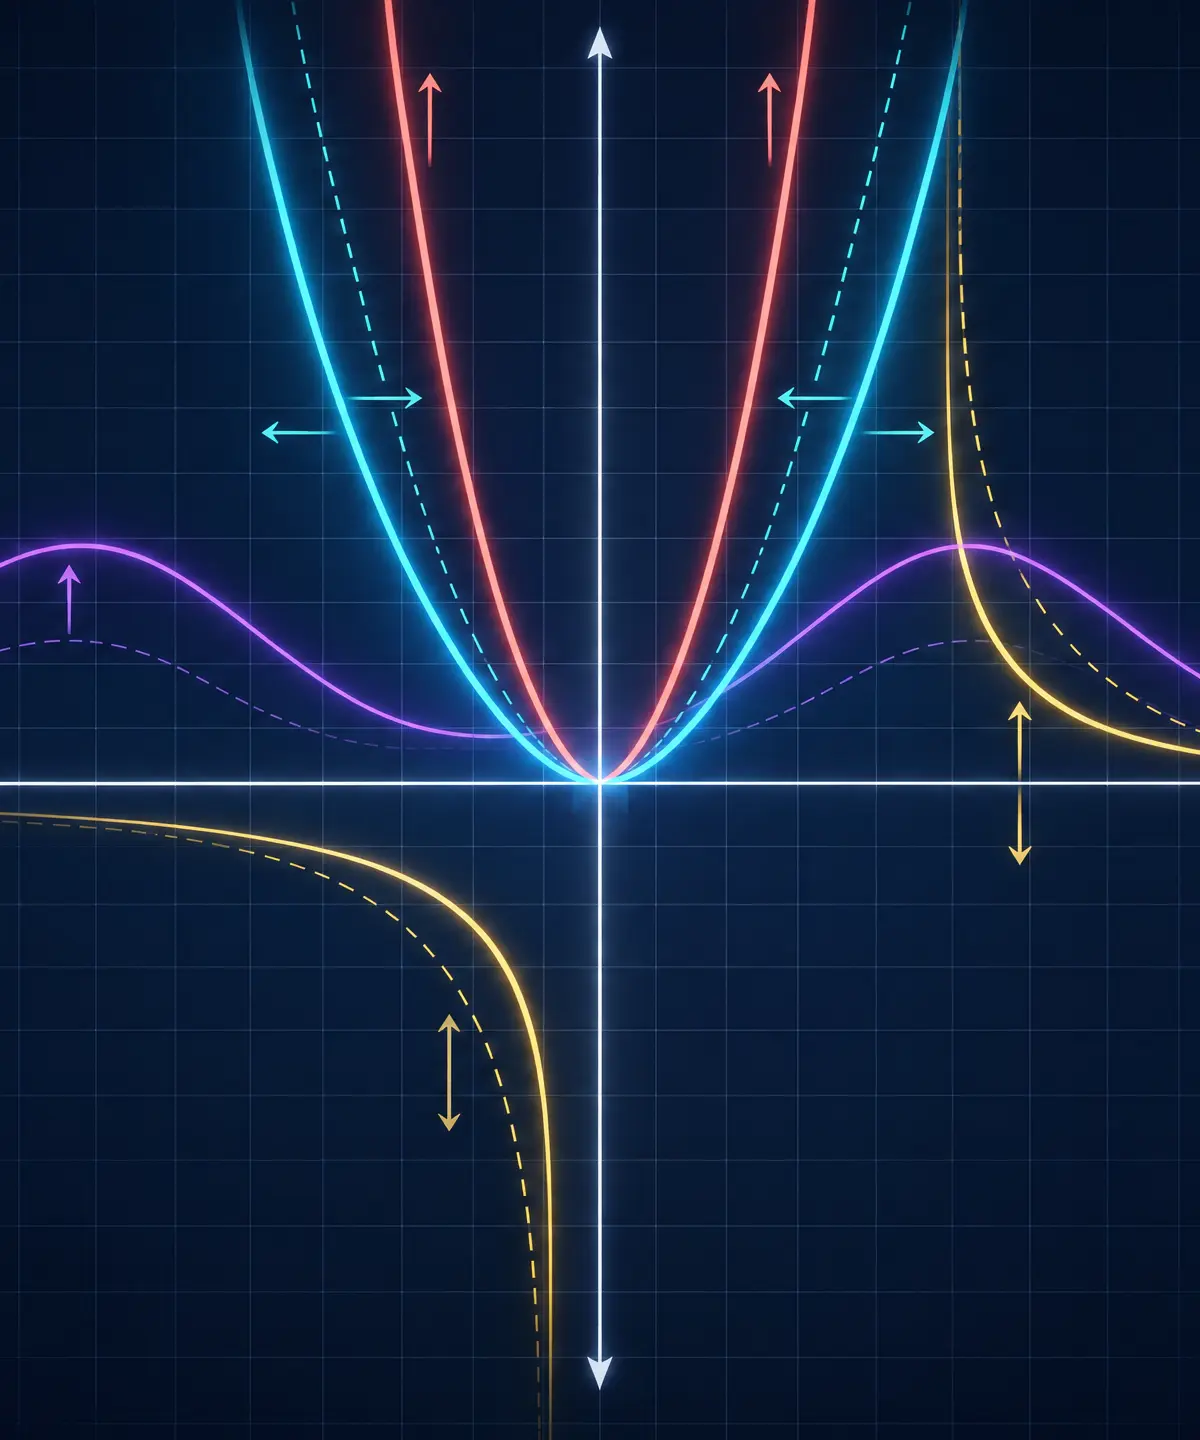
Graph transformations are a high-return sketching topic because a candidate can earn several marks without expanding an expression. Pearson Edexcel specification point 2.9 requires you to start with a known graph, such as a quadratic, cubic, reciprocal, trigonometric or exponential curve, and create a correct sketch after translations, stretches, reflections and combinations. The mathematical idea is simple: every feature has coordinates, so a transformation tells you exactly how those coordinates move.
In a Pure Mathematics paper, these skills are often embedded inside a larger question. You may be given a graph of (y=f(x)), asked to sketch (y=2f(3x)), identify new asymptotes, or compare (|f(x)|) with (|f(-x)|). Marks are awarded for accurate movement of turning points, roots, intercepts and asymptotes, then for a plausible curve of the right shape. A labelled rough sketch is enough: it does not need a perfect scale, but it must be mathematically unambiguous.
Specification focus: Pearson Edexcel A-Level Mathematics (9MA0), Section 2.9: (y=af(x)), (y=f(x)+a), (y=f(x+a)), (y=f(ax)), their combinations, (|f(x)|) and (|f(-x)|).
Key Concepts
1. Outside the function changes (y)-coordinates
In (y=af(x)), the multiplier is outside (f). For every point ((x,y)) on (y=f(x)), the new point is ((x,ay)). The (x)-coordinate stays fixed. If (|a|>1), the graph is stretched parallel to the (y)-axis. If (0<|a|<1), it is compressed, often called a vertical squash. If (a<0), there is also a reflection in the (x)-axis because every (y)-value changes sign.
For example, if ((3,-2)) lies on (y=f(x)), then it becomes ((3,-6)) on (y=3f(x)), and ((3,1)) on (y=-\tfrac12 f(x)). Any root stays a root under a non-zero vertical stretch because (a\times0=0). A horizontal asymptote (y=c), however, becomes (y=ac). This distinction earns marks in reciprocal and exponential sketches.
Memory hook: outside means outward, up/down. Look outside the bracket and alter (y).
2. Adding outside the function translates vertically
For (y=f(x)+a), every point moves from ((x,y)) to ((x,y+a)). For positive (a), translate the graph up; for negative (a), translate it down. The shape, horizontal positions of points and vertical distances are unchanged.
A common examiner-tested example is (y=3+\sin 2x). The (+3) moves the sine wave’s midline from (y=0) to (y=3). It does not change amplitude or period. A reciprocal graph (y=\frac{1}{x}) becomes (y=\frac{1}{x}+4), so its horizontal asymptote moves from (y=0) to (y=4). When a candidate moves a vertical asymptote for an outside addition, credit is not given: it has no reason to move.
3. Inside the function changes (x)-coordinates, so direction reverses
For (y=f(x+a)), the new point is ((x-a,y)). Positive (a) therefore moves the graph left by (a), not right. The reversal happens because the input must become (a) larger to make the function produce the same old output. If the original feature occurred at input (x=p), solve (x+a=p), giving (x=p-a).
For example, the vertex of (y=x^2) is ((0,0)). The vertex of (y=(x+4)^2=f(x+4)) is ((-4,0)), which is four left. Do not rely on a vague phrase such as “plus means right”. Instead, either use the coordinate rule or ask which new (x) gives the old input. This is the most dependable way to avoid the most common error in this topic.
4. Multiplying the input changes width
For (y=f(ax)), divide every old (x)-coordinate by (a): ((x,y)\mapsto(\frac{x}{a},y)). If (|a|>1), the graph is compressed horizontally by scale factor (\frac1{|a|}), usually described in Edexcel answers as a stretch parallel to the (x)-axis with scale factor (\frac1{|a|}). If (0<|a|<1), the graph stretches horizontally. If (a<0), include a reflection in the (y)-axis.
Take (y=f(4x)). A root at (x=8) moves to (x=2), not (x=32). The graph looks narrower because features are pulled towards the (y)-axis. For (y=f(-2x)), first the factor (-2) sends (x) to (-x/2): there is a horizontal compression by factor (\frac12) and a reflection in the (y)-axis.
5. Combinations: track a few features and work in a declared order
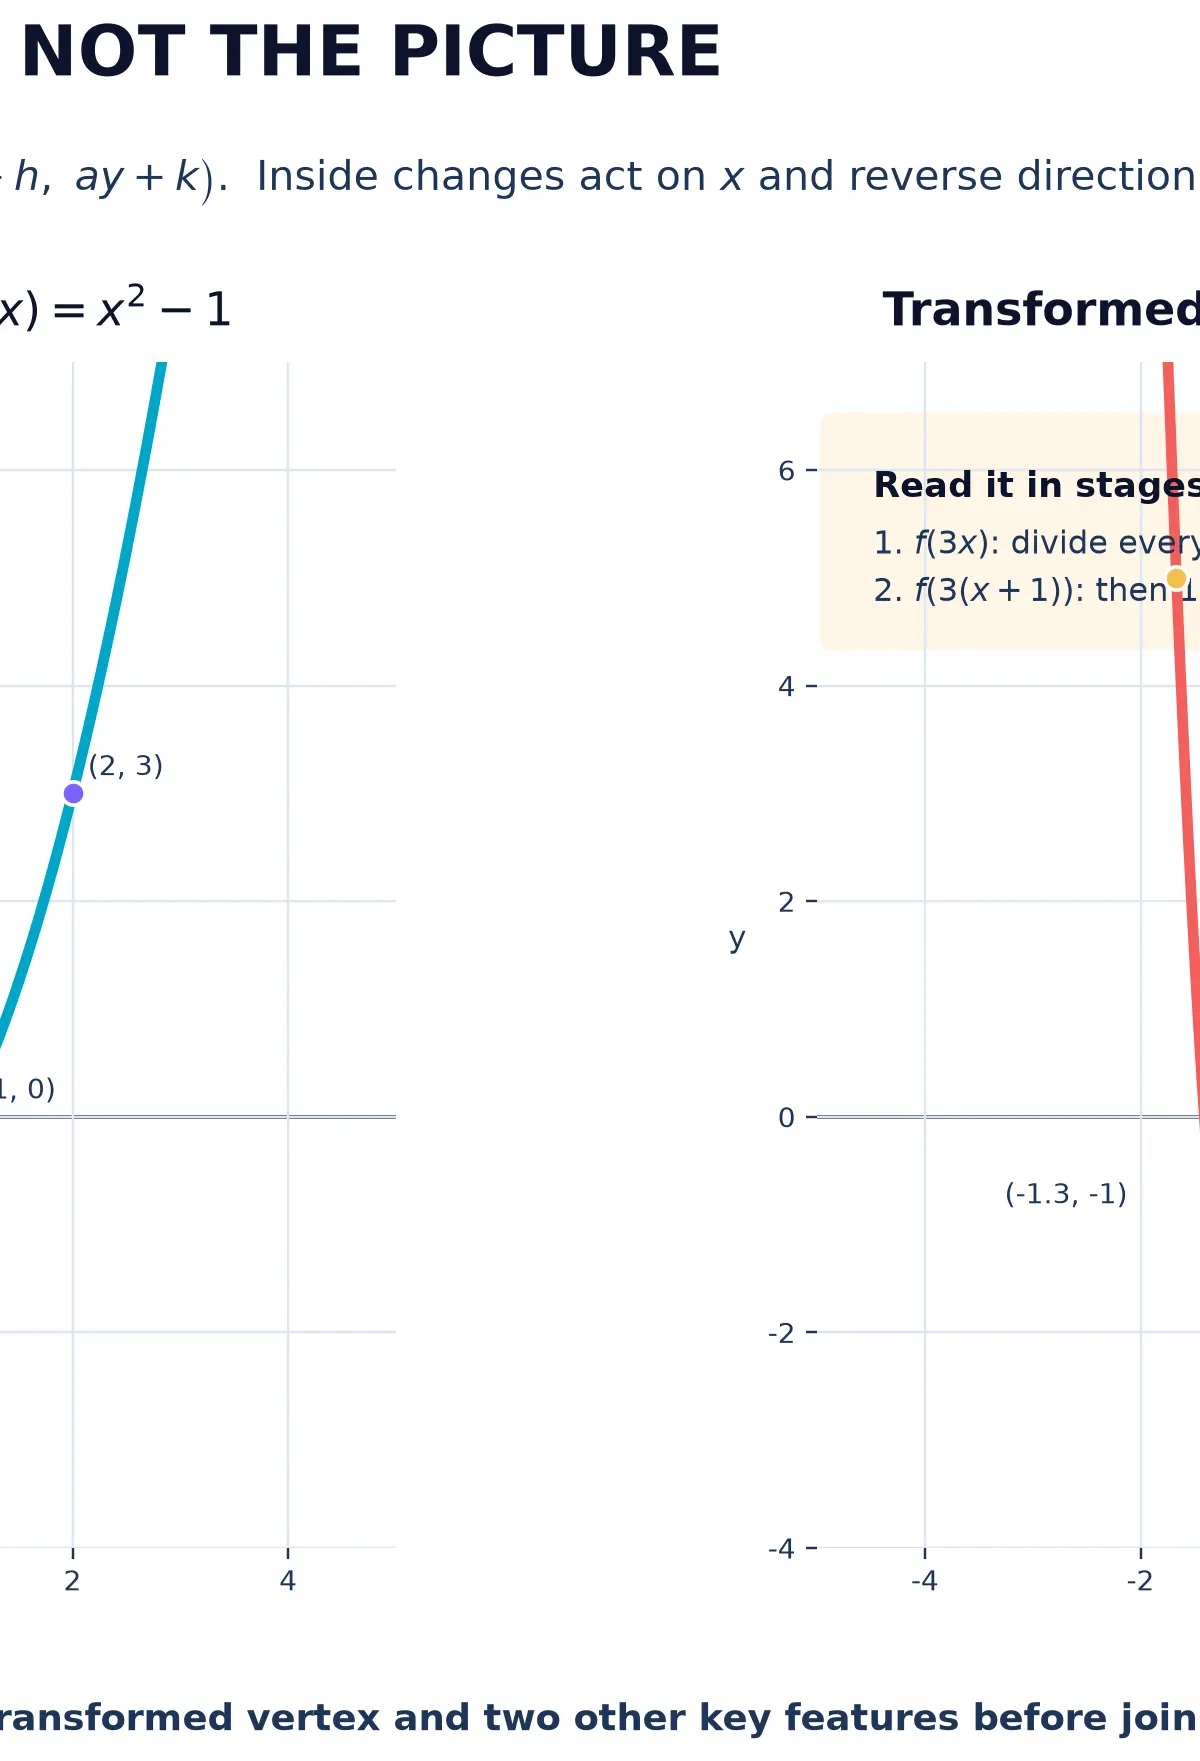
The safest method is to separate the expression into stages. In (y=2f(3(x+1))-1), read the inside first: (f(3x)) compresses horizontally by factor (\frac13), then (f(3(x+1))) translates one left. The outside then stretches vertically by factor 2, followed by a translation one down. A point ((x,y)) on the original curve maps to
[
(x,y)\mapsto\left(\frac{x}{3}-1,\ 2y-1\right).
]
For the useful general form (y=A f(B(x+h))+k), use ((x,y)\mapsto(\frac{x}{B}$-h, Ay+k)), provided (A) and (B) are non-zero. This rule is not a formula-sheet result: memorise it by understanding that inputs are solved for, outputs are substituted directly. In an exam, you do not have to quote the mapping if a clearly correct staged sketch is shown.$
When the original curve has asymptotes, transform them as features. If (f) has vertical asymptote (x=p), then (f(B(x+h))) has vertical asymptote (x=\frac{p}{B}-h). If it has horizontal asymptote (y=q), then (Af(B(x+h))+k) has horizontal asymptote (y=Aq+k). Sketch the asymptotes as dotted lines before the curve.
6. Modulus transformations: decide which axis controls the operation
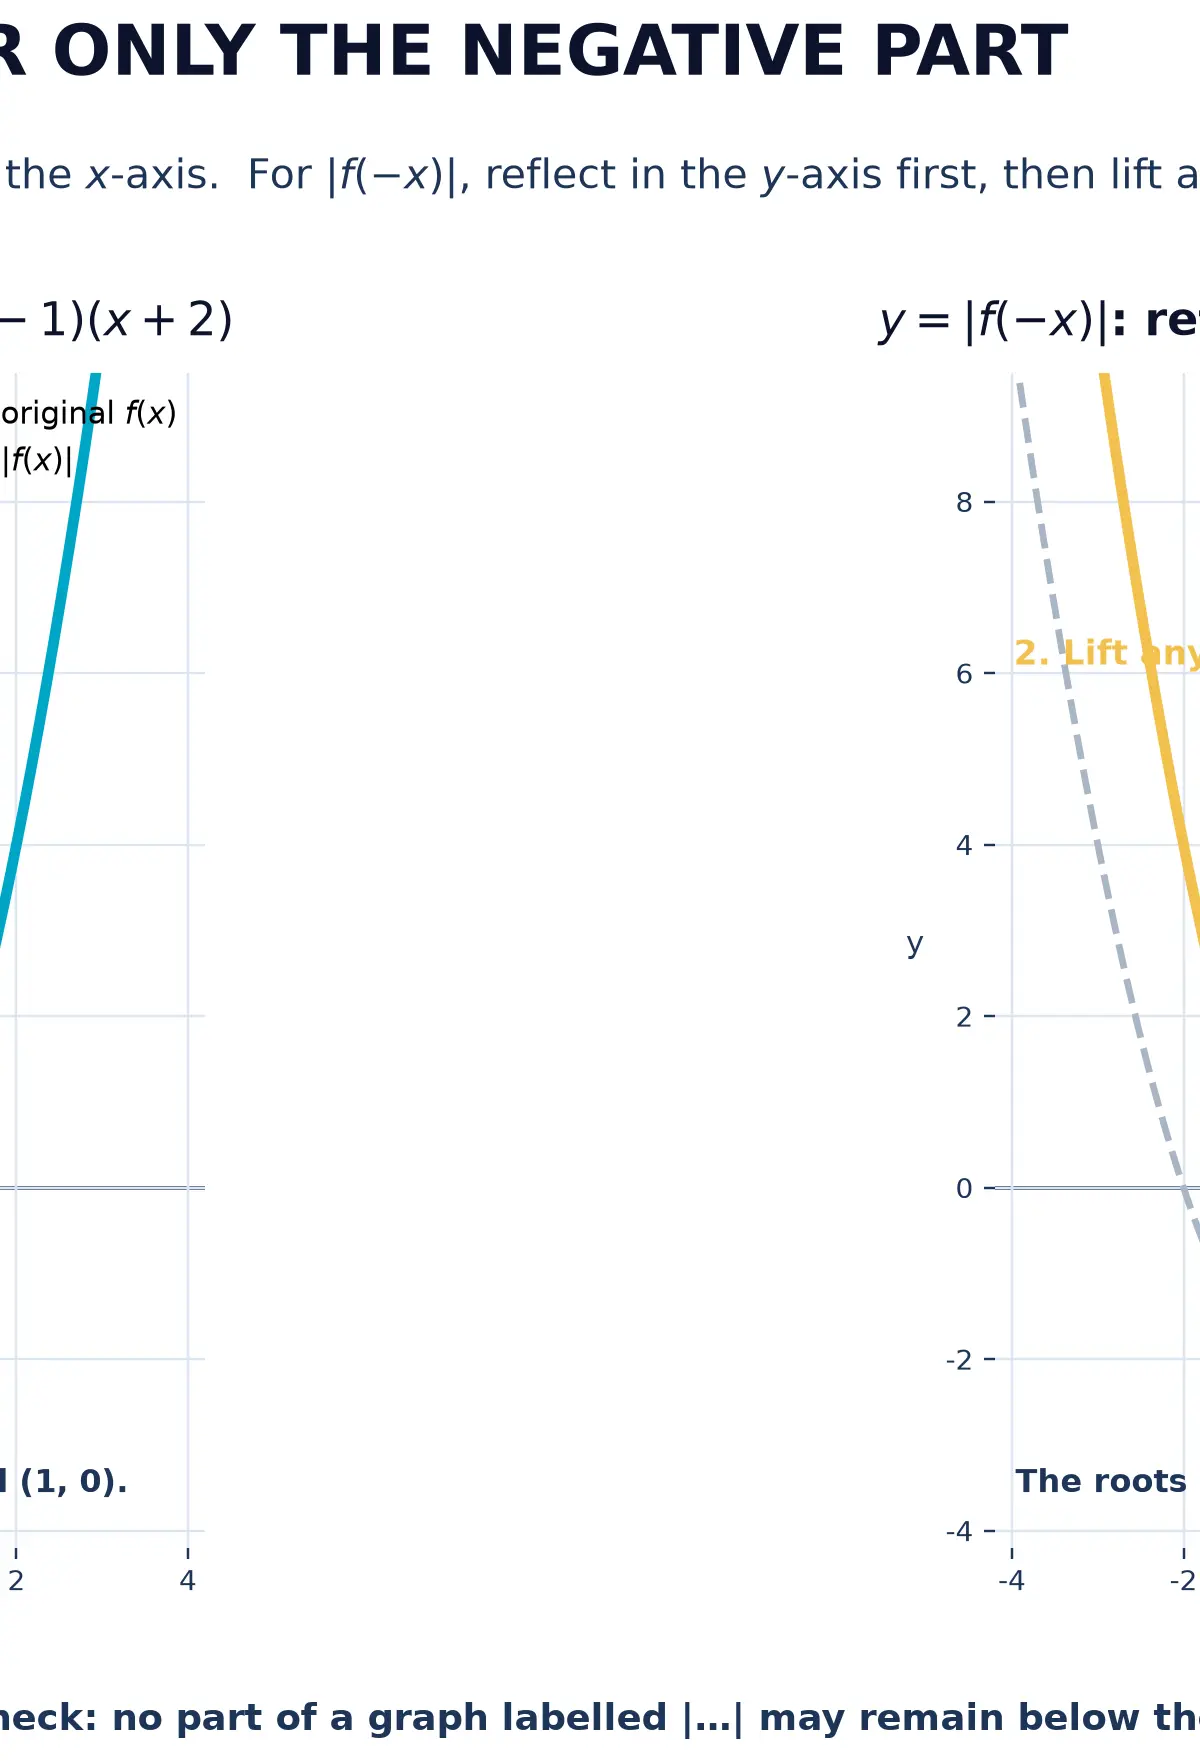
For (y=|f(x)|), retain every part of (f(x)) that is already on or above the (x)-axis. Reflect only the parts below the (x)-axis in the (x)-axis. Roots remain where they are, but a negative minimum becomes a positive maximum with the same magnitude. The finished graph cannot go below (y=0).
For (y=|f(-x)|), first reflect the original graph in the (y)-axis to form (f(-x)). Then apply the modulus, lifting any negative part in the (x)-axis. You can also take (|f(x)|) first and then reflect it in the (y)-axis: the final graph is the same. State a clear route and make the final sketch satisfy both operations.
7. A mark-winning sketch routine
- Name the parent graph and list its features. Record roots, turning points, intercepts, asymptotes, period or endpoints.
- Write the coordinate movement. Use the point rule or show the transformations in stages. This secures method marks even if a final curve has a drawing slip.
- Transform at least three decisive features. For a quadratic, a vertex and two roots are ideal. For a reciprocal, use both asymptotes and one point on each branch.
- Draw the shape last. Preserve the original curve’s continuity, branch position and orientation, unless a reflection or modulus changes it.
- Label transformed features. In a 3- or 4-mark sketch question, labels are the evidence that the construction is intentional rather than guessed.
Mathematical Relationships
All of the following must be memorised. They are not supplied as a dedicated transformation formula on the Edexcel formula booklet.
- Vertical stretch/reflection:(y=af(x)), ((x,y)\mapsto(x,ay)). A negative (a) reflects in the (x)-axis.
- Vertical translation:(y=f(x)+a), ((x,y)\mapsto(x,y+a)).
- Horizontal translation:(y=f(x+a)), ((x,y)\mapsto(x-a,y)). The sign appears reversed in the movement.
- Horizontal stretch/reflection: (y=f(ax)), ((x,y)\mapsto(\frac{x}{a},y)). A negative (a) reflects in the (y)-axis.
- Combined transformation: (y=A f(B(x+h))+k), ((x,y)\mapsto(\frac{x}{B}-h, Ay+k)).
- Modulus: (y=|f(x)|) replaces each negative output (y) by (-y); (y=|f(-x)|) also reverses the (x)-coordinate first.
For trigonometric graphs, remember that (\sin(Bx)) and (\cos(Bx)) have period (\frac{2\pi}{|B|}), while (\tan(Bx)) has period (\frac{\pi}{|B|}). An outside coefficient affects amplitude for sine and cosine, while an inside coefficient affects period. This is a frequent synoptic link between transformations and trigonometric modelling.
Practical Applications and Useful Context
Transformations are the grammar of mathematical models. A tide model may start as a sine curve; changing its mean height uses an outside addition, changing its range uses an outside multiplier, and changing the time scale uses an inside multiplier. In a growth model (y=Ae^{kx}+c), (A) changes vertical scale or reflection, while (c) changes the long-run horizontal asymptote. The same visual reasoning helps you check whether a model makes sense before using algebra or a calculator.
Graph and Data Skills: What a Successful Sketch Shows
Use the scale intelligently rather than mechanically. Start by placing the axes, then choose a few exact features that establish the result. For a quadratic, these are normally the vertex and roots. For a cubic, use roots, turning points and end behaviour. For a sine or cosine curve, mark the midline, maximum, minimum, period and at least one complete cycle. For a reciprocal function, draw the vertical and horizontal asymptotes first, identify which quadrants or regions contain the branches, then add a check point. If the question says sketch, numerical equality of every line spacing is not required, but an intercept on the wrong side of an asymptote is a mathematical error, not a harmless drawing issue.
Coordinate labels should carry the marks. Write ((-1,3)), not merely a dot near the expected place. If a feature is an asymptote, label the whole line as (x=-1) or (y=3), not just one point on it. If an operation leaves a feature unchanged, use that fact efficiently: roots remain at the same (x)-values after (y=af(x)) for non-zero (a), and a vertical translation leaves every (x)-coordinate unchanged. This prevents unnecessary calculation and helps you check your answer.
When a graph is not supplied, sketch the parent function from its known properties before transforming. For (y=e^x), use the point ((0,1)) and horizontal asymptote (y=0). For (y=\frac1x), use its two branches and asymptotes (x=0), (y=0). For (y=\tan x), include vertical asymptotes at (x=\pm\frac\pi2) and the central crossing at the origin. The question is still testing transformations, so recognisable parent-graph features are your starting evidence.
For examination purposes, do not spend time making a display-quality plot. Pearson Edexcel accepts a sketch with clear axes, asymptotes where needed and correctly positioned labelled features. Use a ruler for asymptotes only when it improves clarity. The calculator may help you check a point, but candidates are rewarded for transformation reasoning, not for plotting many decimal coordinates.
Audio Revision Podcast
Use this ten-minute recap after attempting the practice questions. Pause after the quick-fire questions, answer aloud, then replay the relevant section if a direction, axis or asymptote rule was not secure.
Visual Resources
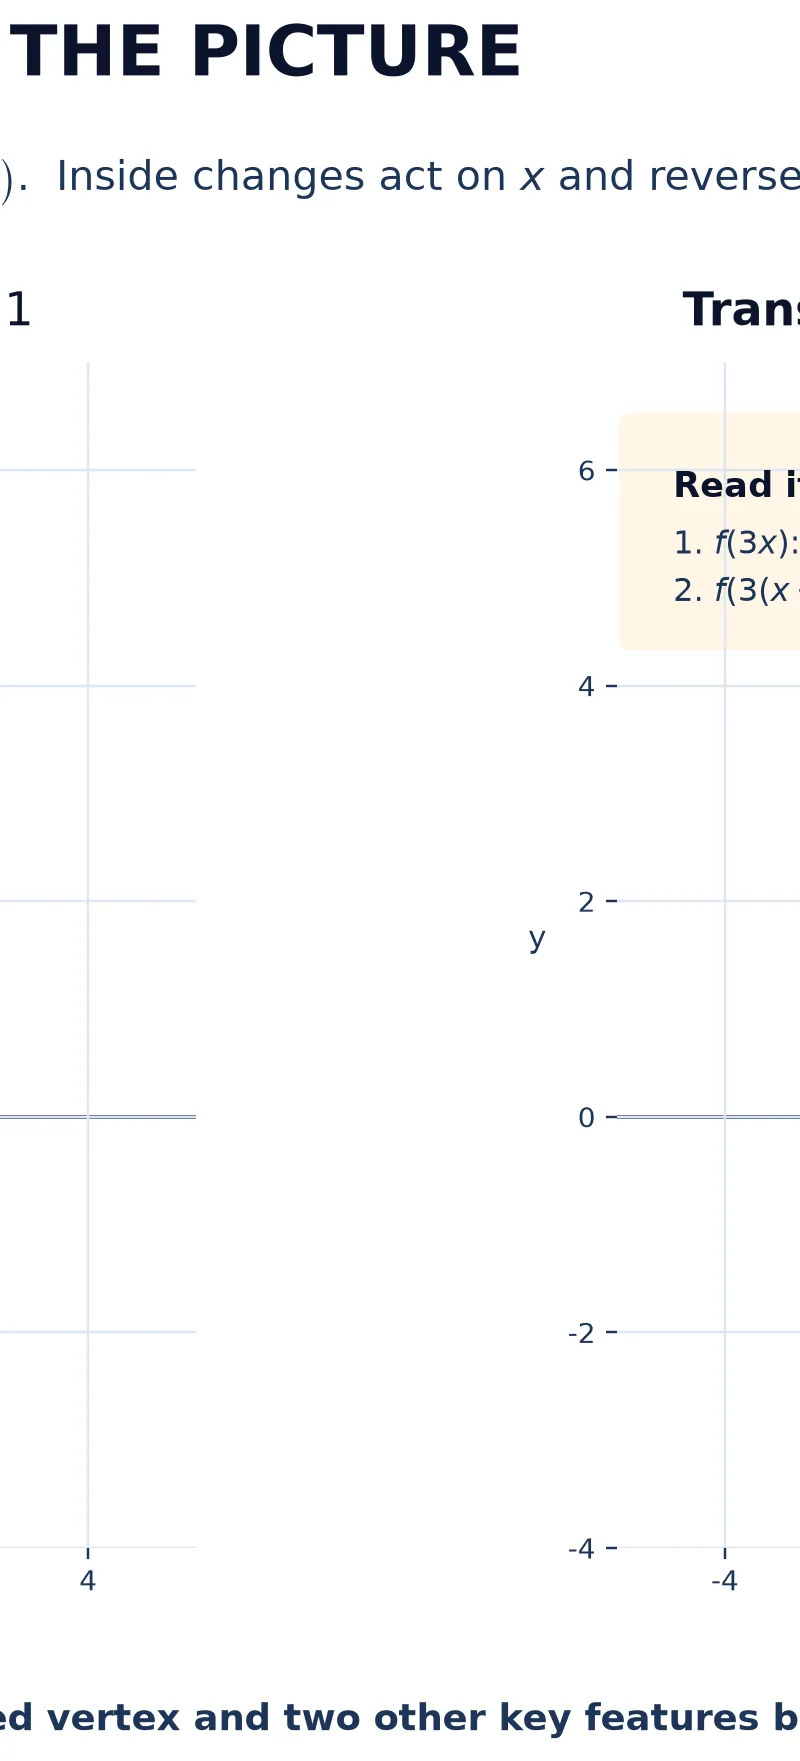
2 diagrams and illustrations
Interactive Diagrams
2 interactive diagrams to visualise key concepts
Conceptual Flow Outline
A reliable exam workflow for constructing a transformation sketch from features rather than guesswork.
Conceptual Flow Outline
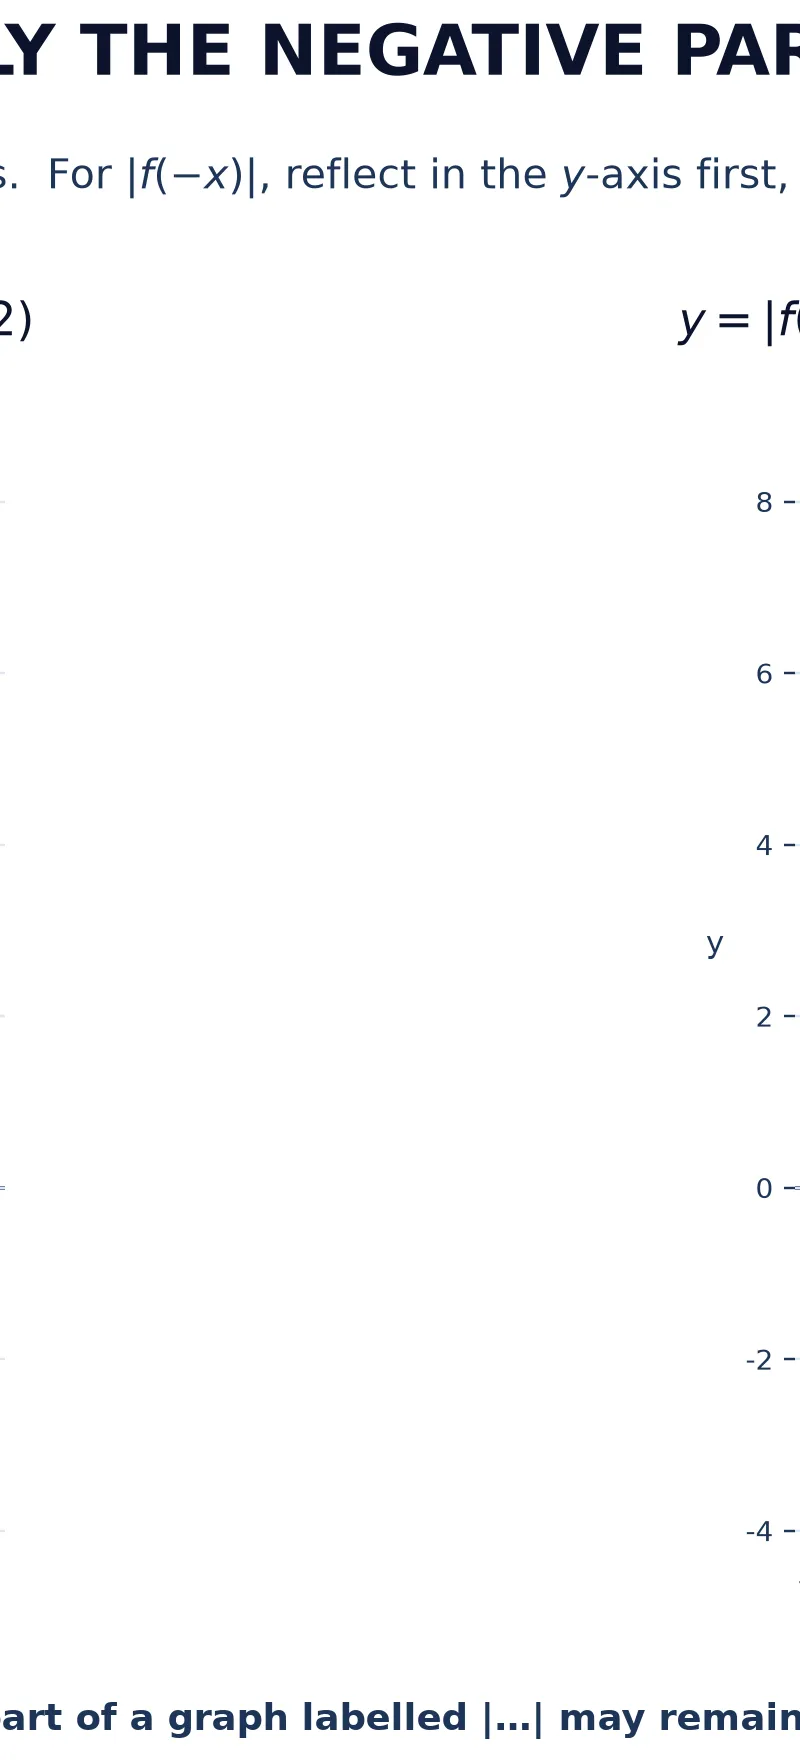
For |f(-x)|, the y-axis reflection and the modulus operation can be performed in either order, but a clear two-stage explanation is best in an exam.
Worked Examples
3 worked examples — open one to explore the question and available guidance.
Practice Questions
Try the question, then reveal an answer plan or example response
The graph y = f(x) has a root at (5, 0) and a maximum point at (3, 4). Give the corresponding features on y = f(x - 2) + 1. [3 marks]
Hint: f(x - 2) moves right 2; the +1 is outside, so it moves up 1.
A curve y = f(x) passes through (-4, 3). Find the corresponding point on y = 5f(-2x). Describe the transformation fully. [3 marks]
Hint: For f(-2x), divide the old x-coordinate by -2; then multiply the y-coordinate by 5.
Sketch y = |x^2 - 4|, showing all intercepts and the turning point created by the modulus. [4 marks]
Hint: Start with y = x^2 - 4. Which part is below the x-axis?
The curve y = 1/x is transformed to y = 2/(x + 3) - 1. State the transformations of y = 1/x and give the equations of both asymptotes. [4 marks]
Hint: Read it as 2f(x + 3) - 1 where f(x) = 1/x.
The graph y = sin x is transformed to y = 3 + sin(2x). State its amplitude, period, midline and one cycle’s key coordinates from x = 0 to x = π. [5 marks]
Hint: The inside factor changes period, while the outside addition changes the midline.
Exam technique
How to turn what you know into marks
How to approach the question
Underline every operation, separate inside operations from outside operations, then transform key coordinates before drawing. Start with the parent graph’s roots, stationary points, intercepts, endpoints, periodic features or asymptotes. State the axis and scale factor precisely whenever asked to describe a transformation.
How to structure your answer
For 1-2 marks, give the transformation using axis and scale factor. For 3-4 marks, show transformed coordinates and a labelled sketch. For 5-6 marks, include algebraic substitution where requested, both asymptotes or decisive features, a point on each branch where appropriate, and a shape-consistent final curve.
Timing
Papers 1 and 2 are each 2 hours for 100 marks, giving 1.2 minutes per mark. For a 4-mark sketch, aim to identify features in the first 2 minutes, draw and label in the next 2 minutes, then check axes and asymptotes.
Common pitfalls
- Writing f(x + a) as a translation a units right. Avoid it by solving x + a = old input, or remembering positive inside moves left.
- Multiplying x-coordinates in f(ax). Avoid it by writing the mapping x → x/a before sketching.
- Moving a vertical asymptote after adding a constant outside f. Only y-values are changed by f(x) + a.
- Using the word 'stretch' without naming the axis or giving a scale factor. State 'stretch parallel to the y-axis, scale factor 3' instead.
- Leaving negative sections beneath the x-axis in |f(x)|. Check that every final output is non-negative.
What the command words want
- Sketch
- Draw axes, transfer the decisive features, add dotted asymptotes if needed, then draw the correct curve shape. Label coordinates used as evidence.
- Explain
- Use the coordinate rule to justify direction, for example 'x + 3 = 0, so the vertex is at x = -3'.
- Describe
- Name the transformation, the axis or direction, and the scale factor where relevant. Avoid simply writing 'squash'.
- Calculate
- Write the original coordinate, the mapping, then the transformed coordinate. This exposes method for partial credit.
- Show that
- Use the transformation or substitution in visible stages. Do not begin with the requested result.
- State/Give
- Use one mathematically complete phrase, for example 'translation 2 units left' or 'vertical asymptote x = -1'.
Watch or listen (optional)
Test your understanding of Understand the effect of simple transformations on the graph of y = f(x), including sketching associated graphs: y = af(x), y = f(x) + a, y = f(x + a), y = f(ax) and combinations of these transformations
Active recall beats re-reading. Take an instant quiz now to test what you’ve learned and lock it into long-term memory.
7 days Premium · Then the free plan continues · No card, no charge