Pearson Edexcel · A-Level · Mathematics
Course version: 9MA0 · Version from Mar 2026
Use of functions in modelling, including consideration of limitations and refinements of the models
Functions in modelling is where A-Level Mathematics becomes a tool for understanding real situations. You will learn to select a sensible trigonometric, exponential or reciprocal model, interpret its parameters and, crucially, explain where its predictions become unreliable. In the exam, the strongest candidates treat every numerical output as a claim that must be checked against the real-world context.
- 10 min read
- 3 worked examples
- 5 practice questions
- 8 key terms
Check what you remember
Read the wording for your board, then hide it and explain Mathematical model in your own words. Rough notes are fine. This is a self-check, with no mark or grade.
Reference: Pearson Edexcel
A simplified mathematical representation of a real situation, used to describe, explain or predict values.
Study Notes

Overview
Specification reference: Pearson Edexcel A-Level Mathematics (9MA0), section 2.11. Mathematical modelling turns a messy real situation into a function that can be calculated, graphed and criticised. In this topic, candidates choose a function that reflects the pattern in the context, determine any unknown constants, use it to make a prediction, then decide whether that prediction is believable. The vital word is context. A numerically correct answer that gives a negative population, predicts daylight for a date outside the year, or uses an impossible volume has not been interpreted properly.
Pearson names trigonometric models for tides or daylight hours, exponential models for growth and decay, and reciprocal models for inverse proportion as examples of 2.11.[1] This links algebra and functions to graph transformations, exponentials and logarithms, trigonometry, differentiation, statistics and mechanics. Expect a short calculation followed by a prompt such as state an assumption, explain a limitation, comment on the validity, or suggest a refinement. Those final words often distinguish a routine substitution from a high-quality modelling answer.
Key Concepts
1. A model is a useful simplification, not reality
A mathematical model assigns a relationship between an independent variable, often time (t), and a dependent variable, such as height (h), population (P) or pressure (p). Its parameters are numbers chosen from data or conditions. For example, in (P=1200e^{0.06t}), 1200 is the initial population and 0.06 is the continuous growth constant.
Start by translating the words into variables with units. Then write the domain before calculating. If (t) is time after a measurement began, normally (t\geq0). If a model is for one year of daylight, its domain might be (0\leq t\leq365$). A function can be algebraically defined for many values, but the model may not be meaningful there. Candidates receive credit for separating mathematical possibility from physical sense.$
2. Selecting a function from the pattern
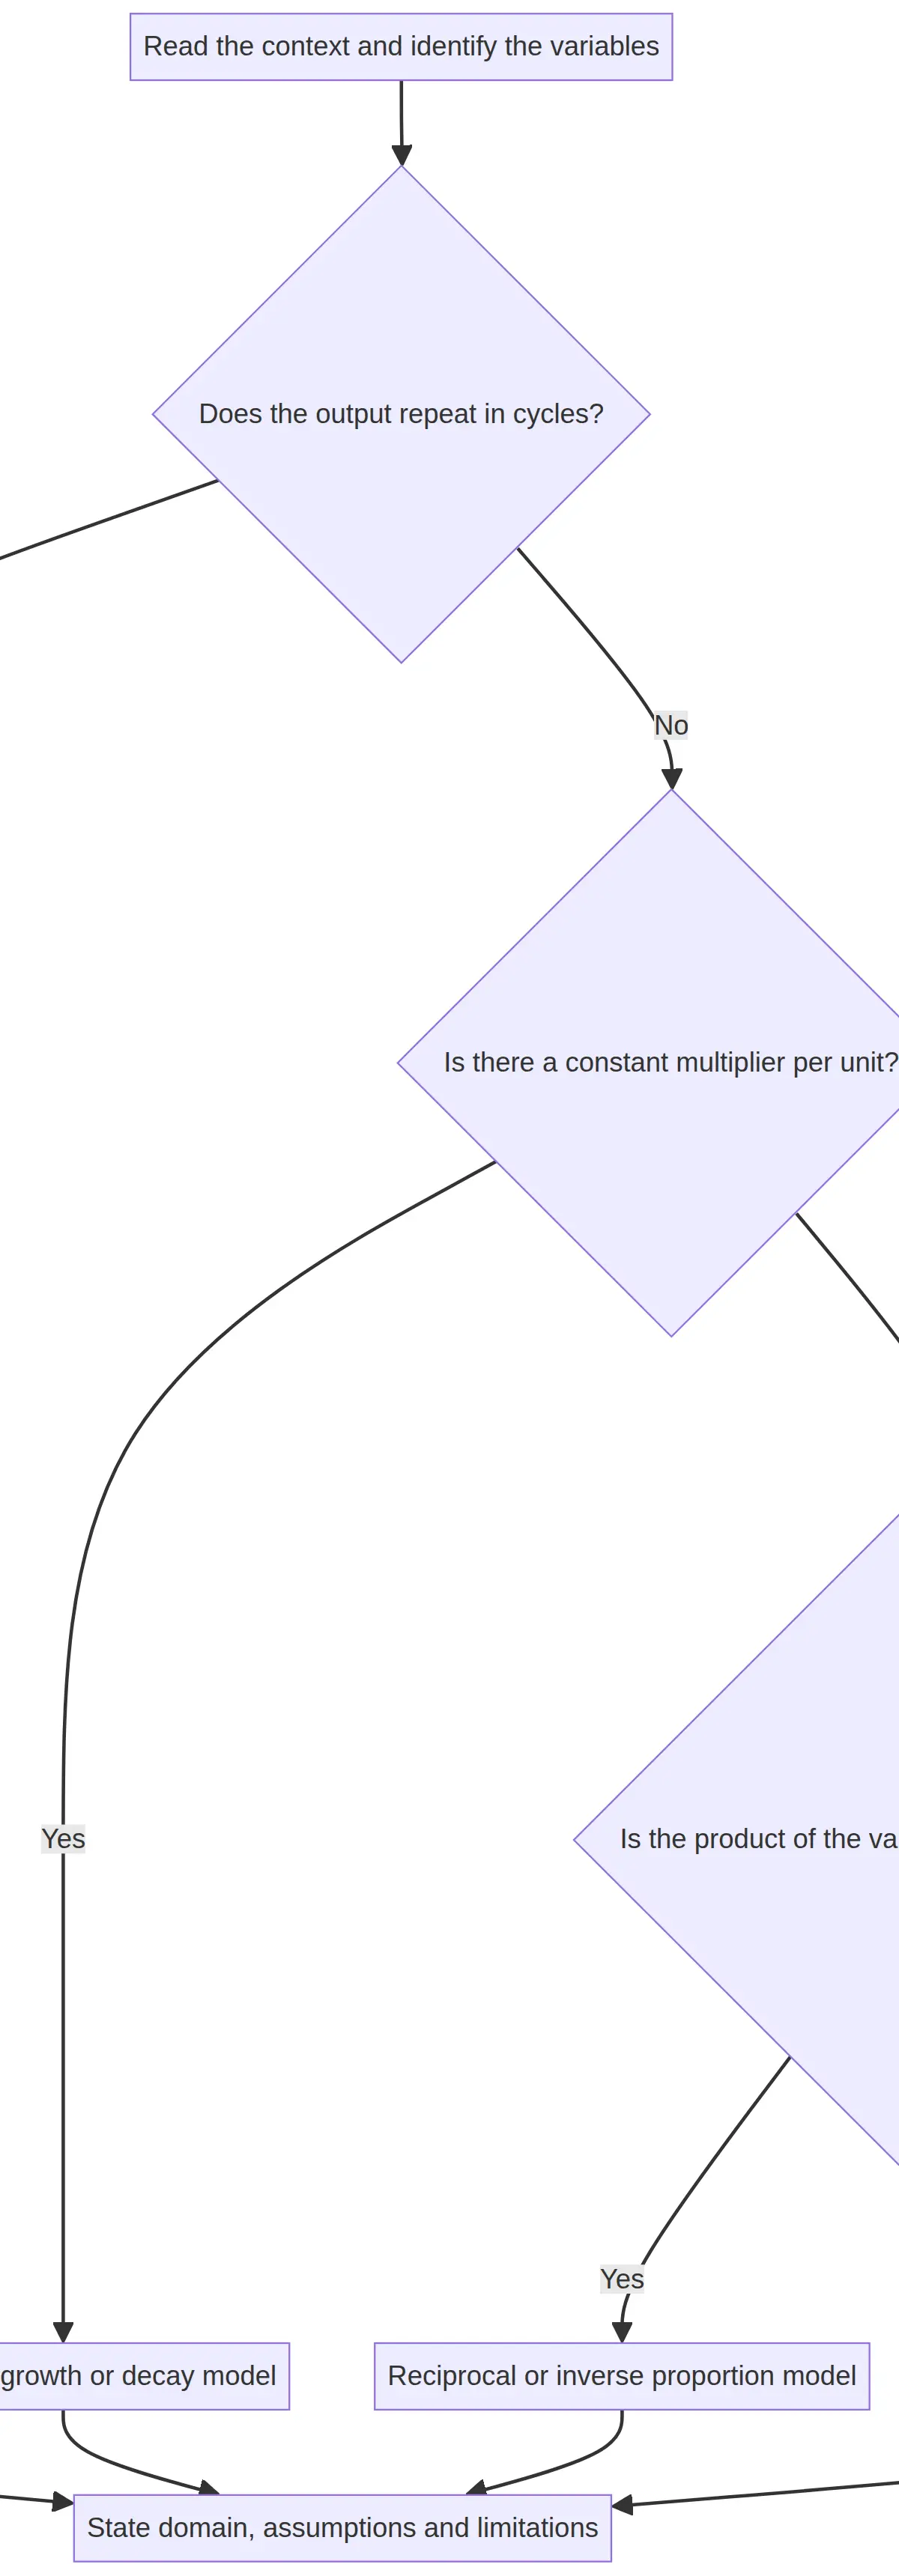
Choose the simplest function that matches the mechanism or shape, then justify it from the context.
Periodic change: trigonometric model. Use sine or cosine when a value rises and falls in an approximately repeating cycle, such as tide height or hours of sunlight. A useful general form is (y=A\sin(B(t-C))+D), or an equivalent cosine form. (A) is the amplitude, half the difference between maximum and minimum. (D) is the midline, the mean of the maximum and minimum. (C) shifts the graph horizontally to align it with a known peak, trough or crossing. When the angle is in radians, the period is (T=2\pi/|B|). Do not select a sine curve merely because the data has one peak: the repeating mechanism must be plausible.
Constant multiplier: exponential model. Use (y=ab^t) or (y=ae^{kt}) when equal time intervals multiply the quantity by the same factor. Here (a) is the value at (t=0). In (ae^{kt}), (k>0) represents growth and (k<0) decay. A common method is to substitute two known values to find constants, then use logarithms to solve for time. The model has a constant proportional rate, so it is rarely reliable indefinitely for a real population.
Constant product: reciprocal model. Use (y=k/x) when one variable is inversely proportional to another: (xy=k). The curve has two algebraic branches, but the context usually allows only one. For pressure and volume, both quantities must be positive, so candidates should state (V>0) and use the positive branch. The vertical asymptote at (x=0) signals an impossible or excluded value, not a prediction of an infinitely large real quantity.
3. Parameters must have a job
A high-mark answer explains what constants mean. In a tide model (h=2.4+1.1\sin(\pi t/6)), 2.4 m is the mean water height, 1.1 m is the amplitude and (\pi/6) gives a 12-hour period because (2\pi\div(\pi/6)=12). Substitute a time with its unit, keep calculator mode consistent with the expression, and write the final answer in context: “the predicted tide height is 3.5 m”, not only “3.5”.
When finding parameters from a graph or data, use meaningful points. A maximum and minimum can establish amplitude and midline; the time between consecutive peaks establishes the period. For an exponential model, the condition at (t=0) normally gives (a) immediately. Keep the exact form until the final numerical answer where possible. Premature rounding changes a later logarithmic answer.
4. Evaluate, do not merely complain
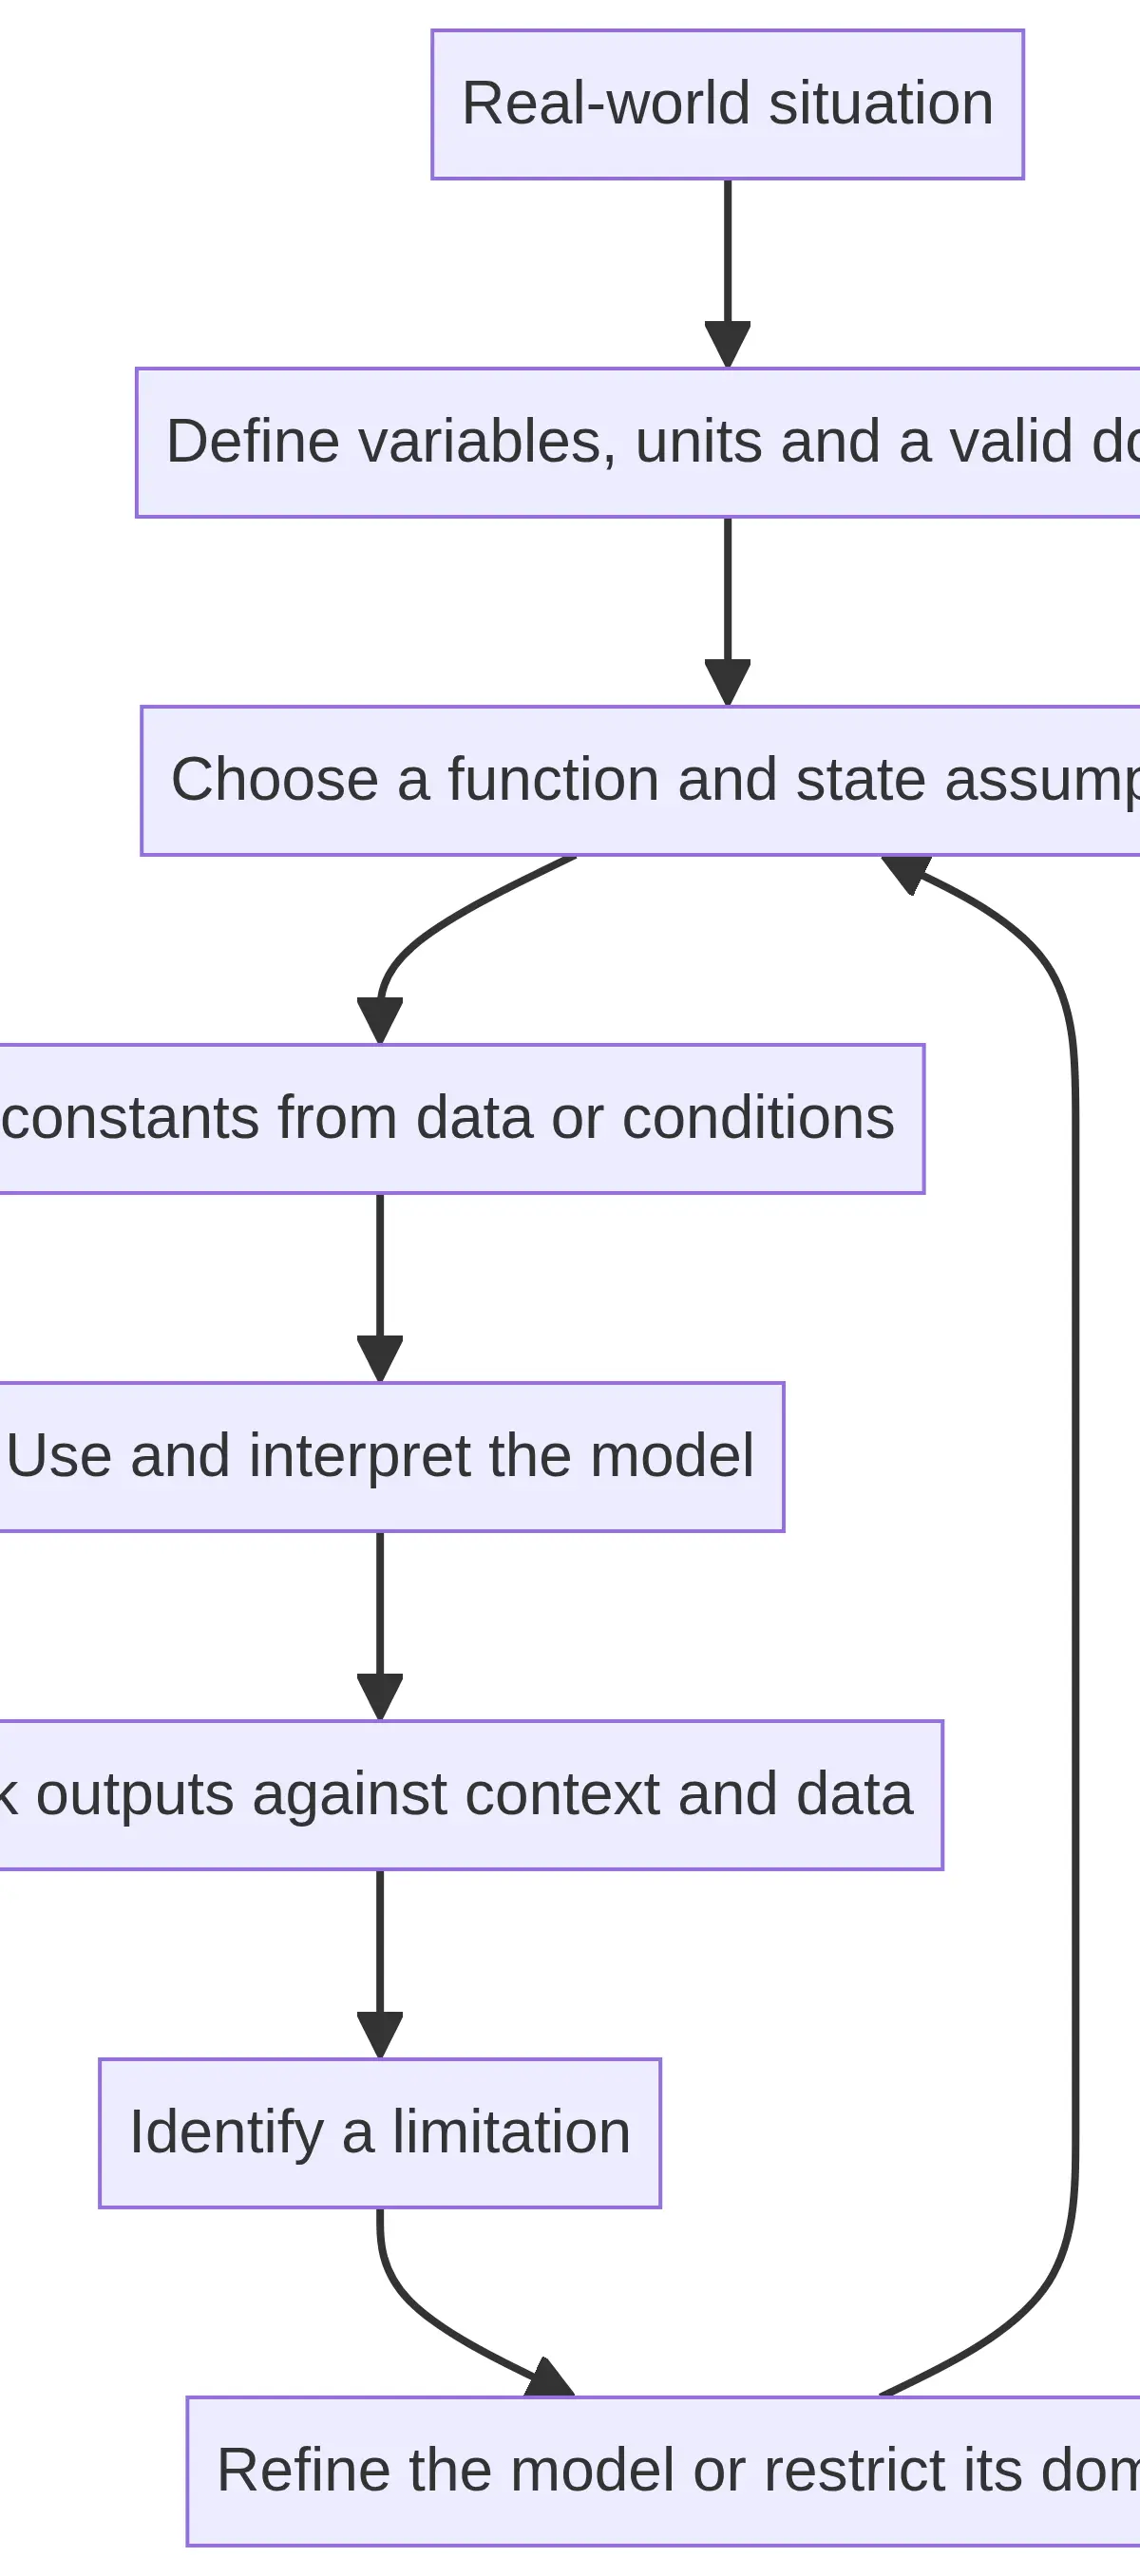
A limitation is a specific reason why the model may not describe the situation accurately. It must be tied to the model and the context. “The model is not realistic” is too vague for full credit. Better answers identify the assumption and its consequence:
- A sine tide model assumes a fixed period and amplitude. Weather, wind, atmospheric pressure and local geography can alter actual tide levels, so predicted heights may differ from observed heights.
- An exponential population model assumes a constant proportional growth rate. Resource limits, disease, migration or changing birth rates can make the rate change, so long-term extrapolation may overestimate population.
- A reciprocal pressure model assumes a fixed temperature and amount of gas. If either changes, (pV) is no longer constant, so the constant (k) cannot remain valid.
A refinement is a plausible improvement, not simply “collect more data”. It could restrict the domain to the data interval, fit parameters using more recent data, introduce a seasonal term, use separate models in different ranges, or replace unbounded exponential growth with a model that includes a limiting population. State why the change addresses the named weakness.
5. Domain, range and extrapolation
Always test the output against the original situation. A model may give a mathematically valid value but an invalid physical value. For daylight hours, the range must lie between 0 and 24. A population must not be negative. A reciprocal pressure model excludes zero volume. A tide equation may be periodic for all real (t), but a question may ask for one day only.
Interpolation estimates inside the range of data used to create the model and is usually safer. Extrapolation predicts outside that range and needs a caution because the assumptions may fail. Pearson’s enhanced guidance specifically expects students to consider large values of time and whether predicted ranges are appropriate.[2] In an evaluate question, name whether a prediction is extrapolation and link that fact to one contextual limitation.
Mathematical Relationships and Formula Sheet Status
The formula booklet is available in the assessment, but it does not choose, construct or interpret a context-specific model.[1] The following forms should be understood and used, rather than copied without thought.
- (y=A\sin(B(t-C))+D), or the cosine equivalent: must memorise/use. (A) is amplitude, (D) midline, (C) phase shift and (B) controls period.
- (T=2\pi/|B|) for a radian trigonometric model: must understand/use. It follows from the standard (2\pi) cycle.
- (y=ab^t) and (y=ae^{kt}): must memorise/use. (a) is initial value; (b) is a discrete multiplier; (k) is a continuous rate.
- (y=k/x), equivalently (xy=k): must memorise/use. It expresses inverse proportion and requires (x
e0). - (t=\ln(y/a)/k), when (y=ae^{kt}): must understand/use. Use it to solve an exponential model for time, with a valid positive logarithm argument.
Graph and Data Skills
Label both axes with variables and units. Choose a scale that exposes the pattern, then check whether points lie close enough to the proposed curve to justify the model. Read a trigonometric graph for maximum, minimum, midline and period before writing an equation. On a reciprocal graph, state which branch is physically valid. When using technology, a fitted curve is evidence, not proof: still comment on residual variation, the data range and any implausible prediction. There are no Foundation/Higher tiers in A-Level Mathematics. Keep all units consistent, especially time: do not mix hours in the model with minutes in the substitution without conversion.
Practical Applications
Tide-height apps, daylight planning, population projections, drug concentration and gas-pressure systems all use simplified functions. The exam reward is not for naming an app; it is for explaining why the function matches the pattern, what the parameter means and when the prediction stops being trustworthy. This is not a required practical. Treat supplied data as imperfect evidence: round sensibly, use the stated units, and never add unsupported precision.
Examiner-Focused Checklist
Before moving on, use MAPS: Model choice, Assumptions, Prediction in context, Sense-check. In an Edexcel paper, each assessment is two hours and 100 marks, so use roughly one minute per mark as a planning guide.[1] For a 5-mark modelling item, expect to show a model or substitution, accurate processing, contextual interpretation and at least one developed evaluation point. Underline command words. “Calculate” needs clear working and units. “Explain” needs a because-link. “Suggest a refinement” needs a change and why it improves the fit.
Revision Audio
Sources
[1] https://qualifications.pearson.com/content/dam/pdf/A%20Level/Mathematics/2017/specification-and-sample-assesment/a-level-l3-mathematics-specification-issue4.pdf "Pearson Edexcel Level 3 Advanced GCE in Mathematics Specification, Issue 4"
[2] https://qualifications.pearson.com/content/dam/pdf/A%20Level/Mathematics/2017/specification-and-sample-assesment/pearson-edexcel-l3-advanced-gce-mathematics-9ma0-enhanced-content-guidance-issue-2.pdf "Pearson Edexcel A-Level Mathematics Enhanced Content Guidance, Issue 2"
[3] https://www.savemyexams.com/a-level/maths/edexcel/18/pure/revision-notes/algebra-and-functions/further-modelling-with-functions/modelling/ "Further Modelling with Functions, Edexcel A-Level Maths"
Visual Resources
2 diagrams and illustrations
Interactive Diagrams
2 interactive diagrams to visualise key concepts
Conceptual Flow Outline
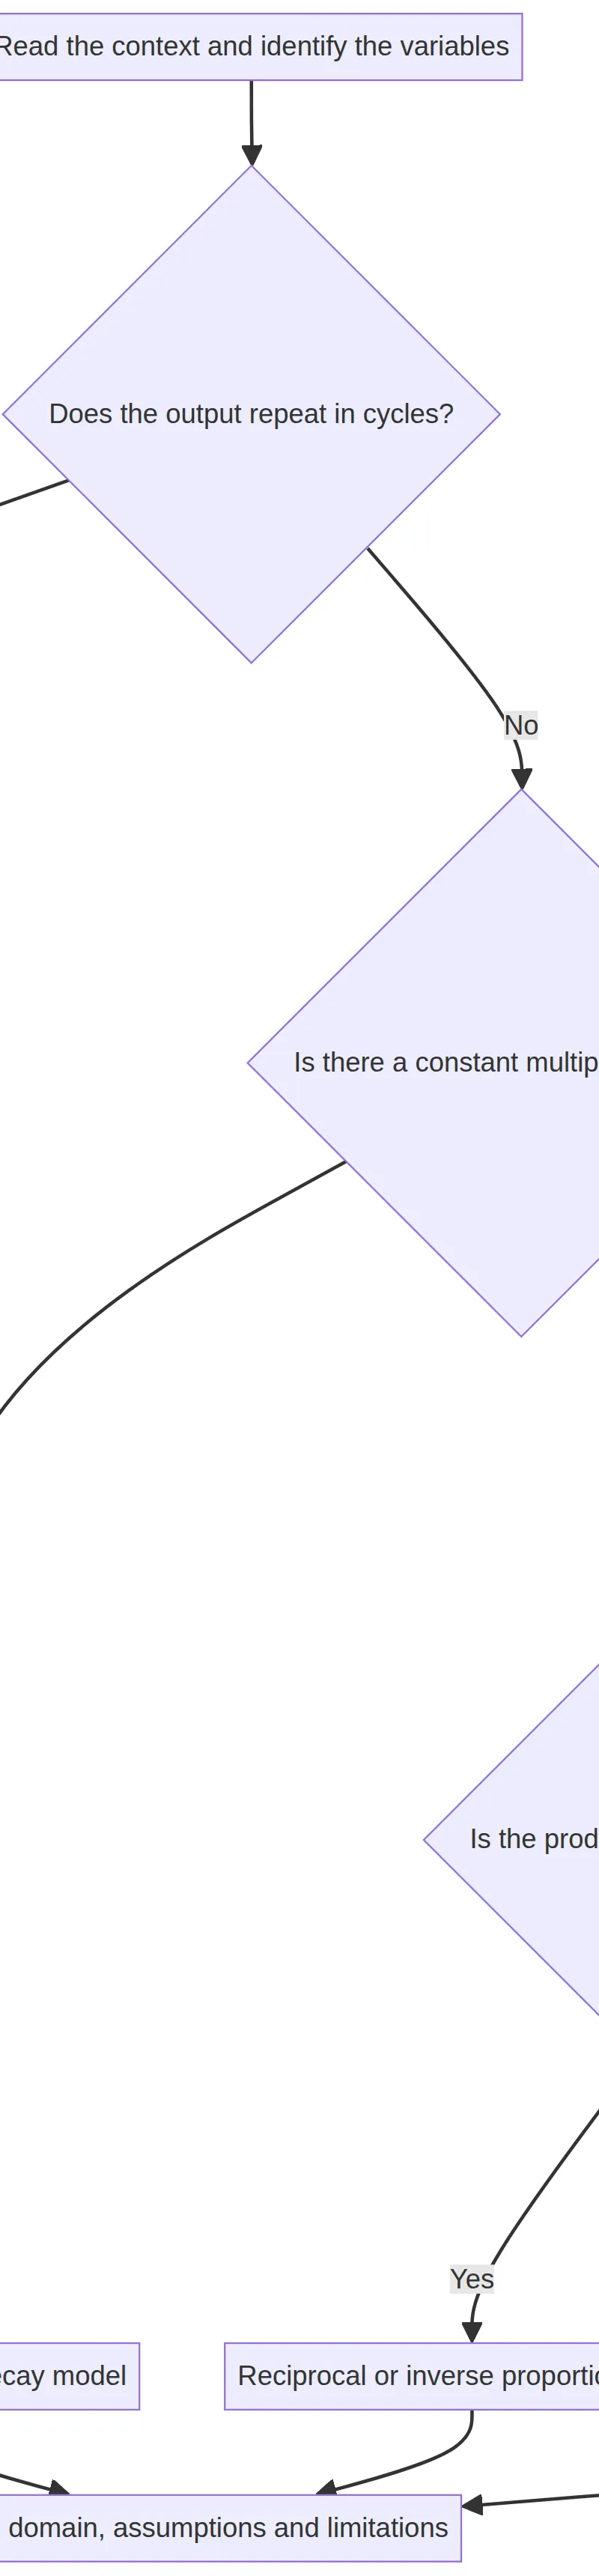
Choosing an initial function from the pattern and then applying contextual restrictions.
Conceptual Flow Outline
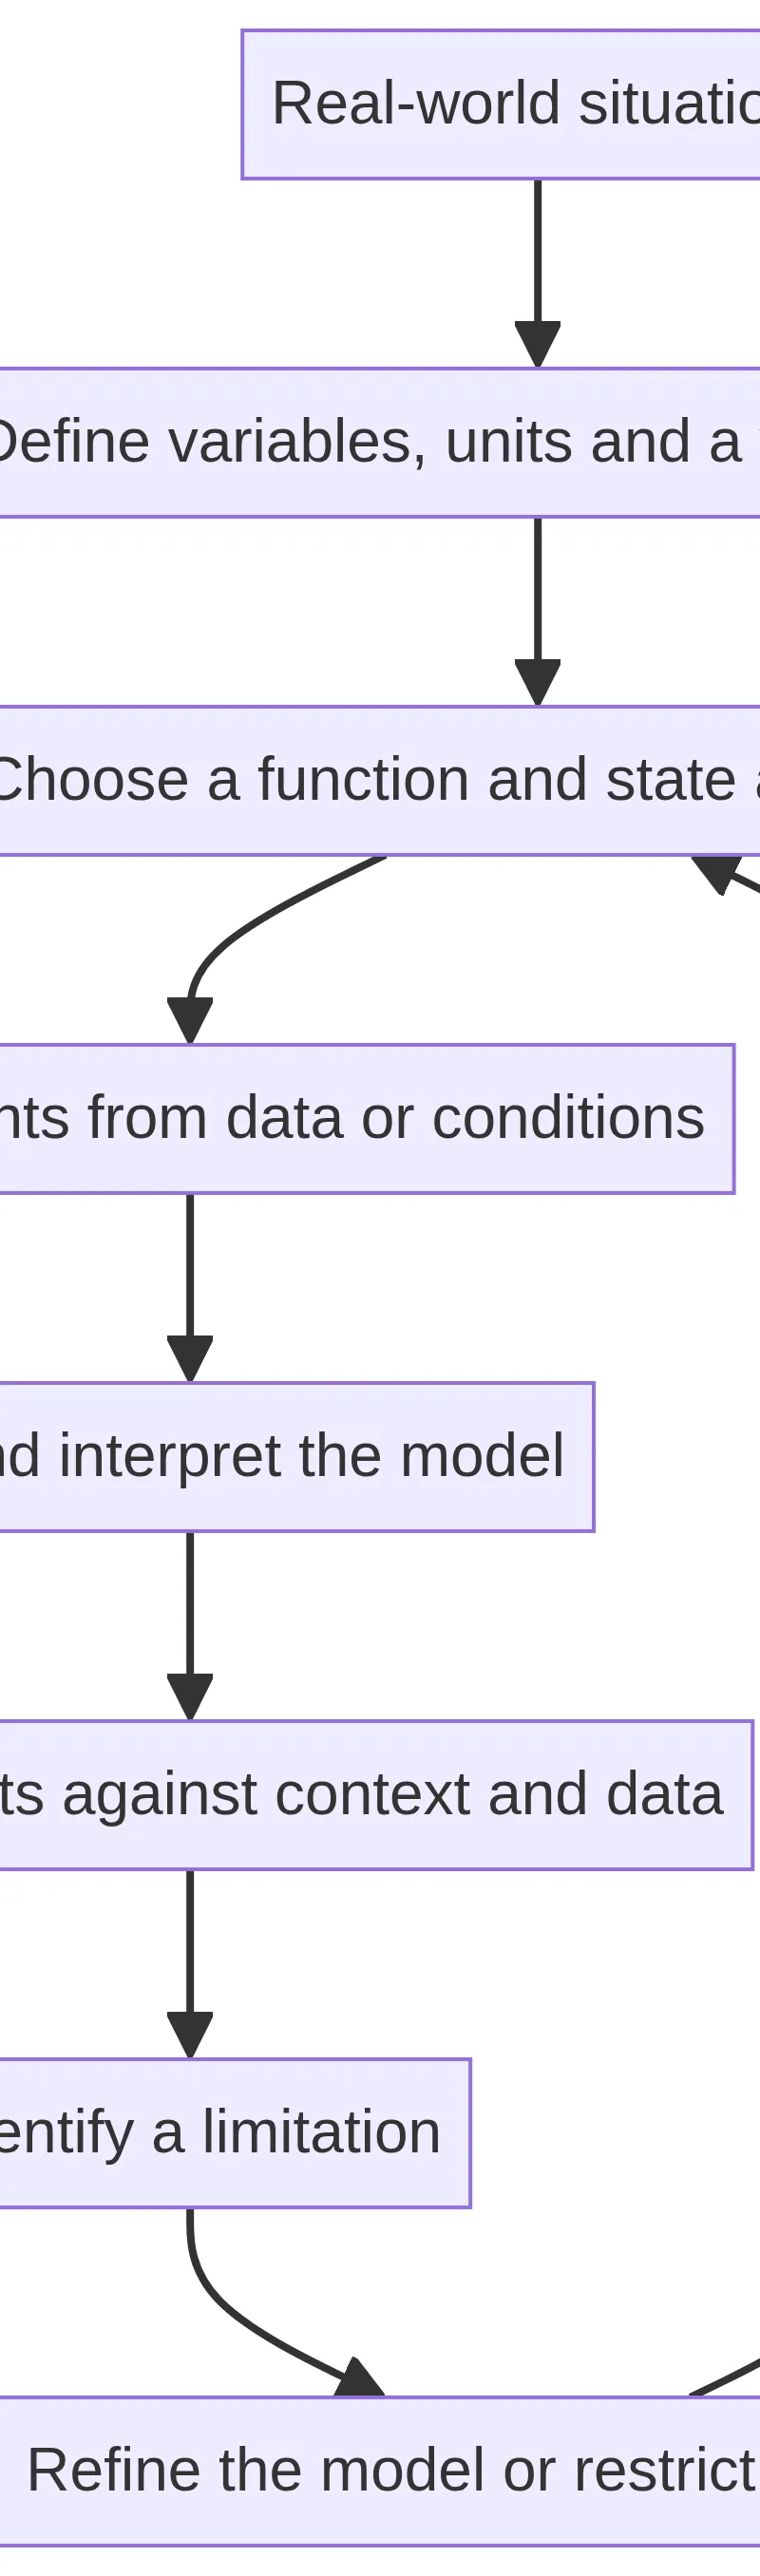
Mathematical modelling is iterative: evaluation feeds into refinement.
Worked Examples
3 worked examples — open one to explore the question and available guidance.
Practice Questions
Try the question, then reveal an answer plan or example response
The daylight duration D hours is modelled by D = 12 + 4 sin(pi t/182.5), where t is the number of days after a chosen date. State the maximum and minimum values predicted by the model. [3 marks]
Hint: For sine, the largest value is 1 and the smallest is -1.
A quantity is modelled by Q = ae^(0.12t). Given that Q = 500 when t = 0, find a and calculate Q when t = 5. [4 marks]
Hint: At t = 0, e^(0.12t) becomes 1.
The model p = 720/V gives pressure p kPa in terms of volume V litres. Describe the valid branch of the graph and state the restriction on V in this context. [4 marks]
Hint: Ask whether a physical volume or pressure can be negative or zero.
A model for the number of visitors to a park is N = 1800e^(0.04t), where t is years after 2026. Evaluate the use of this model to predict N in 2056 and suggest one refinement. [5 marks]
Hint: 2056 is 30 years after 2026. Focus on whether a fixed 4% continuous growth rate is credible for that long.
At a coastal station, high tide is recorded as 5.1 m and low tide as 1.7 m. Consecutive high tides are 12.4 hours apart. Construct a sine model h = A sin(B(t - C)) + D for tide height h metres, where t is in hours. You may choose C so that t = C is a midline crossing with increasing height. State one limitation. [6 marks]
Hint: Find amplitude and midline from the maximum and minimum. Then use period = 2pi/B.
Exam technique
How to turn what you know into marks
How to approach the question
Underline the command word. Define variables and units, identify the pattern, write or use the function, show substitution, then test the output against the domain and context. For an evaluation, make one developed point: assumption or missing factor, then its effect on the prediction.
How to structure your answer
For 1-2 marks, give the exact calculation or stated restriction. For 3-4 marks, show formula, substitution, accurate processing and a contextual conclusion. For 5-6 marks, add a developed assumption or limitation and a linked refinement where requested.
Timing
Use approximately 1 minute per mark as a planning guide. Pearson Edexcel A-Level Mathematics papers are 2 hours and 100 marks, so protect time for the final interpretation and evaluation sentence.
Common pitfalls
- Using every algebraic branch of a reciprocal graph. Avoid this by stating the contextual domain, for example V > 0 for a physical gas volume.
- Giving 'unrealistic' as a limitation. Avoid this by naming the fixed assumption, real factor omitted and resulting effect on the prediction.
- Extrapolating far beyond the data without comment. Avoid this by naming extrapolation and explaining why model parameters may change.
- Reporting a bare decimal. Avoid this by writing a sentence with the correct physical quantity, unit and appropriate rounding.
What the command words want
- Compare
- Give a similarity and a difference, such as both models fit early data but only one has a limiting value.
- Explain
- Use a because-link between the model assumption and its effect. Example: 'The estimate may be inaccurate because wind alters tide height'.
- Describe
- Identify the visible mathematical or contextual pattern, such as 'the curve repeats every 12 hours'.
- Evaluate
- State a benefit, then a context-specific limitation, support it with the model assumption, and make a justified judgement or refinement.
- Calculate
- Show the model or formula, substitution, key processing and an answer with a unit.
- State/Give
- Give a brief, precise fact with no unnecessary working. Example: 'V > 0'.
Watch or listen (optional)
Test your understanding of Use of functions in modelling, including consideration of limitations and refinements of the models
Active recall beats re-reading. Take an instant quiz now to test what you’ve learned and lock it into long-term memory.
7 days Premium · Then the free plan continues · No card, no charge