Pearson Edexcel · GCSE · Mathematics
Course version: 1MA1 · Version from Mar 2026
Algebra - Graphs
A curve can slide or flip without changing its shape, and one correctly tracked point can unlock the rule. Master the four Higher-tier graph transformations, then use accurate sketches, coordinate mapping and full descriptions to secure marks in Pearson Edexcel GCSE Mathematics.
- 14 min read
- 4 worked examples
- 6 practice questions
- 10 key terms
Try the lesson
The start of the Algebra - Graphs lesson, made from checked teaching notes for this specification point.
Have a go first
The graph of y = f(x) passes through the point (2, 5). The graph of y = f(x) + 3 is drawn. What are the coordinates of the image of the point (2, 5) on this new graph?
There is more to this lesson
The full lesson goes on to check your understanding and help you earn the marks. Create a free account to carry on, with your progress saved.
7 days Premium · Then the free plan continues · No card, no charge
Check what you remember
Read the wording for your board, then hide it and explain Function notation in your own words. Rough notes are fine. This is a self-check, with no mark or grade.
Reference: Pearson Edexcel
f(x) denotes the output of the function f for input x.
Study Notes

Overview
A graph transformation changes where a curve sits without changing its shape. In this Higher-tier topic, candidates translate graphs horizontally or vertically and reflect them in the coordinate axes. The original curve is called (y=f(x)), but its formula may never be given: the graph and a few labelled points can provide everything needed.
This matters because a correct transformation can secure marks quickly, whereas one sign error can move every point to the wrong place. Typical questions ask you to sketch, write down coordinates, or describe fully a transformation. The most reliable approach is to track points, including a turning point, and then reproduce the entire curve through their images.
The topic connects algebraic substitution to quadratic roots and turning points, coordinate geometry, translation vectors and trigonometric graphs. Understanding inputs and outputs explains why horizontal movement reverses the sign inside the brackets. It also helps you check answers rather than relying on a memorised picture. Work through the examples, cover each rule before recalling it, and use the podcast to practise explaining your reasoning aloud. Aim for accurate coordinates, an unchanged shape and precise mathematical language.
Specification: Pearson Edexcel GCSE Mathematics 1MA1, A13, “sketch translations and reflections of a given function”. A13 is Higher-only. Coordinate reading is prerequisite knowledge, not itself Higher-only. Pearson limits these function transformations to translations and reflections; stretches are outside this topic's specification scope. 1 2
Key Concepts
1. Function notation: separate the input from the output
The expression (f(x)) means the output of a function when its input is (x). It does not mean (f\times x). If ((2,5)) lies on (y=f(x)), then (f(2)=5): input 2 produces output 5.
Write a general original point as ((p,q)), with (f(p)=q). This is your anchor. An outside change acts on the output (q); an inside change acts on the input expression, so you solve for the new horizontal coordinate. Candidates do not need to invent an equation for an unfamiliar curve.
Cover and recall: If (f(-3)=7), what point lies on the graph? Answer before checking: ((-3,7)), not ((7,-3)).
2. Vertical translations: (y=f(x)+a)
Adding (a) outside the function adds (a) to every output. Therefore ((p,q)\mapsto(p,q+a)). For positive (a), the curve moves up; for negative (a), it moves down. The horizontal coordinate is unchanged.
Example: Under (y=f(x)+3), a maximum at ((1,5)) moves to ((1,8)). A different point ((-2,-1)) moves to ((-2,2)). Both move exactly three units upwards, and the maximum remains a maximum.
A full description is “translation by vector (\begin{pmatrix}0\3\end{pmatrix})”. A translation has a vector, not a mirror line. Think of lifting a rigid tracing of the original curve: nothing is stretched, and every point moves equally.
Why does this work? At the same input (p), the new output is (f(p)+a=q+a). This explanation is more secure than “plus always means up”, because plus inside the function behaves differently.
3. Horizontal translations: (y=f(x+a))
An inside addition moves the graph horizontally in the opposite directionto its sign. The rule is ((p,q)\mapsto(p-a,q)). Thus (f(x+2)) moves left two units, while (f(x-2)) moves right two units. The height is unchanged.
To explain the apparent reversal, preserve the old input. If the original point has input (p=1), then for (f(x+2)) the new coordinate must satisfy (x+2=1). Hence (x=-1). The function still receives 1 and produces the same old output, but it now does so two units further left.
Example:A maximum at ((1,5)) moves to ((-1,5)) under (f(x+2)), and to ((3,5)) under (f(x-2)). The corresponding vectors are (\begin{pmatrix}-2\0\end{pmatrix}) and (\begin{pmatrix}2\0\end{pmatrix}).
Check with substitution: If (f(x)=x^2), then (f(x-2)=(x-2)^2), whose minimum is at (x=2). It cannot be a move left. Apply the same reasoning when (a) is negative: subtracting a negative coordinate change reverses its sign.
4. Reflection in the x-axis: (y=-f(x))
A minus sign outside negates every output: ((p,q)\mapsto(p,-q)). This is a reflection in thex-axis, the line (y=0). Horizontal positions remain unchanged, while points above the axis move the same distance below it.
Example:((1,5)\mapsto(1,-5)), and ((-2,-3)\mapsto(-2,3)). A maximum becomes a minimum. Every x-intercept stays fixed because (-0=0).
A reflection is not a downward translation. A point at height 5 moves ten units to height -5, while one at height 2 moves four units to height -2. Their distances from the mirror line, rather than their displacement vectors, determine the image. Credit for a full description requires the correct reflection and mirror line, subject to the individual mark scheme.
5. Reflection in the y-axis: (y=f(-x))
A minus sign inside reverses the horizontal coordinate: ((p,q)\mapsto(-p,q)). This reflects the curve in they-axis, the line (x=0). Heights are unchanged. A maximum remains a maximum, although its position may change.
Example:((1,5)\mapsto(-1,5)), while ((-4,-2)\mapsto(4,-2)). Every point already on the y-axis is fixed.
For (f(x)=x^2), (f(-x)=(-x)^2=x^2), so the image looks unchanged: the original graph is symmetric about the y-axis. The transformation rule still applies. An asymmetric graph makes the reflection easier to recognise. Do not assume that an unchanged-looking graph means no reflection occurred.

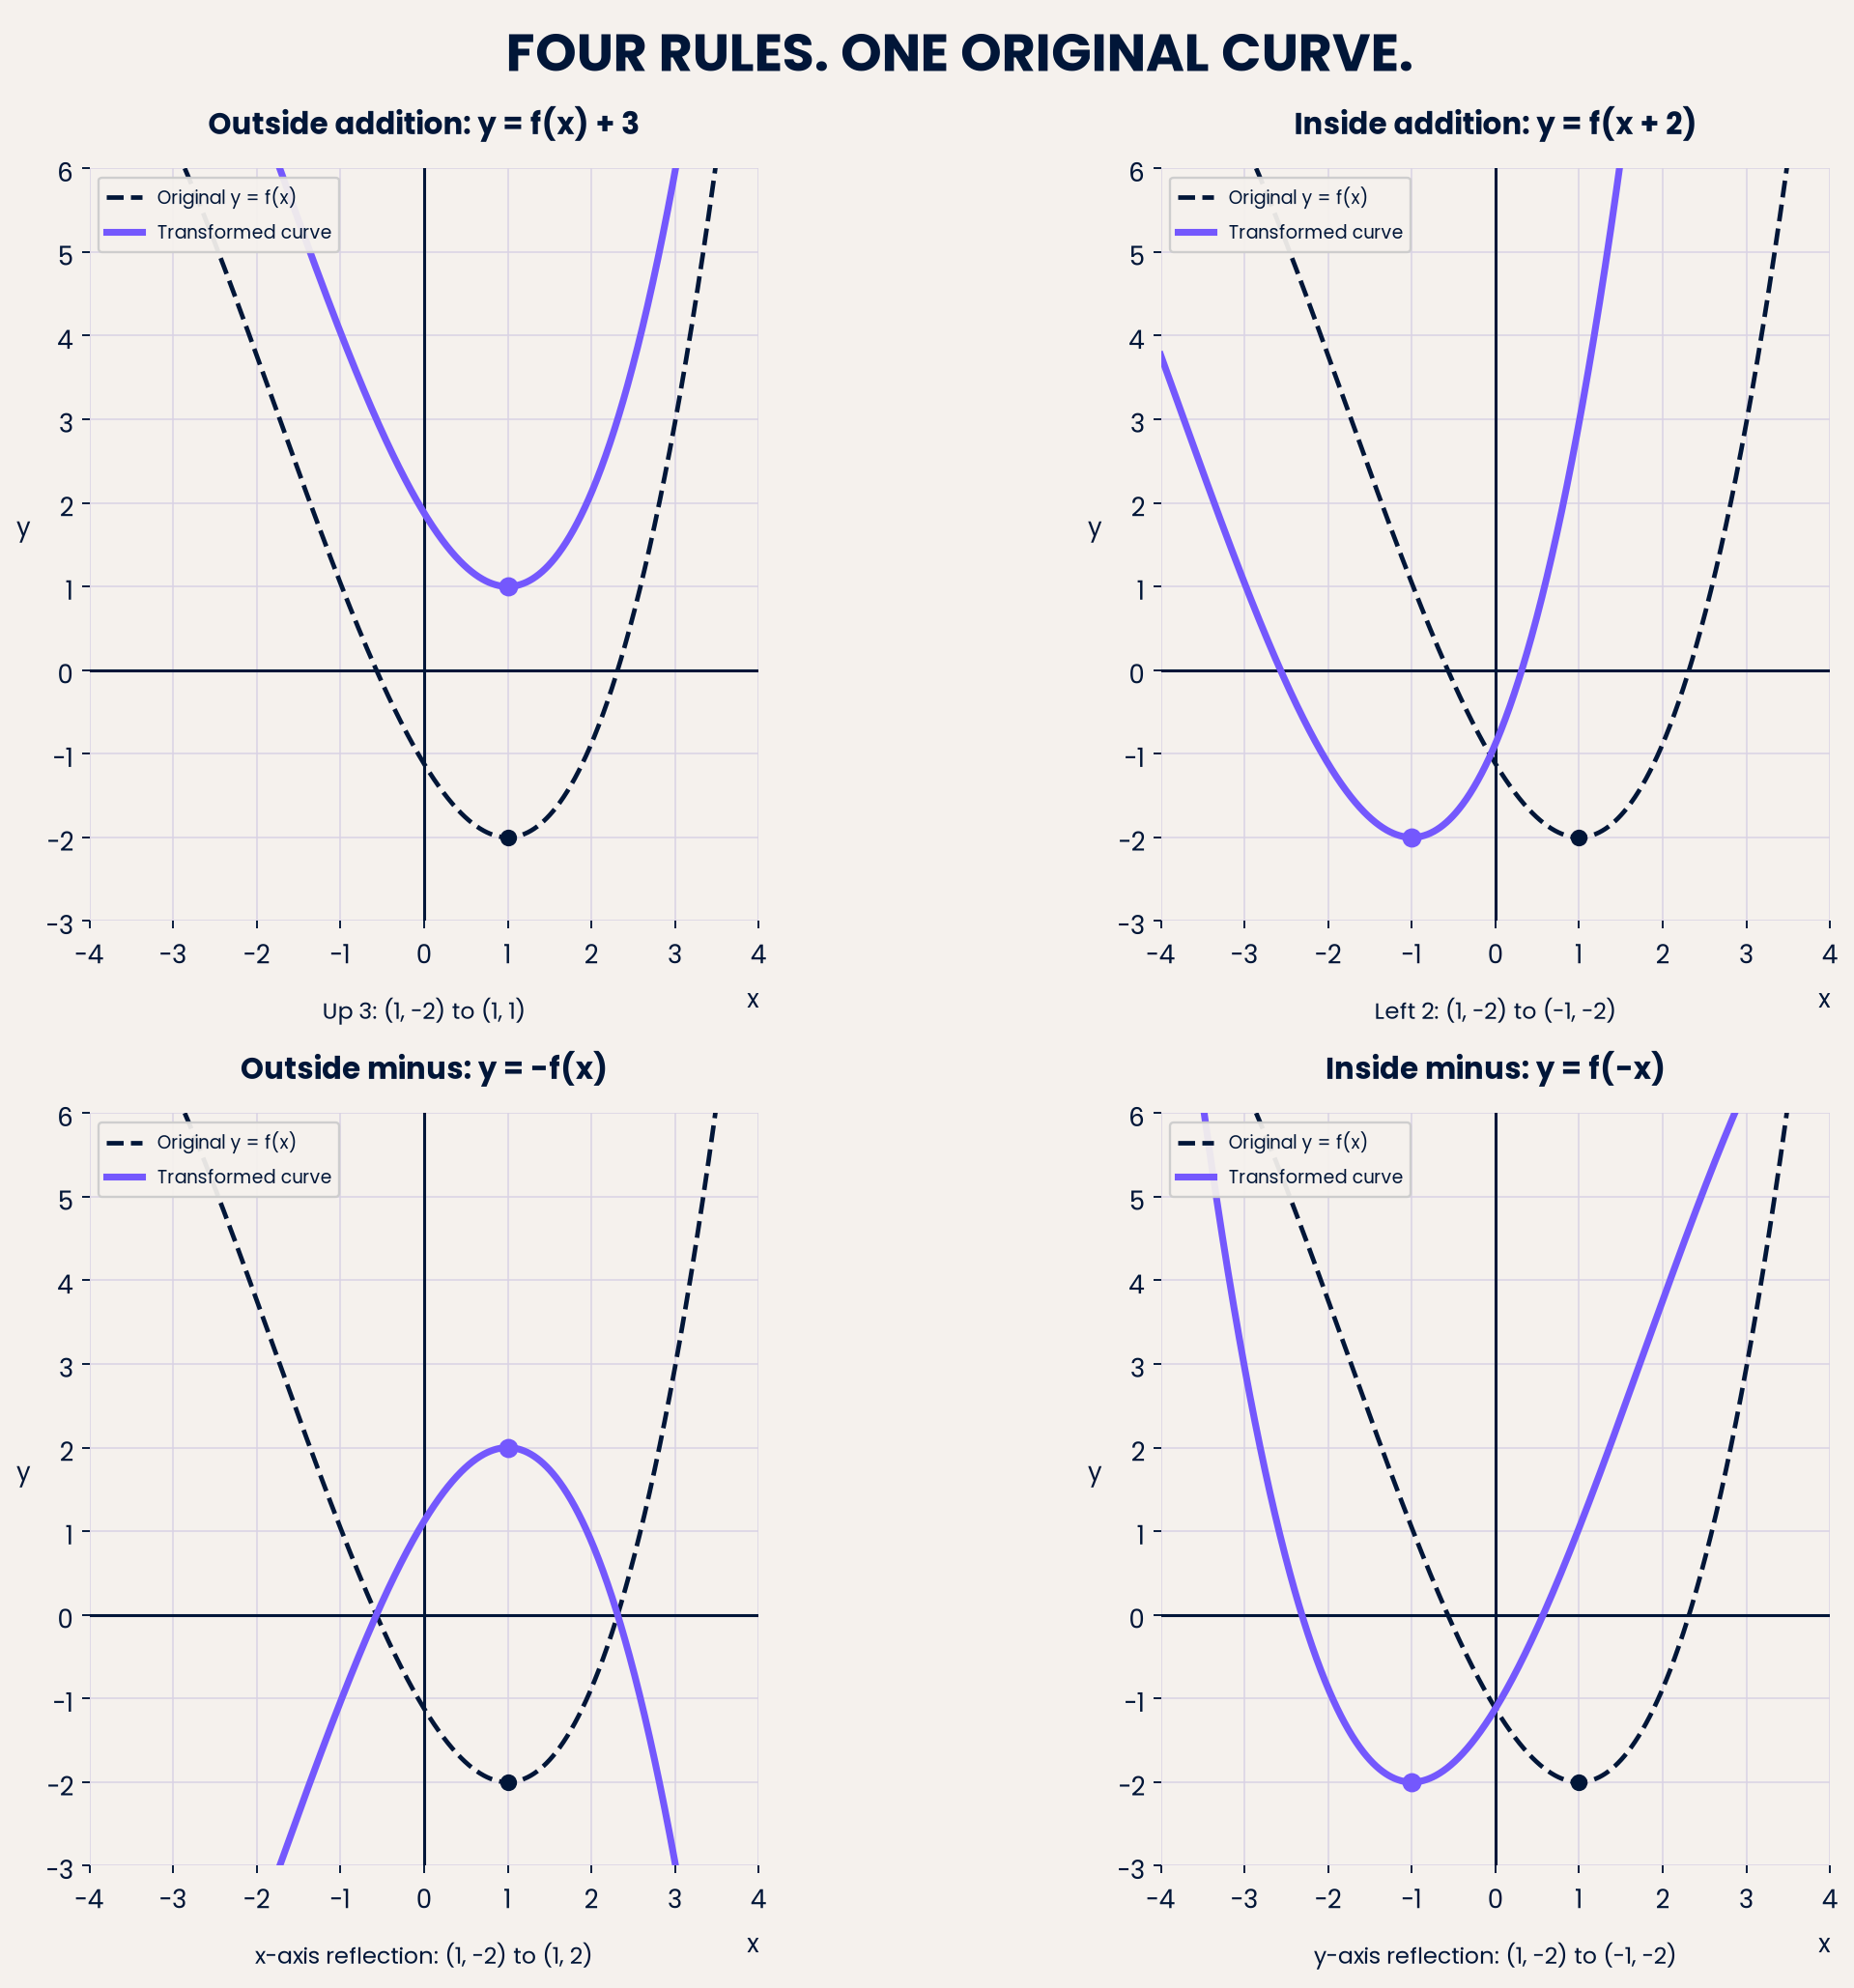
The dashed dark curve is the original; purple is its image. The atlas uses an asymmetric illustrative function with a local minimum at (1, -2), so left translation and y-axis reflection can be distinguished by the rest of the curve.

6. Sketch the whole image, not only the turning point
Choose at least three informative points: usually a turning point and two well-separated points. For a complicated curve, three points are only a starting point. Track every turning point, visible endpoint and branch needed to reproduce the shape.
Read the axis scales first. A square may represent two units, so a shift of two coordinate units might mean one square. Transform each chosen ordered pair using one consistent rule, plot its image, and draw the same kind of curve through the new points. Use a smooth line for a smooth original, not straight segments. Retain corners if the original has corners.
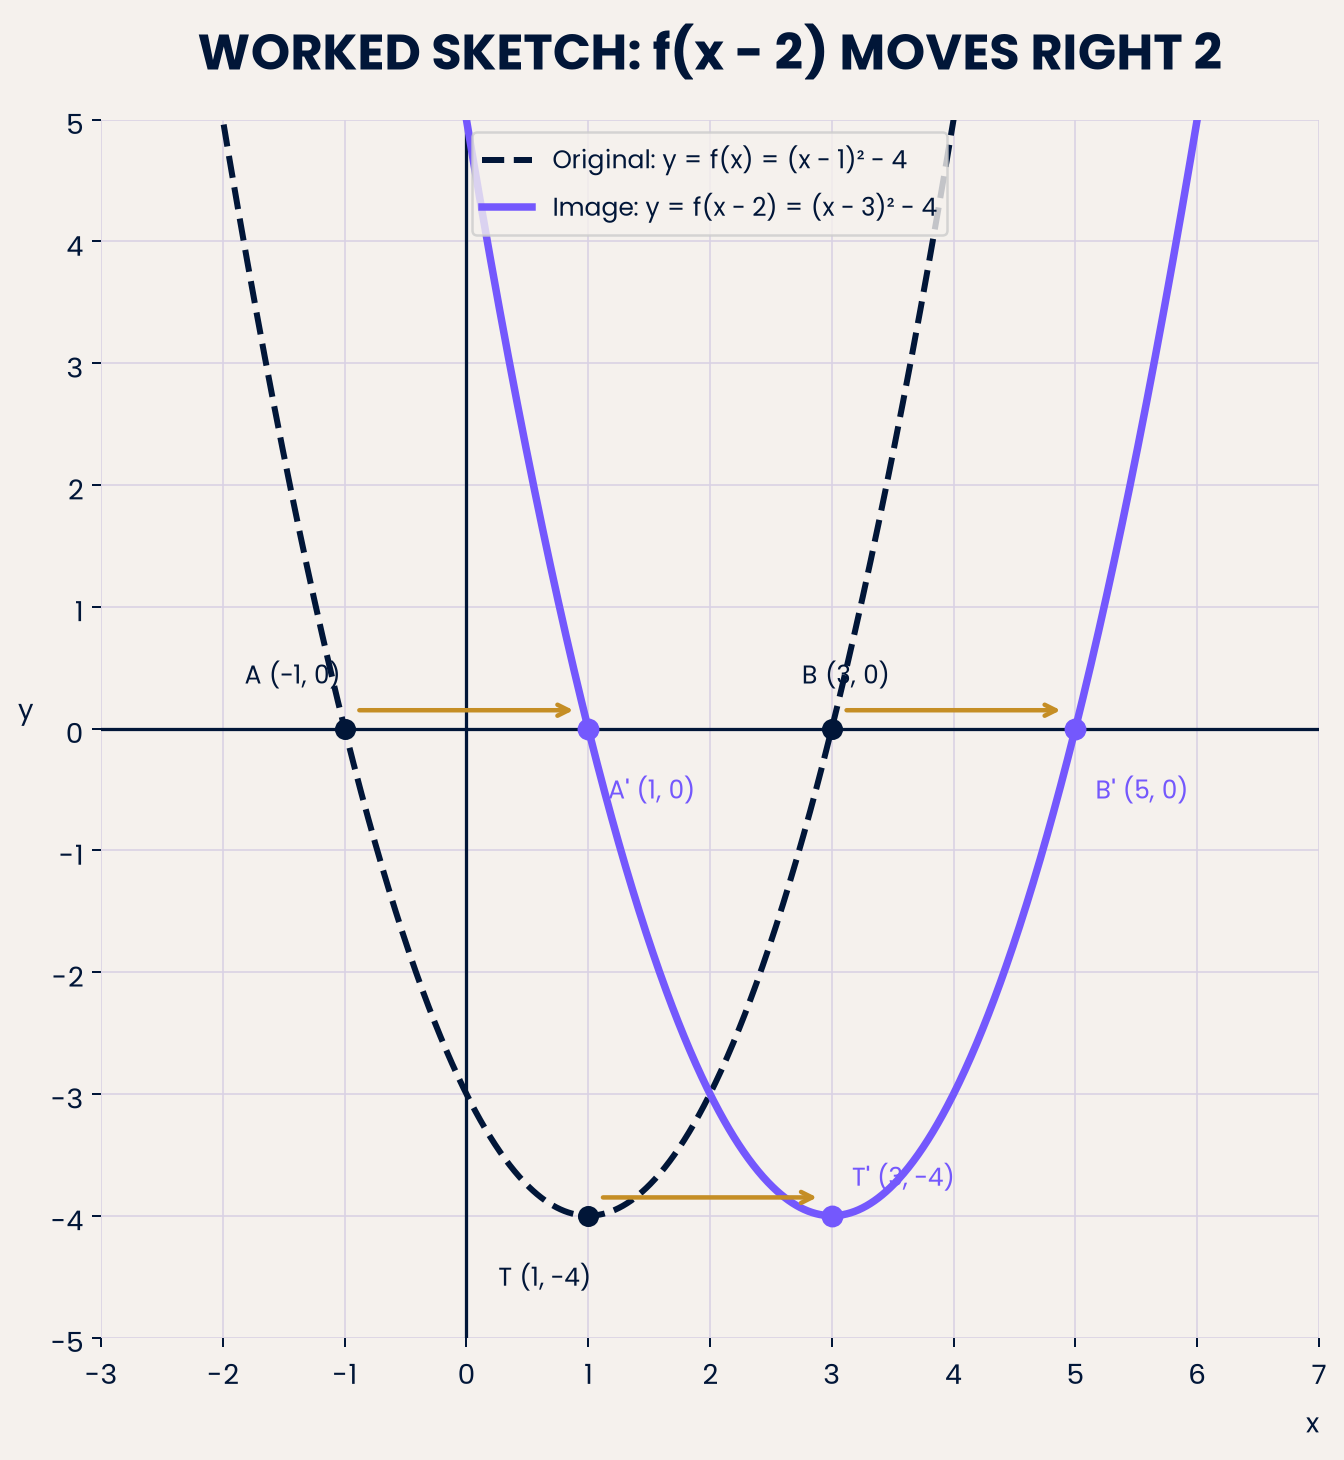
For the parabola (f(x)=(x-1)^2-4), use ((-1,0)), ((1,-4)) and ((3,0)). Under (f(x-2)), their images are ((1,0)), ((3,-4)) and ((5,0)). The entire parabola moves right two units. Label the image of the turning point and the transformed equation.

Check that each original point moves right two units with no change in height. Cover the purple curve and predict the three image coordinates before looking again.
7. Describe fully and reverse the process
For a translation, state its name and vector, with horizontal movement above vertical movement. If corresponding points are ((p,q)) and ((r,s)), the vector is (\begin{pmatrix}r-p\s-q\end{pmatrix}). Check another pair: a translation must give the same displacement for every point.
For a reflection, state its name and the equation of the mirror line. “Reflection in (y=0)” and “reflection in the x-axis” are equivalent. Do not confuse (x=0), a vertical line, with (y=0), a horizontal line.
Reverse example:A curve moves left four and down one. Its equation becomes (y=f(x+4)-1), and its vector is (\begin{pmatrix}-4\-1\end{pmatrix}). The positive inside sign records a leftward movement. A named point alone does not generally determine an entire transformation; check the curve or additional corresponding points.
8. Combine changes in the order the equation requires
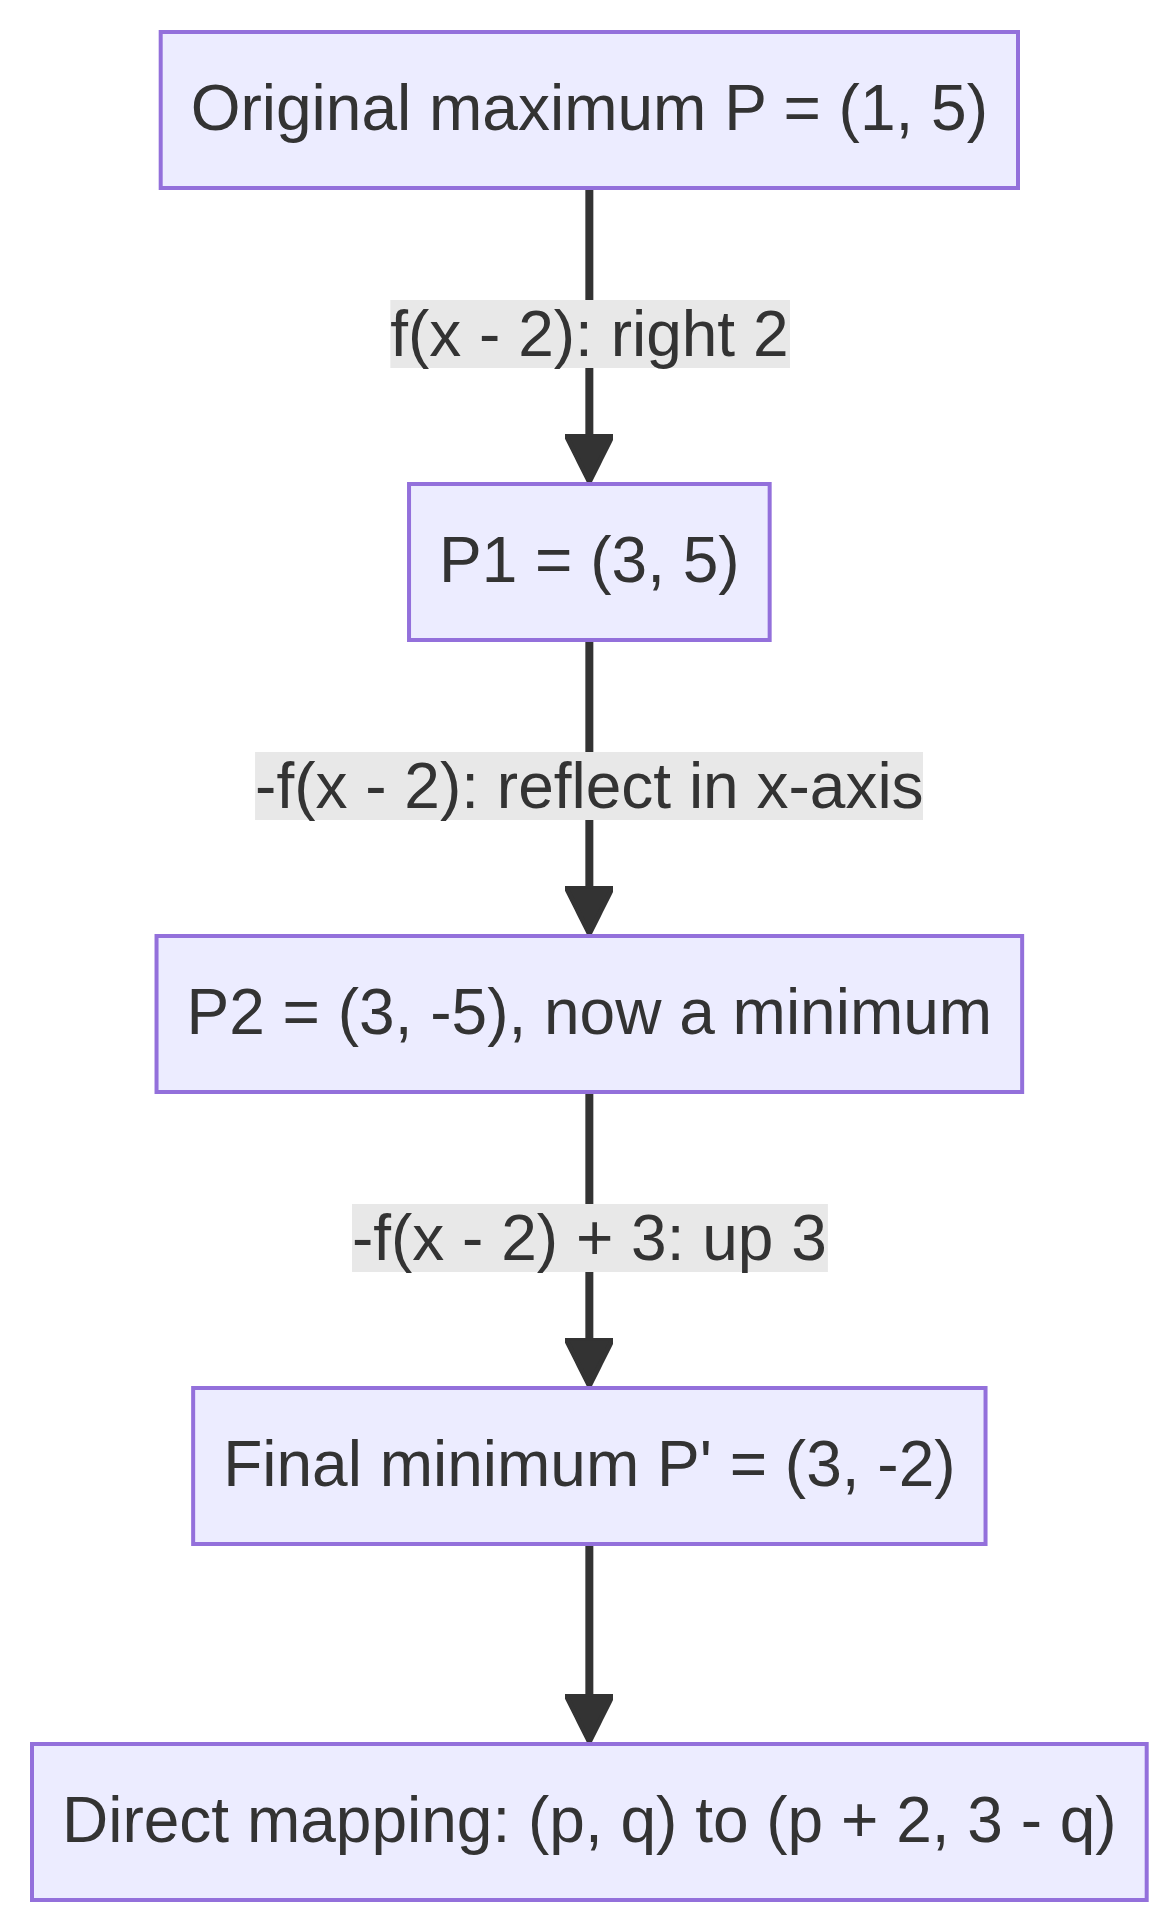
For (y=-f(x-2)+3), move right two, reflect in the x-axis, then move up three. The direct point rule is ((p,q)\mapsto(p+2,3-q)). A maximum at ((1,5)) becomes a minimum at ((3,-2)).
The order of the outside operations matters. “Reflect, then move up three” gives (-f(x)+3). “Move up three, then reflect” gives (-(f(x)+3)=-f(x)-3). Their outputs differ by six.
Horizontal and vertical translations can be tracked independently, but do not invent a universal rule that all transformations commute. With a reflection and a translation in the same coordinate direction, order can change the result. Coordinate mapping or substitution settles the question accurately.

9. Turning points, intercepts and asymptotes
Translations preserve whether a turning point is a maximum or minimum. An x-axis reflection exchanges maxima and minima; a y-axis reflection preserves their type.
An image of an intercept is not necessarily an intercept. Under a sideways translation, an original y-intercept moves off the y-axis. Under a vertical translation, an original x-intercept moves off the x-axis. For (g(x)=f(x+a)+b), the new y-intercept is ((0,f(a)+b)); its roots satisfy (f(x+a)=-b).
If a reciprocal graph has an asymptote, transform that line too. Translating (y=1/x) right two and up one gives (y=1/(x-2)+1), with asymptotes (x=2) and (y=1). Do not connect branches across an asymptote. This is an application of the same translations, not an extra stretch rule.
Mathematical Relationships
All transformation and coordinate rules below are Must memorise. They are not supplied on Pearson's 2026 Higher-tier formula sheet. No formula from that sheet is needed for the four core transformations. 5
(y=f(x)+a:\quad(p,q)\mapsto(p,q+a)), vector (\begin{pmatrix}0\a\end{pmatrix}).
(y=f(x+a):\quad(p,q)\mapsto(p-a,q)), vector (\begin{pmatrix}-a\0\end{pmatrix}).
(y=-f(x):\quad(p,q)\mapsto(p,-q)), reflection in (y=0).
(y=f(-x):\quad(p,q)\mapsto(-p,q)), reflection in (x=0).
(y=f(x-h)+k:\quad(p,q)\mapsto(p+h,q+k)), vector (\begin{pmatrix}h\k\end{pmatrix}).
For combined reflections and translations, (y=\varepsilon f(\delta(x-h))+k) maps ((p,q)) to ((h+\delta p,k+\varepsilon q)), where (\varepsilon,\delta\in{$-1,1}). This compact rule is Must memorise if used, but it is optional: the four basic rules and step-by-step tracking are sufficient.$
Here (p,q) are original coordinates; (a,h,k) are signed constants. The symbols (\varepsilon) and (\delta$) choose whether the output and horizontal coordinate are reversed. Also Must memorise: (f(p)=q); vector ((r-p,s-q)), written as a column; and, for (g(x)=f(x+a)+b), (g(0)=f(a)+b). These relationships explain coordinate reading, descriptions and intercept checks.$
Exam Focus: marks, timing and command words
Each 1MA1 paper lasts 90 minutes for 80 marks, giving an overall budget of (90/80=1.125) minutes per mark. Allow approximately 3-4 minutes for 3 marks, 4-5 for 4 marks, and 6-7 for 6 marks, adjusting to difficulty and leaving checking time. This is revision guidance, not a Pearson timing instruction. A13 can appear on the non-calculator paper or either calculator paper. 1
Official examples: Pearson's teaching guidance reproduces New SAMs Paper 2H Q19: a sketch of (f(-x)) for 1 mark, and a sketch of (-f(x)+3) for 1 mark. It also includes a 2-mark coordinate question for (-f(x+3)). 2
In June 2024 Paper 2H Q21, the official scheme awards C2 for the fully correct transformation; C1 is available for specified partial work, including one correct component or at least two correctly transformed final points. This does not guarantee a direction-only mark in every question. Individual schemes take precedence. 3 4
Sketch means show the transformed curve with its defining features. Write down means provide the requested coordinates or expression directly. Describe fully means transformation plus vector or mirror line. Explain needs a mathematical reason: for example, (x+2=p), so the new horizontal coordinate is (p-2). Do not replace mathematical calculation with generic essay advice about “both sides”.
The worked and practice questions in this resource are original Edexcel-style questions. Their stated allocations are indicative teaching schemes, not official Pearson mark schemes.
Practical Applications and Synoptic Understanding
A fixed additional charge changes a cost graph from (C(x)) to (C(x)+a): every cost increases equally. Delaying a time-dependent signal by two seconds changes it to (s(t-2)): the same event occurs later, a rightward translation. Changing a signed height convention from above-ground positive to below-ground positive negates the output, illustrating an x-axis reflection.
For trigonometric graphs, a shift of (\sin(x)) to (\sin$(x-30^\circ)) moves the graph right 30 degrees, not 30 grid squares. GCSE trigonometric graph arguments are in degrees. Follow labelled units; a 30-second delay is 0.5 minutes if the horizontal axis uses minutes. Pure coordinate questions normally have no physical units, so do not attach centimetres to an ordered pair. 1$
There is no required practical for this GCSE Mathematics topic. Graphing software or tracing paper can help you check a practice sketch, but the exam answer must demonstrate the required graph or coordinates.
Listen, Retrieve and Check
Ten-minute female-tutor podcast: 00:00 introduction; 01:00 core concepts; 06:00 exam tips; 08:00 recall quiz; 09:00 summary. Pause whenever you need longer to answer.
Close the guide and write all four point rules from memory. Then apply each to ((1,5)), check your answers and explain any error. Revisit tomorrow, three days later and one week later. Mix examples rather than practising only one rule at a time. Explaining why the inside sign reverses direction is a stronger check than recognising a familiar diagram.
References
Visual Resources
4 diagrams and illustrations
](https://xnnrgnazirrqvdgfhvou.supabase.co/storage/v1/render/image/public/study-guide-assets/guide_153027e2-c2dd-460e-ba70-35080ca46dd8/graph_transformation_atlas.png?width=800&format=webp&resize=cover&quality=80)
](https://xnnrgnazirrqvdgfhvou.supabase.co/storage/v1/render/image/public/study-guide-assets/guide_153027e2-c2dd-460e-ba70-35080ca46dd8/worked_translation.png?width=800&format=webp&resize=cover&quality=80)
](https://xnnrgnazirrqvdgfhvou.supabase.co/storage/v1/render/image/public/study-guide-assets/guide_153027e2-c2dd-460e-ba70-35080ca46dd8/transformation_decision.png?width=800&format=webp&resize=cover&quality=80)
](https://xnnrgnazirrqvdgfhvou.supabase.co/storage/v1/render/image/public/study-guide-assets/guide_153027e2-c2dd-460e-ba70-35080ca46dd8/combined_mapping.png?width=800&format=webp&resize=cover&quality=80)
Interactive Diagrams
2 interactive diagrams to visualise key concepts
Conceptual Flow Outline
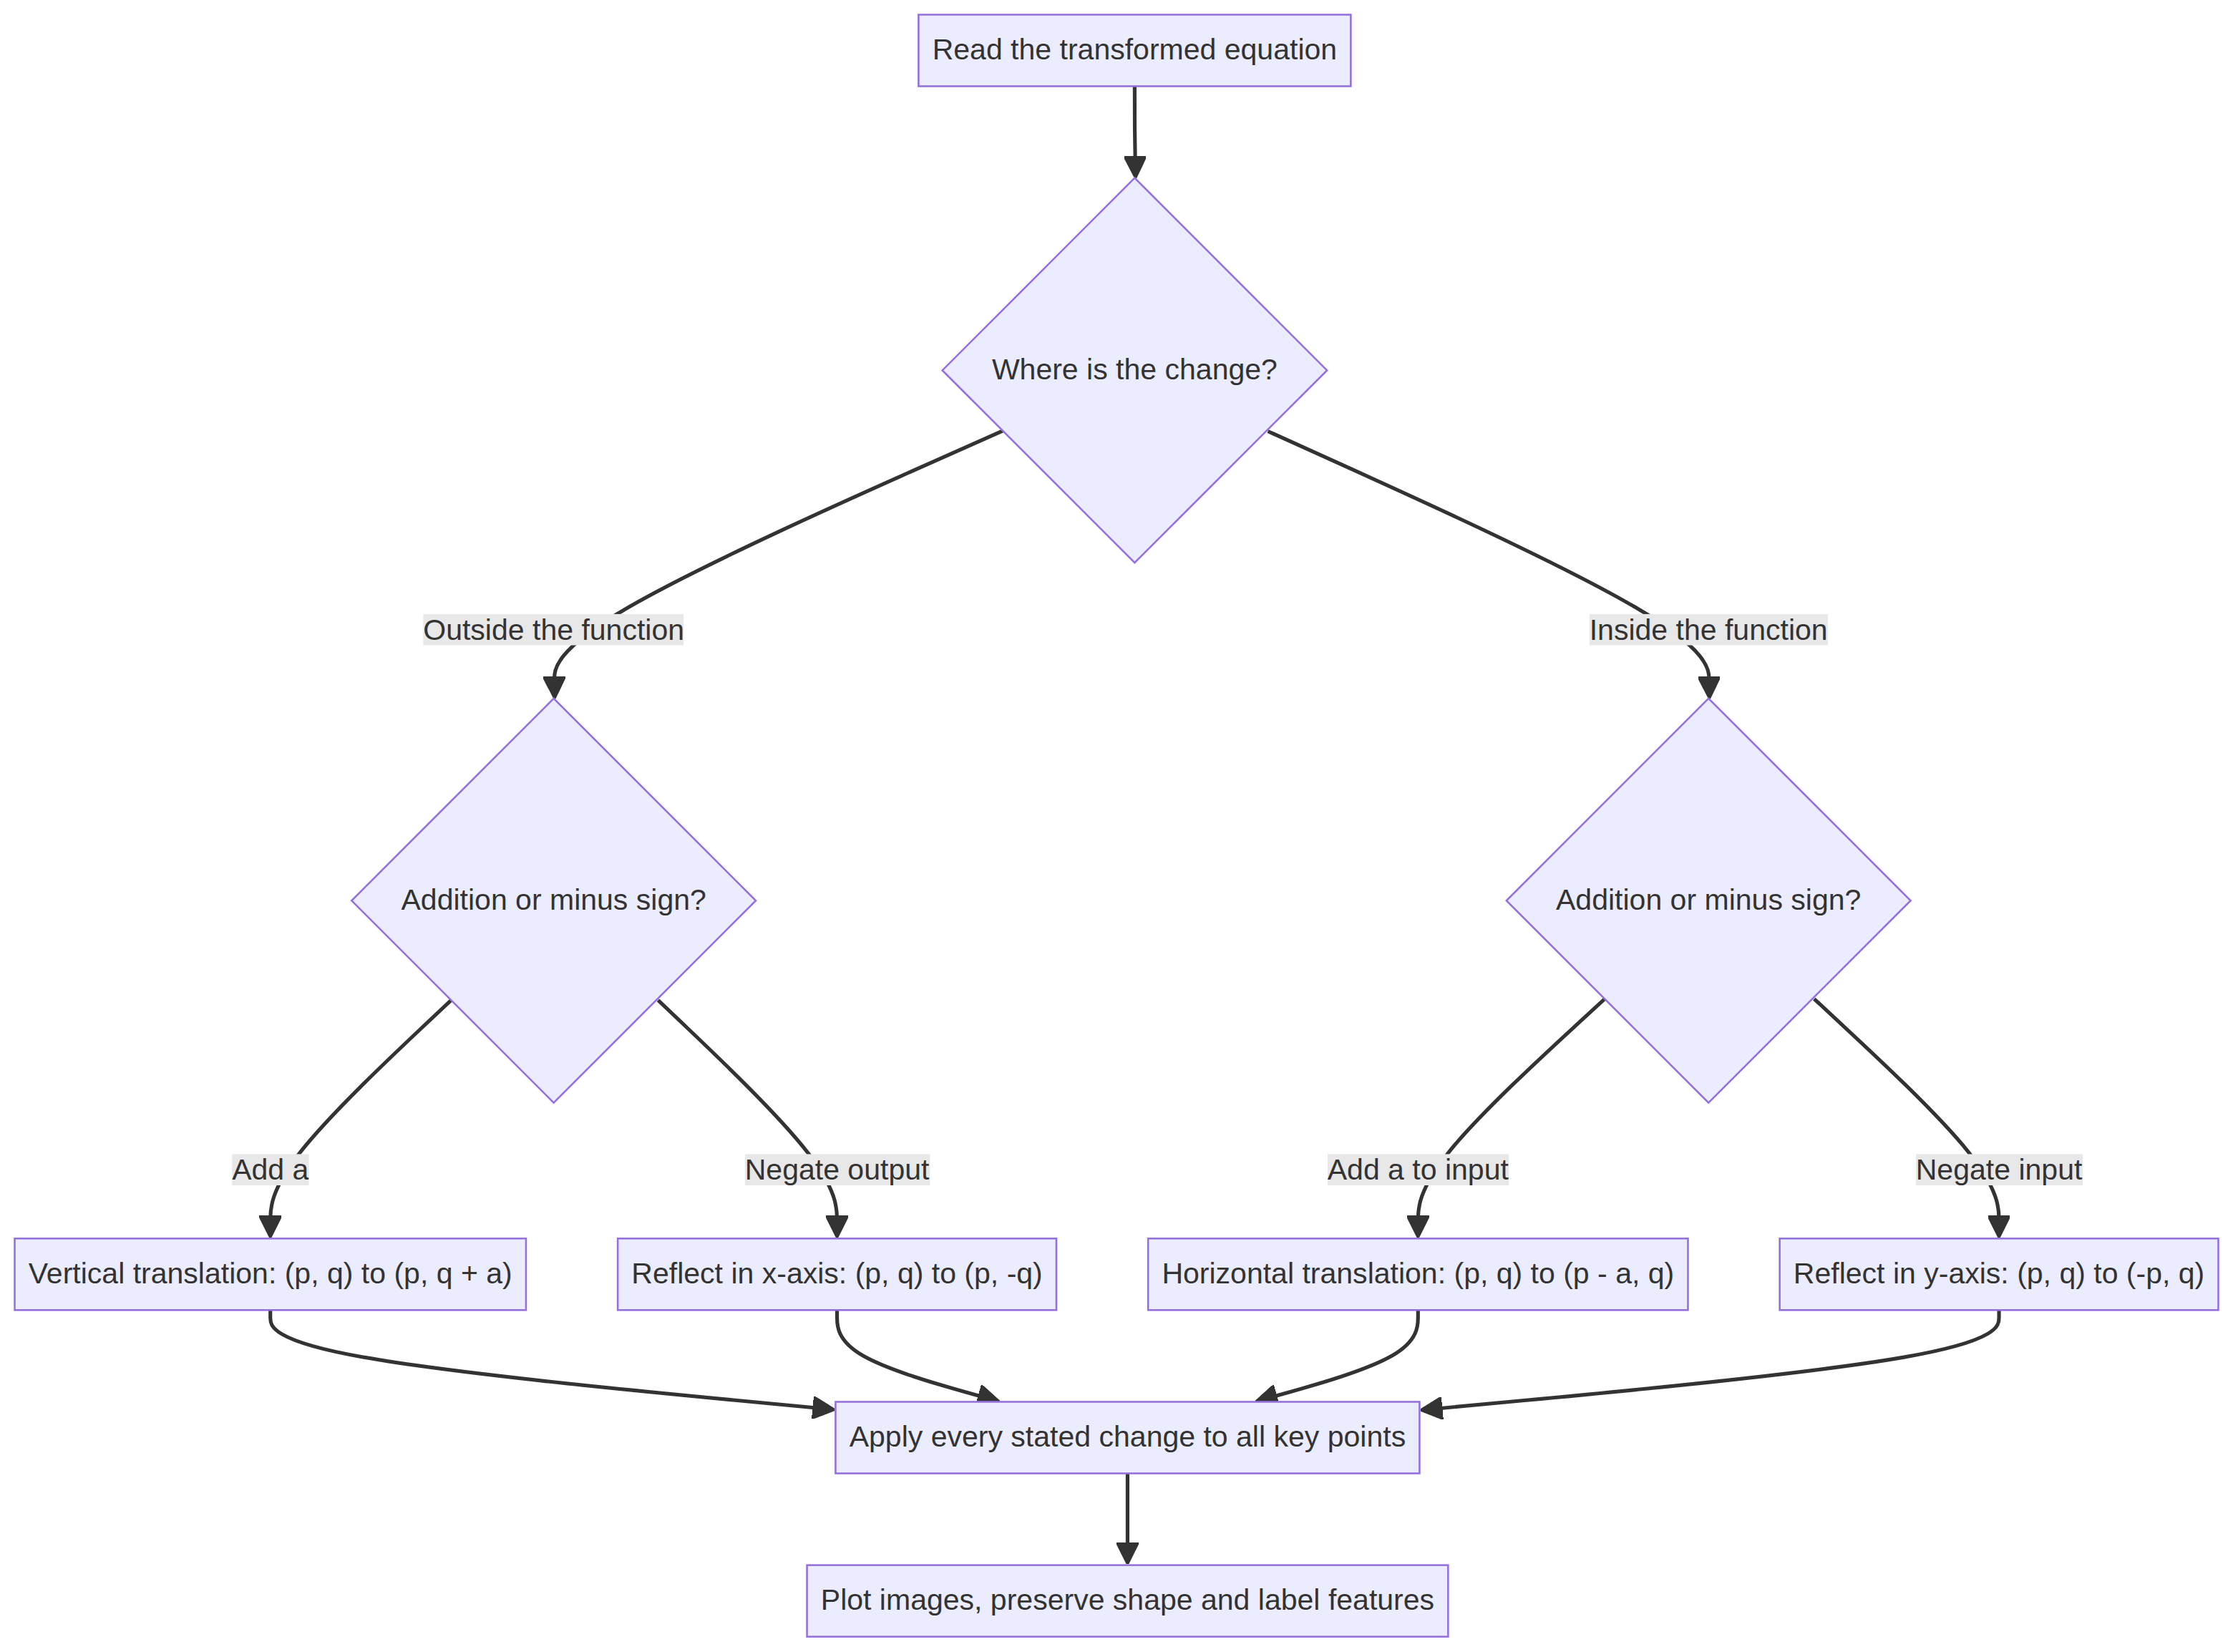
Choose the rule by separating input changes from output changes, then transform the whole curve.
Conceptual Flow Outline
Coordinate tracking for y = -f(x - 2) + 3, with the maximum becoming a minimum.
Worked Examples
4 worked examples — open one to explore the question and available guidance.
Practice Questions
Try the question, then reveal an answer plan or example response
Write down the image of P(-2, 3) under (a) y = f(x) + 4, (b) y = f(x + 4), and (c) y = -f(x). Each part is worth 1 mark.
Hint: Here foundation means introductory difficulty within this Higher-only topic. Decide which coordinate changes in each part.
The point P(3, -4) is on y = f(x). For y = f(-x), (a) write down its image (1) and (b) describe fully the transformation (2).
Hint: An inside minus changes the horizontal coordinate.
A curve y = f(x) is translated so that A(-1, 2) maps to A'(2, -2) and B(3, 5) maps to B'(6, 1). (a) Describe fully the translation (2). (b) Write the new equation in terms of f (1). (c) Find the image of T(1, -3) (1).
Hint: Subtract original coordinates from image coordinates, then reverse the sign for the inside expression.
The curve y = f(x), where f(x) = (x - 1)^2 - 4, has minimum (1, -4) and x-intercepts (-1, 0), (3, 0). Sketch y = f(x + 2), clearly showing its minimum and both x-intercepts.
Hint: Map all three supplied points left two.
A curve y = f(x) has a maximum at P(1, 5) and passes through A(-1, 0), B(3, 0). It is transformed to y = -f(x - 2) + 3. (a) Find the image of P (2). (b) State the turning-point type (1). (c) Find the images of A and B (2).
Hint: Use (p, q) to (p + 2, 3 - q).
The point P(-2, 3) lies on y = f(x). Let g(x) = f(4 - x) + 1. (a) Find the image of P, showing how you obtain the new input coordinate (3). (b) Describe a sequence of transformations from f to g (3).
Hint: To preserve the old input, solve 4 - x = -2. For the description, f(4 - x) = f(-(x - 4)).
Exam technique
How to turn what you know into marks
How to approach the question
Identify the command word and each part's marks. Locate changes inside or outside f. Read scales, select key points, map them consistently and check the whole curve. For a combined input such as 4-x, solve the new input expression equal to the old input. Do not infer an entire transformation from only one point.
How to structure your answer
For 1-mark write-down parts, supply the requested ordered pair or precise fact. For a full translation description, write translation and its column vector; for a reflection, write reflection and its mirror line. For 3-4-mark sketch tasks, plot informative images and reproduce the complete curve with requested labels. In 5-6-mark multi-part questions, separate coordinate mapping, turning-point type and algebraic substitution. These allocations describe this guide's indicative practice, not a universal Pearson scheme.
Timing
90 minutes / 80 marks = 1.125 minutes per mark overall. Aim for about 3-4 minutes for 3 marks, 4-5 for 4 marks, 6-7 for 6 marks. This is a planning estimate, not an official Pearson rule; leave checking time.
Common pitfalls
- Inside +a moves left for positive a, not right: solve x+a=p to check.
- Do not exchange -f(x) with f(-x): outside negates y, inside negates x.
- Do not widen, narrow or distort the curve; translate or reflect the whole shape.
- Do not move only the turning point; track branches, endpoints and other informative points.
- Give a column vector or mirror-line equation, not merely left or flip.
- Check coordinate units, not just grid squares.
- An image of an old intercept may no longer be an intercept.
- Correct-direction partial credit is question-specific, not guaranteed.
What the command words want
- Sketch
- Show the transformed curve with its correct shape, position, branches and requested features. Plot useful points and label the curve.
- Compare
- Identify specific unchanged and changed features, such as identical shape and height but different horizontal position.
- Explain
- Give a mathematical reason. For example, x+2=p means the same original input occurs at x=p-2.
- Describe
- Name the transformation and give its defining information: column vector for translation, mirror line for reflection.
- Evaluate
- In GCSE Mathematics, evaluate normally means work out a numerical value, not write a balanced essay. Evaluate f(-2) by substituting -2 into the whole formula.
- Calculate
- Use the coordinate rule or substitute into the transformed function. Show working when required and include physical units only if the context has them.
- Show that
- Give a valid chain of working reaching the stated result; copying the target answer alone earns no demonstration credit.
- State/Give
- Give exactly the requested coordinates, turning-point type or mathematical fact. An ordered pair must be x first, y second.
- Write down
- A direct answer is usually enough where working is not requested; identify it clearly and do not add contradictory statements.
- Describe fully
- A complete description is translation by a specified column vector, or reflection in a specified line. Give all stated changes in the correct order for a sequence.
Watch or listen (optional)
Test your understanding of Algebra - Graphs
Active recall beats re-reading. Take an instant quiz now to test what you’ve learned and lock it into long-term memory.
7 days Premium · Then the free plan continues · No card, no charge