Pearson Edexcel · GCSE · Mathematics
Course version: 1MA1 · Version from Mar 2026
Algebra - Graphs: identify and interpret roots, intercepts, turning points of quadratic functions graphically; deduce roots algebraically (Foundation tier)
A parabola is a picture of an equation: its roots, intercepts and turning point reveal exactly what the algebra is doing. This Foundation guide teaches candidates to read those features accurately, factorise simple quadratics and avoid sign errors that cost marks. Download the complete [study-guide JSON](/home/ubuntu/quadratic_graphs_guide/quadratic_graphs_study_guide.json).
- 12 min read
- 5 worked examples
- 9 practice questions
- 13 key terms
Try the lesson
The start of the Algebra - Graphs: identify and interpret roots, intercepts, turning points of quadratic functions graphically; deduce roots algebraically (Foundation tier) lesson, made from checked teaching notes for this specification point.
Have a go first
The graph of y = (x − 2)(x − 6) crosses the x-axis at two points. What are the x-coordinates of these two points?
There is more to this lesson
The full lesson goes on to check your understanding and help you earn the marks. Create a free account to carry on, with your progress saved.
7 days Premium · Then the free plan continues · No card, no charge
Check what you remember
Read the wording for your board, then hide it and explain quadratic graph in your own words. Rough notes are fine. This is a self-check, with no mark or grade.
Reference: Pearson Edexcel
The graph of y = ax² + bx + c, where a ≠ 0; it is a parabola with highest x-power two.
Study Notes
Overview
A quadratic graph tells two versions of the same story: a curved picture and an algebraic rule. This topic teaches you to translate between them, identifying the roots, the intercepts and the turning point, then finding suitable roots exactly by factorising. Recognising those features helps candidates answer short graph-reading questions and longer questions combining a table of values, a drawing and an equation.
The central example is y = x² − 5x + 6. You will see why its roots are 2 and 3, why its y-intercept is (0, 6), and why its minimum lies between the roots rather than on the y-axis. Every step uses skills you already meet elsewhere: coordinates, substitution, negative numbers, expanding brackets and solving linear equations.
For Pearson Edexcel Foundation, the main specification reference is 1MA1 A11, supported by A18. Read turning points graphically and solve simple monic quadratics by factorising. Completing the square and the quadratic formula are Higher-tier methods, not requirements for this lesson. Typical command words include write down, estimate, factorise, solve, sketch and explain. 1 2
Key Concepts
1. Recognising a quadratic and its shape
A quadratic function can be written y = ax² + bx + c, where a, b and c are constants and a ≠ 0. The highest power of x is two. Its graph is a parabola: one smooth curve, not a V and not a collection of straight line segments.
If a > 0, the parabola opens upwards and has a minimum. If a < 0, it opens downwards and has a maximum. The sign of the constant c does not decide the opening direction. For example, y = x² − 10 still opens upwards, whereas y = −x² + 10 opens downwards.
Why does the squared coefficient matter? For large positive or negative x, x² is positive and the ax² term dominates the linear and constant terms. A positive coefficient sends both ends upwards; a negative coefficient sends both ends downwards. The middle can move, but the ends retain that behaviour.
Cover and recall: Which opens downwards, y = x² − 4 or y = −x² + 4? Explain using the coefficient of x², not the constant.
2. Roots and x-intercepts: related, but not identical answers
A root is an x-value that makes the function zero. On a graph, a root is read where the curve meets the x-axis, because every point on that axis has y = 0. An x-intercept is the corresponding point, written as coordinates.
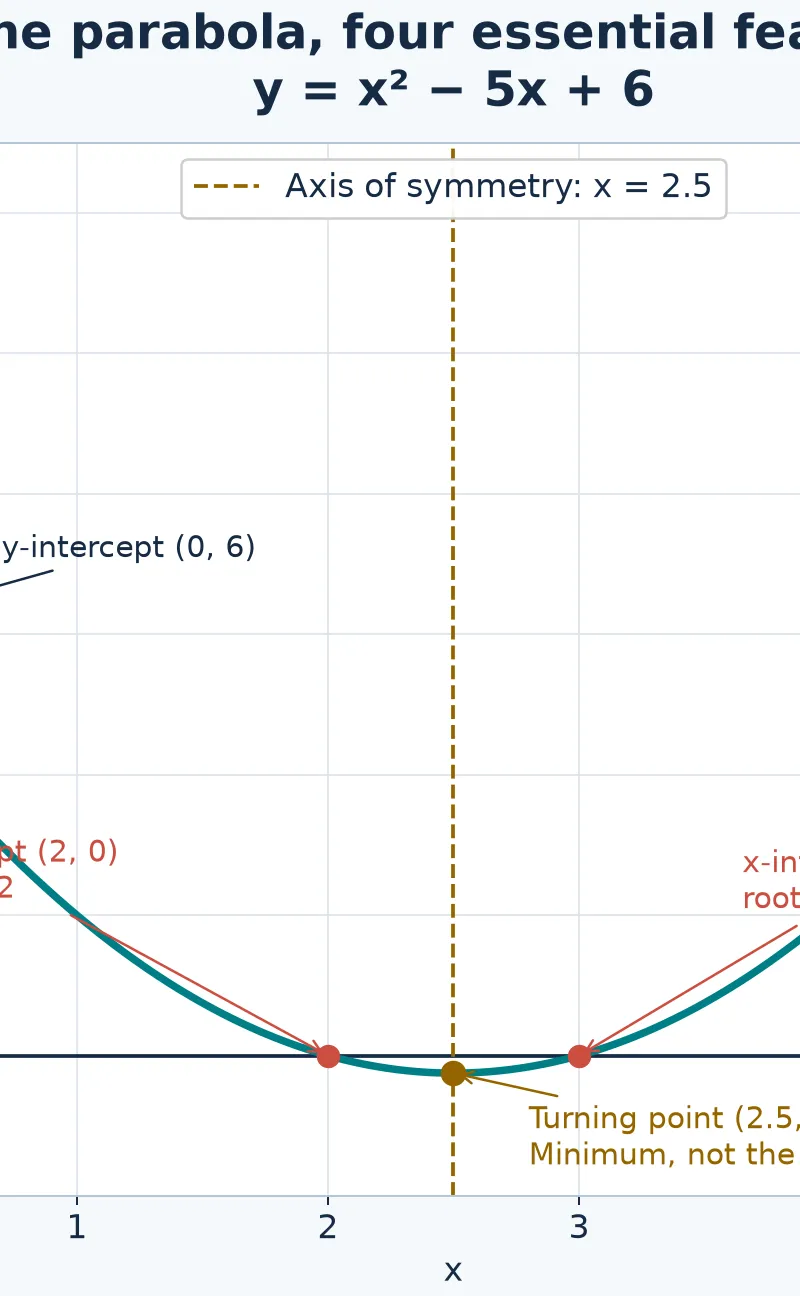
For y = x² − 5x + 6, the roots are x = 2 and x = 3. The x-intercepts are (2, 0) and (3, 0). If the question asks for roots, give the x-values. If it asks for coordinates of intersections, give both coordinate pairs. Read the actual wording rather than assuming the answer format.
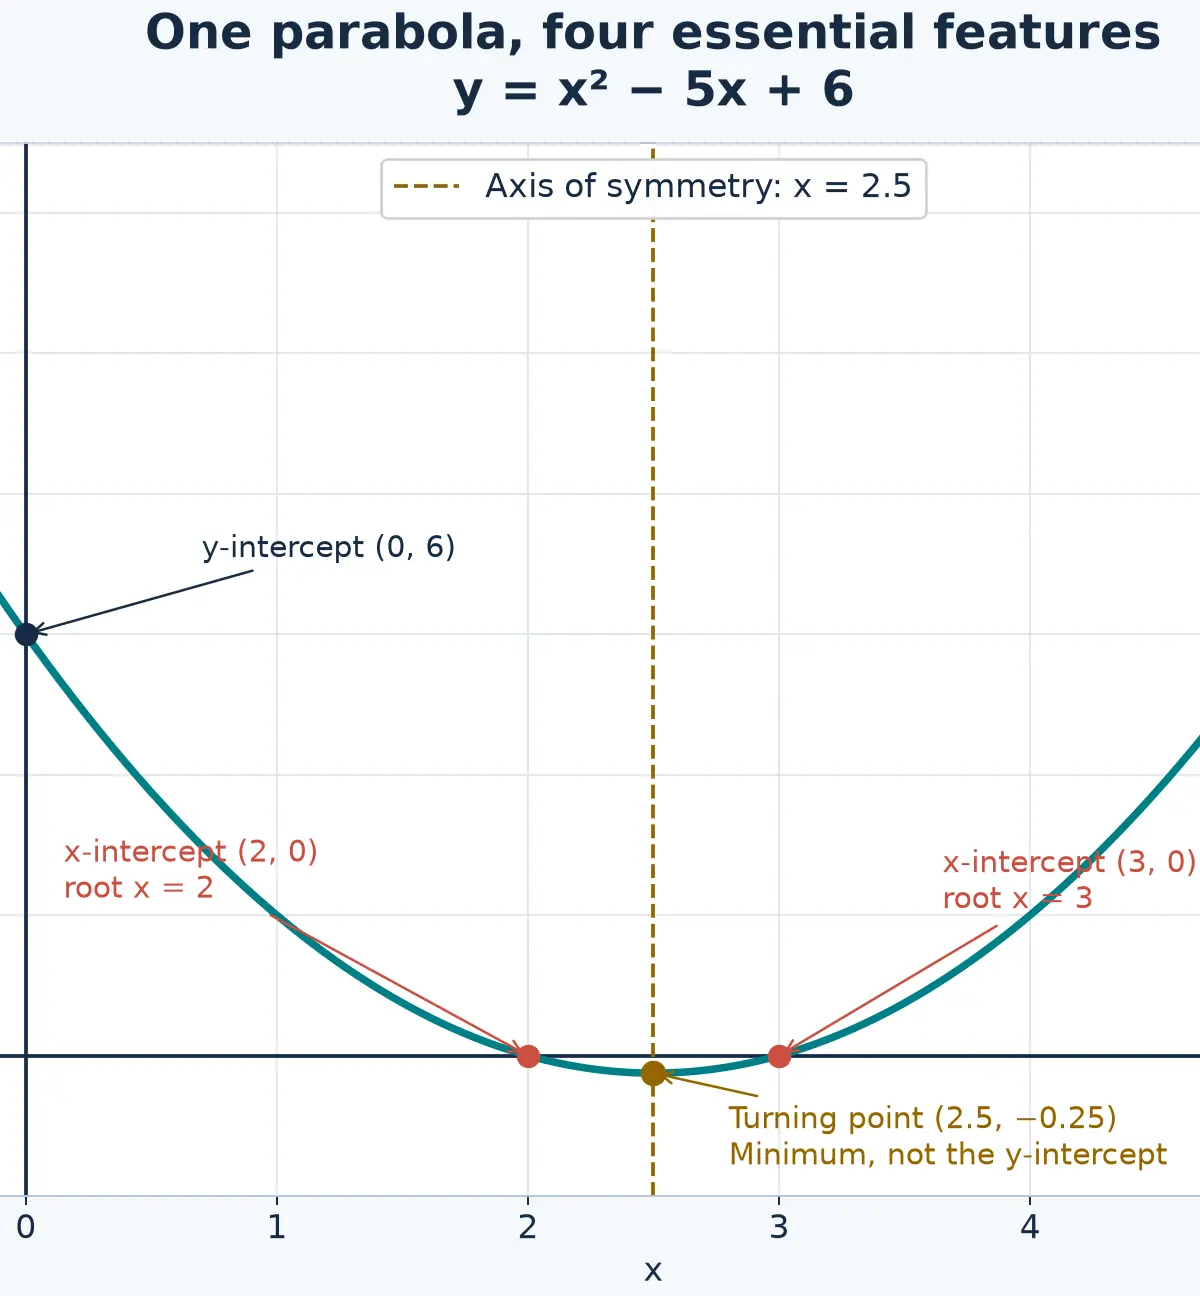
This labelled graph is a learning aid. The gold point is the minimum; the coral points identify the roots; the dark point is the y-intercept. Cover the labels and explain what makes each feature different. The units on the two axes need not have the same physical spacing, so read each scale independently.
A graph can provide approximate roots even when the quadratic does not factorise into convenient integer brackets. Check the scale and estimate sensibly between gridlines. Do not write a long decimal that the printed graph cannot support.
3. Two roots, one repeated root, or no real roots
An upward-opening parabola can cross the x-axis twice, touch it once, or remain above it. A downward-opening parabola can likewise have two crossings, a single touch, or remain below it. Count where the entire relevant curve meets the axis, not just where it crosses through.
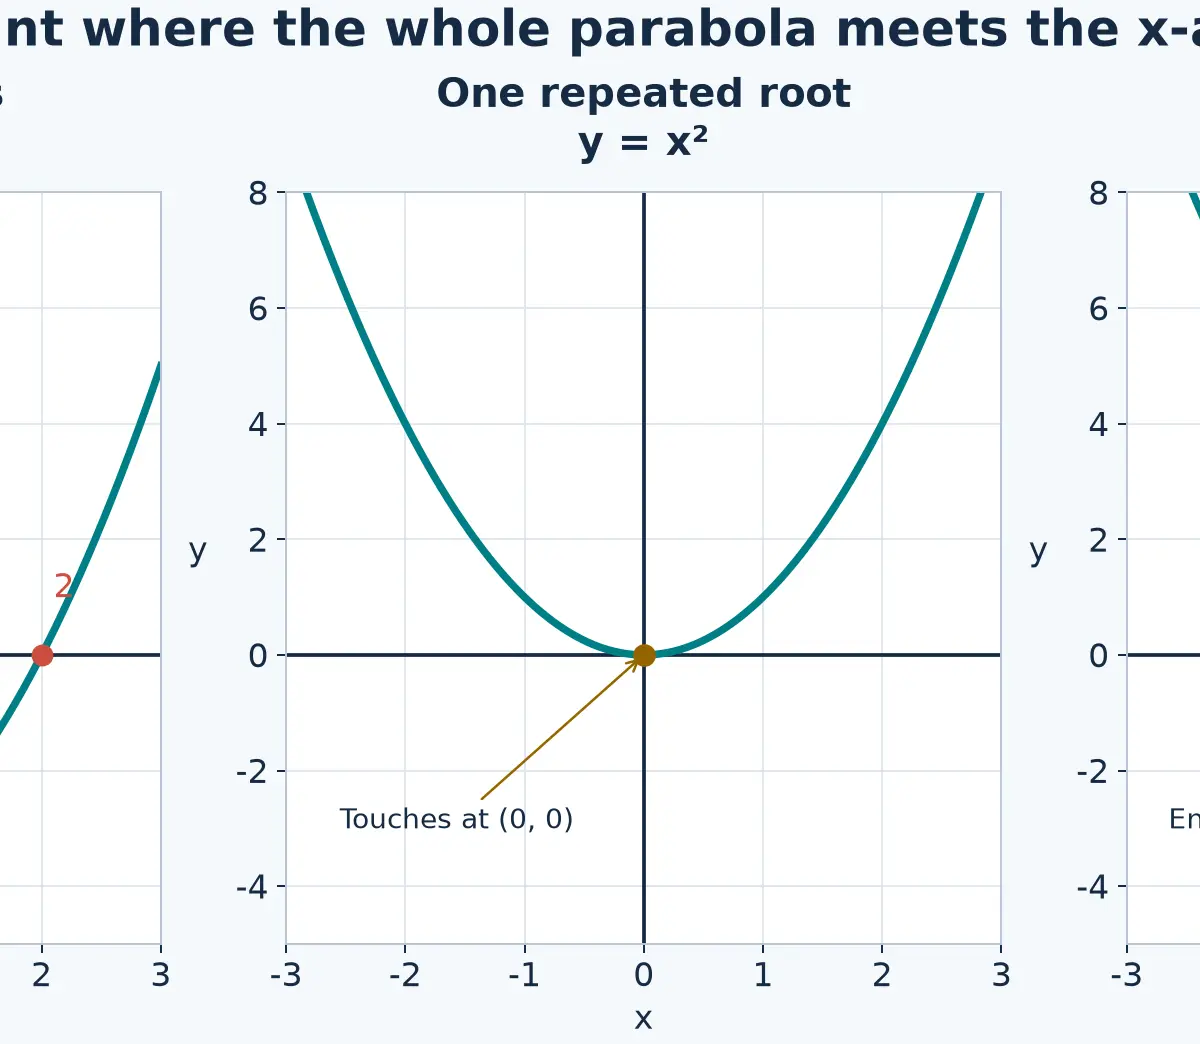
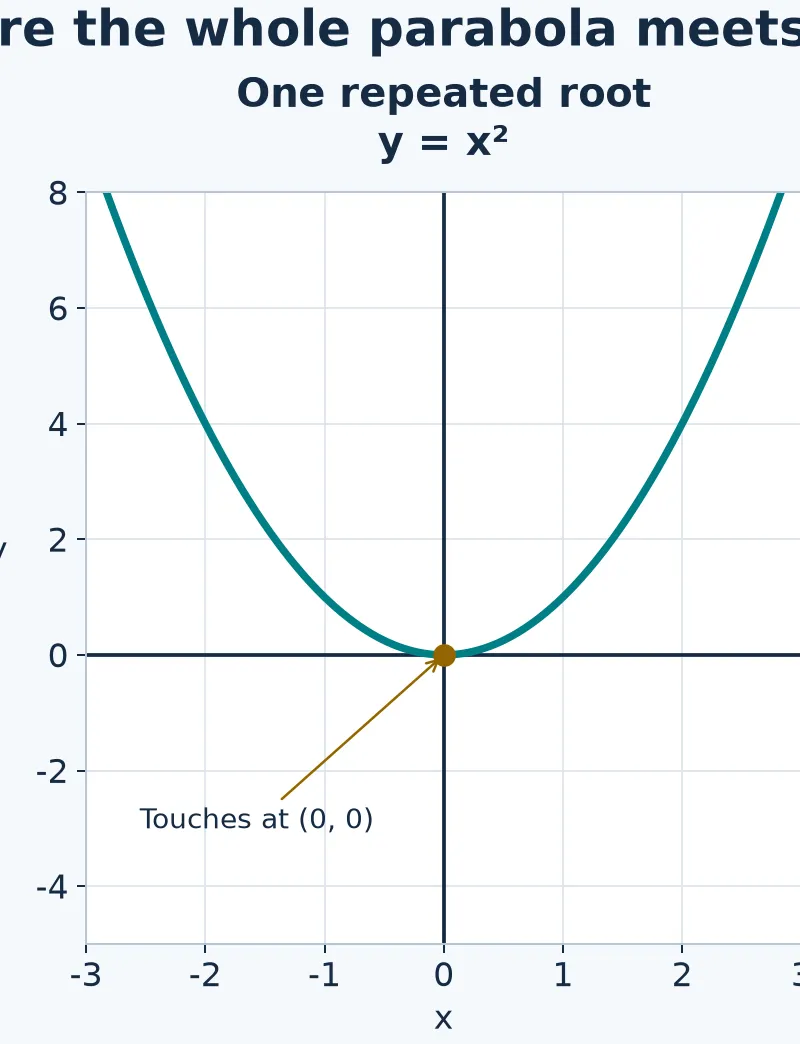
For y = x² − 4, the roots are −2 and 2. For y = x², the curve touches at (0, 0): x = 0 is one distinct real root, called a repeated root. For y = x² + 2, the minimum is above the x-axis, so there are no real roots. You do not need to calculate a discriminant or discuss complex numbers here.
Be cautious with a restricted graph window. An unseen part of the curve might meet the axis outside the printed interval. State conclusions supported by the graph and the information supplied.
Why question: Why does touching the axis count as a root? Because the function still equals zero there, even though the curve does not cross to the other side.
4. Finding the y-intercept by substitution
Every point on the y-axis has x = 0. Substitute zero into the equation, simplify, then write the result as (0, y).
For the main example, y = 0² − 5(0) + 6 = 6, so the y-intercept is (0, 6). For y = ax² + bx + c, the terms involving x vanish, leaving y = c. Therefore its y-intercept is (0, c).
Do not confuse (0, 6) with (6, 0). The first is on the y-axis; the second is on the x-axis. Nor should you assume that the y-intercept is the turning point: they coincide only when the turn is on the y-axis.
Cover and recall: For y = x² + 2x − 8, what is the y-intercept? Say which variable you set to zero before giving the answer.
5. Turning points and symmetry
The turning point, also called the vertex, is where the parabola changes from decreasing to increasing, or from increasing to decreasing. For a full upward-opening parabola, it is the lowest point. For a full downward-opening parabola, it is the highest point.
On Foundation, practise reading the turning point from a graph: locate the smooth turn, then read its x-coordinate and y-coordinate. If asked for coordinates, x = 2.5 alone is incomplete. The main example has turning point (2.5, −0.25), which is a minimum.
A parabola is symmetric about the vertical line through its turning point. If it has two real roots r₁ and r₂, those roots have the same height, zero, and are equally far from the symmetry line. Thus the turning point's x-coordinate is their midpoint: (r₁ + r₂)/2. This explains why the turn lies horizontally halfway between the two crossings.
Optional symmetry extension: For roots 2 and 3, the midpoint is (2 + 3)/2 = 2.5. Substituting gives y = 2.5² − 5(2.5) + 6 = 6.25 − 12.5 + 6 = −0.25. This checks the vertex without completing the square. Finding a vertex algebraically by completing the square is Higher-only; this guide's core skill remains graph reading. 2
The axis of symmetry is x = 2.5, a vertical line. It is not y = 2.5, and the midpoint does not imply that the turning point lies on the x-axis.
6. Deducing roots algebraically by factorising
For Foundation, focus on equations of the form x² + bx + c = 0 that can be solved by factorising. Pearson's teaching guidance limits Foundation quadratic equation solving to this monic form and this method. 2
To factorise x² + bx + c, find numbers p and q with p + q = b and pq = c. Then write (x + p)(x + q). Expanding explains the rule: the middle terms add to (p + q)x, while the constant is pq.
For x² − 5x + 6 = 0, choose −2 and −3: their product is 6 and their sum is −5. Hence (x − 2)(x − 3) = 0. By the zero-product rule, x − 2 = 0 or x − 3 = 0, giving x = 2 or x = 3. Check both in the original equation: 4 − 10 + 6 = 0 and 9 − 15 + 6 = 0.
For x² + 5x + 6 = 0, the brackets are (x + 2)(x + 3), but the roots are −2 and −3. Solve each bracket equation rather than copying its number. If c is negative, the bracket numbers have opposite signs; their sum still has to match b.
The zero-product rule requires a product equal to zero. From AB = 6, you cannot conclude A = 0 or B = 0. Also, factorising is not the final answer when the command word is solve.
Mathematical/Scientific Relationships
Formula-sheet status: The verified Pearson 2026 Foundation formula sheet does not supply the quadratic relationships below. Treat them as Must memorise, meaning understand and practise them until usable without the sheet. Pearson reports that formula sheets continue for the current specifications; always use the sheet for your own examination series. 3 4
- Must memorise: y = ax² + bx + c, a ≠ 0. Here x is the input, y the output, and a, b, c are coefficients/constants. It identifies a quadratic; a decides the opening direction.
- Must memorise: f(r) = 0 defines a root r. Its x-intercept is (r, 0). This is why setting y = 0 finds roots.
- Must memorise: y-intercept = (0, c) for y = ax² + bx + c. Use x = 0.
- Must memorise: (x + p)(x + q) = x² + (p + q)x + pq. Use p + q = b and pq = c to factorise a monic quadratic.
- Must memorise: AB = 0 implies A = 0 or B = 0. A and B stand for the factors, not necessarily single numbers.
- Must memorise: x² − k² = (x − k)(x + k). This difference-of-squares identity explains roots ±k, for example x² − 4 = 0 gives −2 and 2.
- Must memorise, optional extension: h = (r₁ + r₂)/2 and k = f(h), giving vertex (h, k) when two real roots are known. The axis of symmetry is x = h. Here k denotes the vertex height, not the k in the preceding identity.
Given on formula sheet: None of these Foundation quadratic-topic relationships. The quadratic formula and completing-square methods belong to Higher study and are deliberately not developed here.
Graph/Data Skills
For draw or plot, calculate every requested table entry, using brackets around negative x-values. For y = x² − 4x + 3 and x = −1, calculate (−1)² − 4(−1) + 3 = 1 + 4 + 3 = 8. Remember that (−2)² = 4, whereas −2² means −(2²) = −4.
For x-values −1, 0, 1, 2, 3, 4, 5, the corresponding y-values are 8, 3, 0, −1, 0, 3, 8. Plot small crosses, check paired coordinates, and draw a smooth curve through the points across the specified interval. The matching heights at x = 1 and 3, and at x = 0 and 4, help confirm symmetry about x = 2.
For sketch, show the essential shape and relevant features without pretending to have a precise plotted scale. Include coordinates when requested or useful to make the features unambiguous. Do not assume marks are automatically awarded for labels: credit given depends on the particular question and mark scheme.
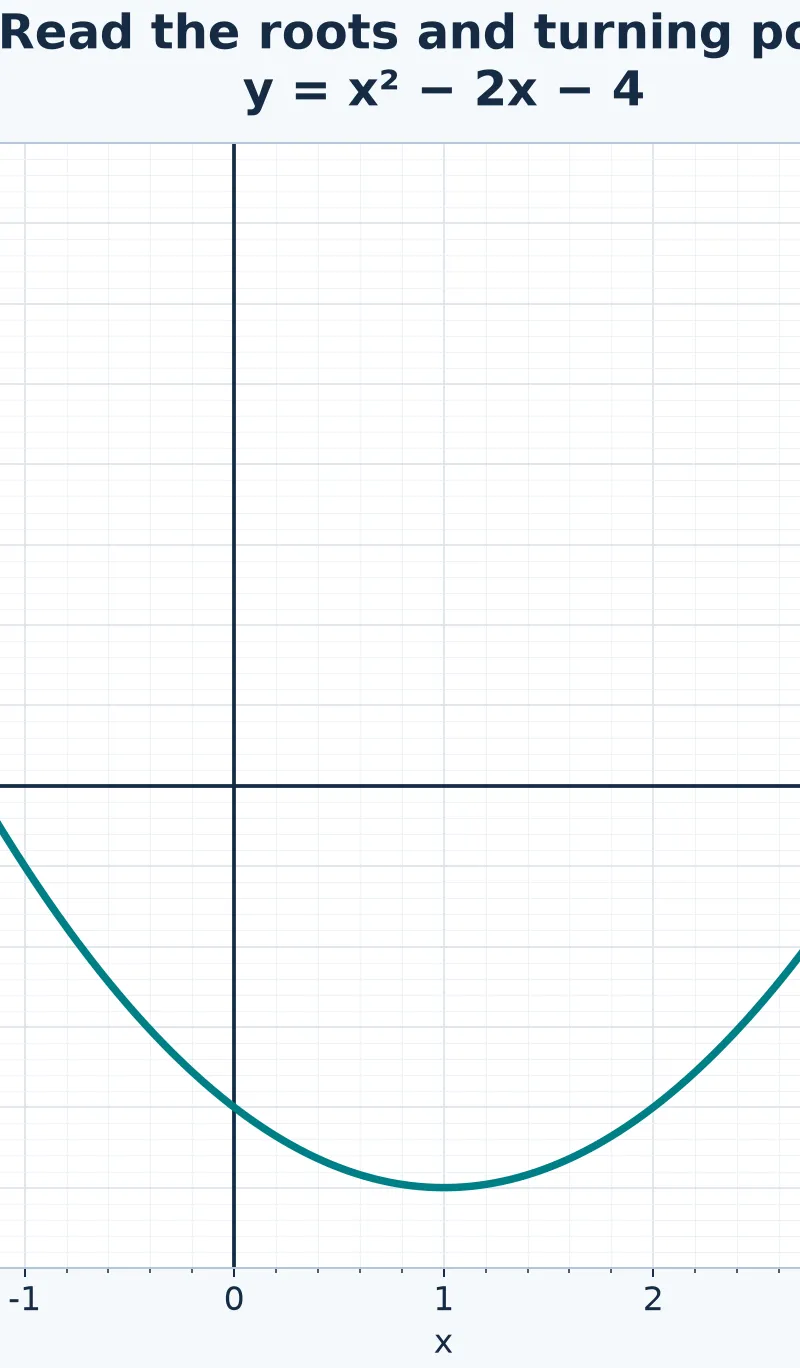
Try before reading the worked solution: Use the graph below to estimate both roots of x² − 2x − 4 = 0 and read its turning point.
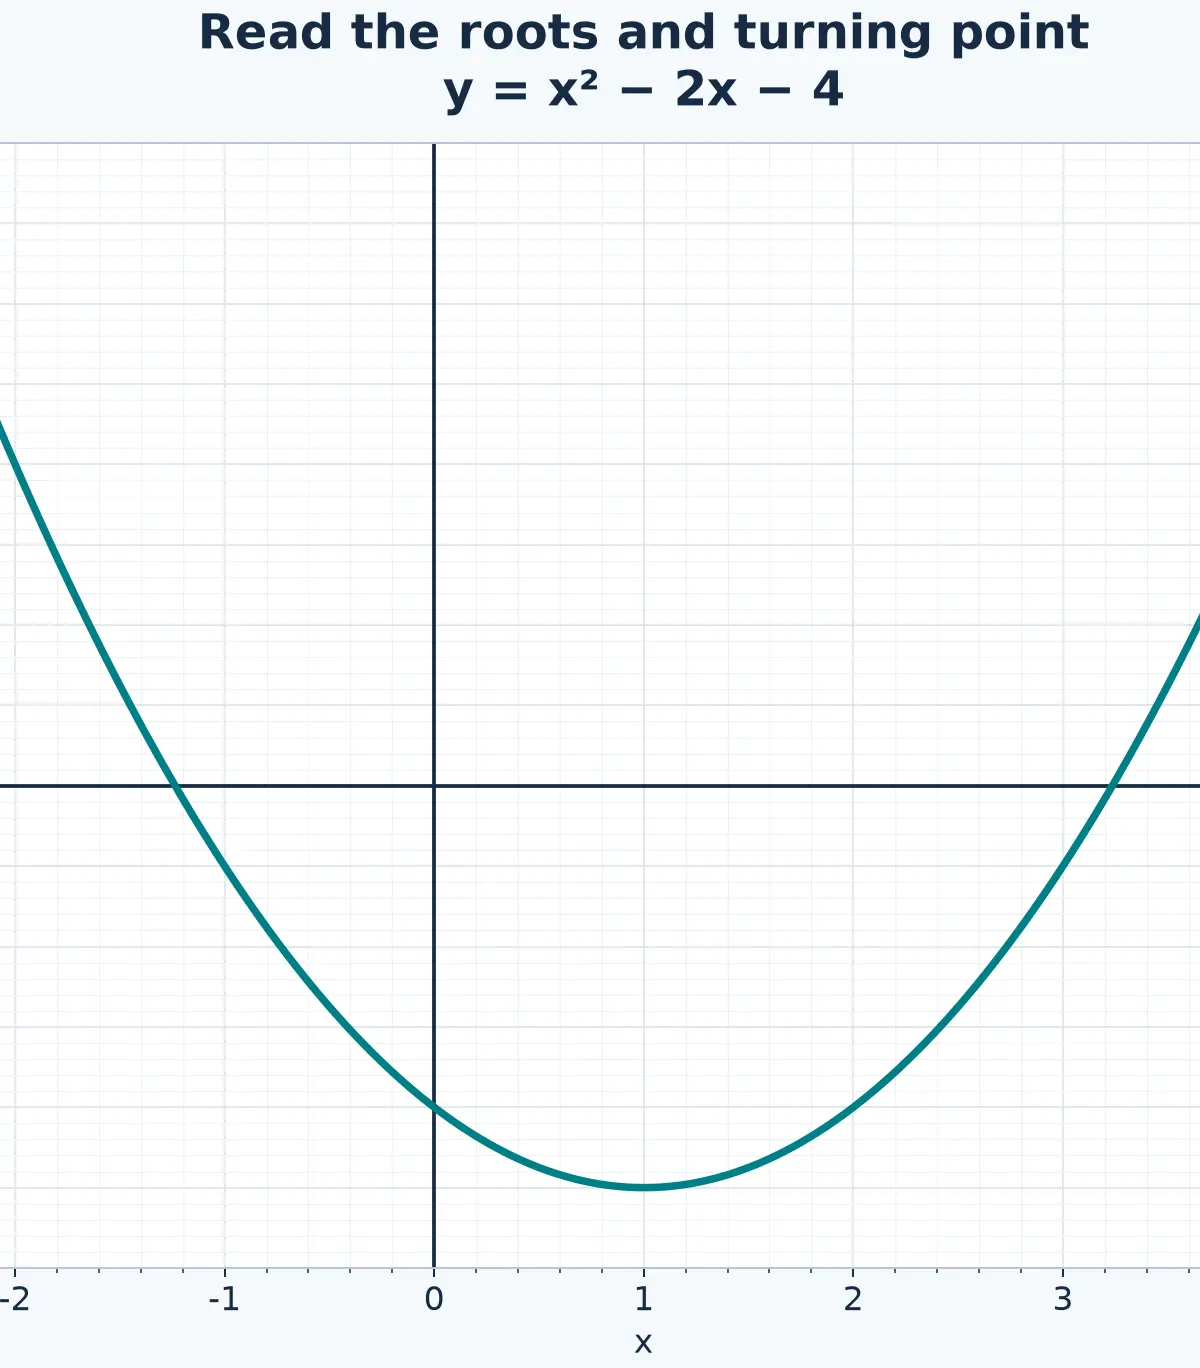
Pearson's teaching guidance gives a corresponding Foundation example with 2 marks for root estimates and 1 mark for turning-point coordinates. This graph is independently redrawn, not a scan of the exam figure. No official acceptance interval is claimed here. 2
Practical Applications
A ball's height against horizontal distance can be modelled by a downward-opening quadratic. Its maximum represents the greatest height; a root can represent where the ball reaches ground level. A negative root may lie outside the physical journey, so mathematical solutions must be interpreted within the stated domain.
Quadratics also arise from rectangular areas, because multiplying two changing lengths produces an x² term. That connects graphs to expanding brackets, not to a new graphing rule. Read the axes before attaching units: a height coordinate might be in metres while the horizontal coordinate is in seconds.
There is no required practical for this GCSE Mathematics topic. Pure algebraic coordinates have no automatic units. In contextual questions, keep units consistent before substitution: 250 cm = 2.5 m and 90 s = 1.5 min. Do not apply those conversions unless the question actually needs them.
Ten-minute Tutor Podcast
Listen with a pencil and answer the quiz aloud. The episode follows introduction, core concepts, exam tips, quick-fire recall, and summary. Afterwards, solve one different quadratic without replaying the explanation. Revisit missed rules tomorrow, then try again after several days.
References
Visual Resources
3 diagrams and illustrations
Interactive Diagrams
2 interactive diagrams to visualise key concepts
Conceptual Flow Outline
The algebraic root-finding workflow for factorisable Foundation quadratics.
Conceptual Flow Outline
Distinguishing roots, intercepts and turning points so the answer matches the command word.
Worked Examples
5 worked examples — open one to explore the question and available guidance.
Practice Questions
Try the question, then reveal an answer plan or example response
The graph of y = x² − 4 has x-intercepts at (−2, 0) and (2, 0), and a y-intercept at (0, −4). State the roots and explain in one sentence the distinction between roots and intercept coordinates.
Hint: At an x-intercept, y = 0. Roots are values of x, not coordinate pairs.
Use {{asset:quadratic_root_cases.png}}. Describe what each graph tells you about the number of real roots: y = x² − 4, y = x² and y = x² + 2. For y = x², state its root.
Hint: Count how many times each curve meets or touches the x-axis. A root has y = 0.
Solve x² + 7x + 12 = 0 by factorising. Write your answers as equations in x.
Hint: Find two positive numbers with product 12 and sum 7.
For y = x² − 5x + 6, find the roots algebraically and check both. Then state the x-intercept coordinates and the y-intercept.
Hint: Which two numbers multiply to +6 and add to −5? For the y-intercept, use x = 0.
Solve x² + 5x + 6 = 0 by factorising. Give the roots and the matching x-intercept coordinates.
Hint: Both factors have plus signs, but solving x + number = 0 gives a negative answer.
A quadratic graph y = −x² + 4 opens downwards, crosses the x-axis at x = −2 and x = 2, and crosses the y-axis at y = 4. State the roots, both x-intercept coordinates and the y-intercept. Explain whether the turning point is a maximum or a minimum.
Hint: The negative coefficient of x² makes the parabola open downwards.
Solve x² − x − 6 = 0 by factorising. Explain how you chose the signs in your factors.
Hint: The constant is negative, so the two numbers have opposite signs. Their sum must be −1.
A sketch of y = x² − 4x + 3 has roots x = 1 and x = 3 and opens upwards. Without calculating a vertex from the equation, explain where you would expect the turning point to lie horizontally and whether it is a maximum or minimum. Then find the y-intercept.
Hint: Use symmetry: the turning point lies halfway between equal-height points such as the roots. Find a y-intercept by setting x = 0.
For y = x² − 4x + 3, calculate y for x = −1, 0, 1, 2, 3, 4, 5. Draw the graph on squared paper over this interval and use it to state the roots and turning-point coordinates.
Hint: Use brackets around negative inputs and check equal heights either side of x = 2.
Exam technique
How to turn what you know into marks
How to approach the question
Read the command word and identify whether the question wants x-values, coordinate pairs, a reason, or a graph. For roots from a graph use y = 0; for a y-intercept use x = 0. For algebraic roots of a suitable monic quadratic, form the zero equation, factorise, solve both brackets and check. If asked to use a graph, use the graph rather than replacing the requested method with an unrelated calculation.
How to structure your answer
For 1 mark, give the precise requested value or pair. For a 2-mark root-reading task, give both x-values with sensible accuracy. For a typical original 3-mark solving task, show the factorisation, the zero-product step and both roots. In 4–6-mark multipart tasks, answer every part separately and show substitutions or plotting calculations. These are practice structures; real allocations depend on the specific Pearson mark scheme.
Timing
Each Pearson Edexcel GCSE Mathematics paper has 80 marks and lasts 90 minutes: about 1.125 minutes, or 68 seconds, per mark. Aim for about 3–3.5 minutes on a 3-mark question and 6–7 minutes on a 6-mark question, allowing checking time. This is a pacing guide, not a fixed limit for each question.
Common pitfalls
- Copying numbers from (x + 2)(x + 3): solve each bracket to obtain roots −2 and −3.
- Giving only one root: inspect both crossings or solve both factors.
- Confusing the axes: x-intercepts have y = 0; y-intercepts have x = 0.
- Giving only the x-coordinate of a turning point: give (x, y) when coordinates are requested.
- Drawing a sharp V or straight segments: a quadratic is one smooth parabola.
- Using the zero-product rule when the product is not zero: first use an equation equal to zero.
- Assuming every label earns a mark: follow the precise task; explain or calculate when required.
- Reporting too many decimal places from a graph: accuracy is limited by the printed scale.
What the command words want
- Solve
- Find all values that make the equation true. Factorisation alone is not a finished solution.
- Sketch
- Show the correct general shape and relevant features, labelled where requested or helpful.
- Compare
- Identify relevant similarities and differences, such as same roots but opposite opening directions after reflection.
- Explain
- Give a mathematical reason, for example roots have y = 0 because their points lie on the x-axis.
- Describe
- Identify relevant shape or behaviour with terms such as upward-opening, minimum, crossing or touching.
- Estimate
- Give a sensible approximate reading consistent with the graph scale or stated accuracy.
- Evaluate
- In Mathematics, evaluating an expression means substituting and calculating its numerical value. It does not mean a generic for-and-against essay.
- Calculate
- Show the substitution and arithmetic. Give units only when the variables have contextual units.
- Draw/Plot
- Use the given grid and scale, plot calculated points accurately and join with a smooth curve.
- Factorise
- Rewrite as a product of factors, for example (x − 2)(x − 3).
- Show that
- Present a convincing chain of working that reaches the supplied result; do not simply repeat it.
- State/Give
- Give the requested x-values or coordinate pairs clearly; a short mathematical answer may be enough.
- Write down
- Read the requested information directly from the graph or supplied data.
Watch or listen (optional)
Test your understanding of Algebra - Graphs: identify and interpret roots, intercepts, turning points of quadratic functions graphically; deduce roots algebraically (Foundation tier)
Active recall beats re-reading. Take an instant quiz now to test what you’ve learned and lock it into long-term memory.
7 days Premium · Then the free plan continues · No card, no charge