Pearson Edexcel · GCSE · Mathematics
Course version: 1MA1 · Version from Mar 2026
Probability: apply ideas of randomness, fairness and equally likely events to calculate expected outcomes of multiple future experiments
Random results can still produce useful predictions. Learn to calculate expected frequencies, distinguish fairness from equal likelihood and explain uncertainty with the precise language that earns GCSE Mathematics marks.
- 14 min read
- 3 worked examples
- 7 practice questions
- 11 key terms
Try the lesson
The start of the Probability: apply ideas of randomness, fairness and equally likely events to calculate expected outcomes of multiple future experiments lesson, made from checked teaching notes for this specification point.
Have a go first
A fair six-sided dice is rolled 60 times. How many times would you expect it to land on a 4?
There is more to this lesson
The full lesson goes on to check your understanding and help you earn the marks. Create a free account to carry on, with your progress saved.
7 days Premium · Then the free plan continues · No card, no charge
Check what you remember
Read the wording for your board, then hide it and explain Random outcome in your own words. Rough notes are fine. This is a self-check, with no mark or grade.
Reference: Pearson Edexcel
An outcome that is uncertain before the trial, even though its probability may be known.
Study Notes
Overview
A fair coin is unpredictable on its next toss, yet its results become useful when you consider many tosses. This topic explains how candidates move from the probability of one event to an expected number of occurrences across repeated experiments. It also separates four ideas that exam questions often place together: randomness, equally likely outcomes, fairness and bias.
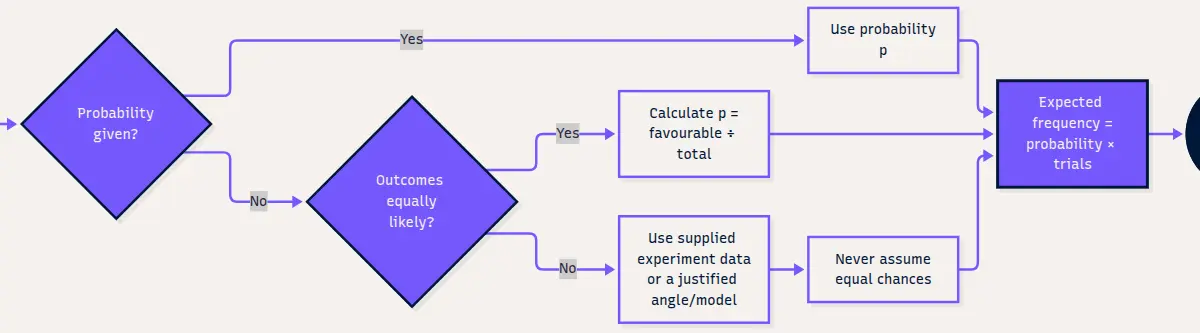
The central calculation is expected frequency = probability × number of trials. If a spinner has probability 0.2 of landing on red, 50 spins give an expected frequency of 10 reds. That is a prediction based on an average, not a promise that exactly 10 reds will occur.
This matters because apparently simple questions assess both numerical accuracy and interpretation. Candidates may need to find a probability from a fair die, sector angles, a frequency table or experimental results before making a prediction. Other questions ask whether a game is fair or why actual results differ from expected results. These skills connect directly to fractions, percentages, ratio, angles, statistical sampling and algebra. Read the event carefully, justify your probability model and show the multiplication: those are the foundations of a mark-worthy answer.
Specification and assessment scope
Pearson Edexcel GCSE (9–1) Mathematics, qualification 1MA1, Section 5 Probability, P2: “apply ideas of randomness, fairness and equally likely events to calculate expected outcomes of multiple future experiments”. Supporting links are P1 for recording experimental frequencies, P3 for relating relative expected frequencies to theoretical probability, P5 for larger unbiased samples and P7 for theoretical possibility spaces. This core topic applies to both Foundation and Higher. The additional P9 work on conditional probabilities using expected-frequency representations is Higher-only and is not needed for the calculations taught here. 1
All worked examples and practice questions below are original Edexcel-style questions, not reproduced past-paper questions. Their stated marks and detailed allocations are illustrative teaching schemes. Actual Pearson mark schemes are question-specific. A method mark, usually labelled M, rewards the required method; an accuracy mark, usually labelled A, rewards the correct result after that method. A B mark typically rewards an independent fact, statement or result. Do not assume that every question awards a separate mark for writing the formula.
Key Concepts
Concept 1: Random does not mean equally likely
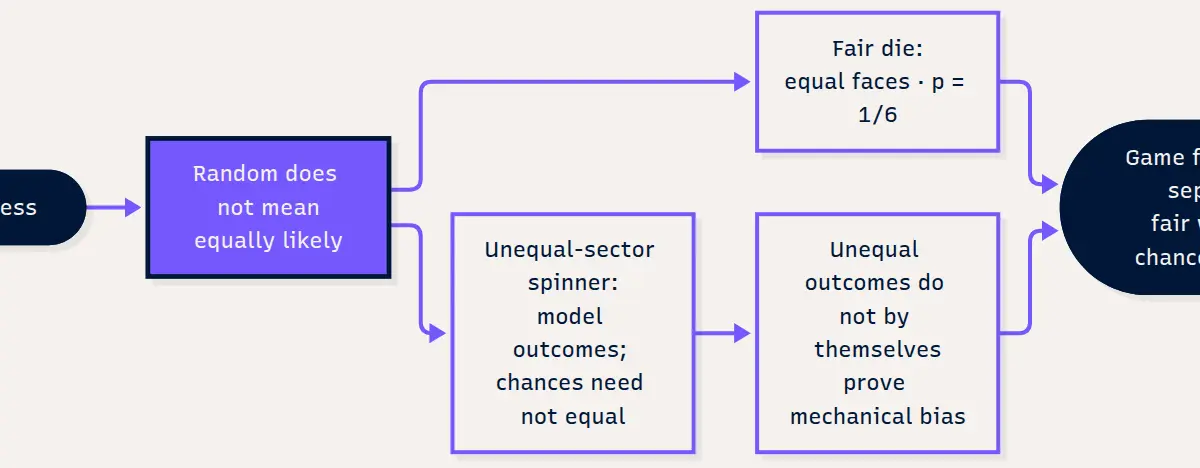
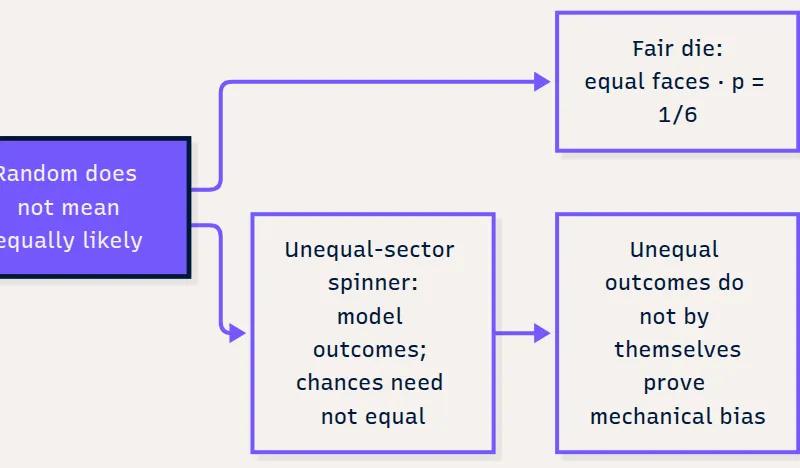
A random outcome is uncertain before the trial. Equally likely outcomes each have the same probability. Those statements are different. A spinner with half its area purple and one quarter each green and gold can produce unpredictable results while purple remains more likely than either other colour.
For a fair six-sided die, each face has probability 1/6. The event “a number greater than 4” includes two outcomes, 5 and 6, so its probability is 2/6 = 1/3. Count the favourable outcomes, not the words in the event description. “Odd” means 1, 3 or 5; “at least 4” means 4, 5 or 6; “greater than 4” excludes 4.
Cover and recall: Without looking back, explain why a random spinner need not give every colour the same chance. A successful answer mentions unpredictability and different probabilities.
Concept 2: Fairness depends on the question
A fair die has equally likely faces. A fair two-player game usually gives the players equal winning chances when other conditions, such as stakes and rewards, are equal. Read the rules before deciding: a fair randomising device does not automatically make a fair game.
Suppose player A wins on 1 or 2 and player B wins on 3, 4, 5 or 6 on a fair die. Their probabilities are 1/3 and 2/3, so the game is not fair on equal terms. Conversely, on the unequal-sector spinner above, one player could win on purple while another wins on either green or gold. Both winning events have probability 1/2. The colours are not equally likely individually, but the game is fair on equal terms.
Bias concerns departure from the relevant fair or intended model. An unequal-sector spinner is not automatically mechanically biased: unequal colour probabilities may be deliberately built into its design. Credit is given for a comparison of winning probabilities, not an unsupported statement such as “it looks unfair”.
Concept 3: Expected frequency scales up a probability
Let p be the probability of the specified event on a trial, and n the number of trials. The expected frequency is E = np. Think of p as the expected proportion and n as the size of the experiment. Taking a proportion of a total means multiplying.
Example: A machine produces an item with a defect probability of 0.03. Among 200 items, the expected number of defective items is 0.03 × 200 = 6. Write “6 defective items”, not “a probability of 6”. Probabilities lie between 0 and 1; expected counts can be much larger than 1.
For a non-calculator example, 1/6 × 90 = 90 ÷ 6 = 15. Do not divide 90 by 1/6: that gives 540 and cannot represent occurrences among only 90 trials. A quick check is 0 ≤ E ≤ n.
Concept 4: An expected count need not be a whole number
A red sector covering one quarter of a spinner gives E = 1/4 × 30 = 7.5 red results in 30 spins. No individual experiment can contain half a red result, but the expected frequency describes an average across repetitions of the whole experiment.
Imagine many groups each completing 30 spins. Some groups record 6 reds, others 8, and others different numbers. Their average count can be 7.5. Therefore, do not round an expected frequency simply because an observed count must be an integer. Keep the exact value unless the question requests rounding or a particular practical interpretation.
Why does this work? The expectation refers to the average count, whereas the observation refers to the actual count in one run. They answer different questions. “Expected” does not mean “certain” or “most likely in every situation”.
Concept 5: Experimental results can supply an estimate
Sometimes the theoretical probability is unknown. Estimate it using relative frequency:
[\hat p = \frac{\text{observed event frequency}}{\text{number of observed trials}}.]
If a spinner lands on red 42 times in 120 spins, the estimated probability is 42/120 = 0.35. For 400 future spins, the estimated expected number of reds is 0.35 × 400 = 140. Use the old trial total to estimate the probability, then the new trial total for the prediction. Mixing those totals is a common error.
State the assumption when asked: the future spins should be made under comparable conditions, with the same spinner and method. This is an estimate, not an exact theoretical probability. A larger, representative set of trials generally makes a random-error estimate more reliable; repeating a systematically flawed method does not remove its bias.
Concept 6: Actual results fluctuate, even with a fair device
A fair coin need not produce exactly 50 heads in 100 tosses. Chance variation is expected. As trial numbers grow, the observed proportion tends towards the model probability in the long run, but it does not have to get closer after every additional trial.
Be careful with the scale of a difference. A difference between actual and expected counts alone is not enough to prove bias. Consider the number of trials, the size of the discrepancy and the experimental method. At GCSE level, a sensible response might be: “The results suggest possible bias because the observed proportion differs substantially from the expected proportion, but chance variation is possible and more trials would help.” Formal significance testing is not required here.
Nor do earlier results make a fair coin “due” for tails. With independent tosses, the next-toss probability remains 1/2. An expected frequency is not a quota that the experiment must eventually fulfil.
Mathematical/Scientific Relationships
The following relationships are Must memorise for this topic. The verified 2026 Foundation and Higher exam aids do not print the expected-frequency relationship. A formula insert is provided for both tiers, but it is not a substitute for learning these relationships. Pearson's April 2026 update reports continuation of formula sheets for the current specifications through 2030 or 2031; check the aid for your examination series. 2 3 4
Expected frequency: E = np, where E is the expected count, p the event probability and n the trial count. Use it when each trial has the same event probability. Independent trials are the usual school model, but independence is not a necessary condition for this expected-count formula if the individual event probabilities remain the same.
Equally likely model: P(A) = favourable outcomes / total possible outcomes. Use this counting rule only when the elementary outcomes being counted are equally likely.
Sector model: P(colour) = total angle for that colour / 360°. This requires a spinner model in which direction is equally likely, with no mechanical preference. Add all sectors of the same colour before dividing. For example, two red sectors measuring 45° each together give 90/360 = 1/4.
Relative frequency estimate: estimated P(A) = observed frequency of A / observed trial total. Then estimated future frequency = estimated P(A) × future trial total. Keep full calculator precision until the final answer.
Complement: P(not A) = 1 − P(A), so expected non-A count = n[1 − P(A)] = n − E. Complementary expected counts sum to n because every trial belongs to exactly one of the two events.
Rearrangements: p = E/n and n = E/p, with p > 0 for the second relationship. These are algebraic rearrangements, not a change to the basic rule. If p = 0, the expected event count is 0 for any trial total, so E cannot identify a unique n.
Synoptic extension: for independent events A and B, P(A and B) = P(A)P(B). Find the probability of the combined event first, then multiply by the number of complete repeated experiments. This extension remains GCSE material; the expected-frequency step itself is not Higher-only.
Units, fractions and percentages
Probability has no physical unit. Expected frequency is a count, labelled with the relevant item or event. Convert 20% to 0.20 before multiplying by n, or calculate 20/100 × n. Multiplying by 20 instead gives an answer one hundred times too large. Ratios also need conversion: red:blue = 2:3 means P(red) = 2/(2 + 3) = 2/5, not 2/3, under a model matching those proportions. Spinner angles use degrees and a full turn is 360°. No conversions between length, area or volume units are needed for this topic.
Graph and Data Skills
For a frequency table, identify the frequency of the named event and add all frequencies to obtain the trial total. If the event spans categories, combine their frequencies first. For a bar chart, read the scale carefully: one grid interval may represent 5 or 10 results rather than 1. Raw count and relative frequency are different axes, so check the label.
To draw a relative-frequency graph, put number of trials on the horizontal axis and cumulative relative frequency on the vertical axis, with a suitable scale between 0 and 1. Plot each calculated proportion accurately. A horizontal reference at the theoretical probability helps comparison. Expect fluctuations, not a perfectly straight line or guaranteed step-by-step convergence. Compare estimates on a common probability scale rather than assuming the experiment with the largest raw count has the greatest probability.
Practical Applications
Expected frequencies help a factory estimate faulty products, a shop plan the number of deliveries likely to be delayed, or a game designer check the balance of winning chances. These are planning averages, so sensible planning also allows for variation. Predicting 6 defective items does not certify that precisely 194 of 200 items will be satisfactory.
There is no required practical in GCSE Mathematics for this topic. A useful learning activity is to toss a coin or spin a spinner repeatedly. Use the same equipment, record each result immediately and keep a clear tally. Compare predictions with observed counts, then compare observed proportions after larger numbers of trials. Avoid selective recording, changing the spinning method or stopping only when a preferred outcome appears. Examiners can test the interpretation of supplied experimental data without requiring a science-style apparatus write-up.
Exam Technique and Active Learning
Each Edexcel GCSE Mathematics paper lasts 90 minutes and carries 80 marks. Paper 1 is non-calculator; Papers 2 and 3 allow calculators. The overall average is 90/80 = 1.125 minutes per mark, about 1 minute 8 seconds. Treat that as a planning guide, not a prescribed time for every question. Aim to finish straightforward calculations efficiently so you retain checking time. 1
An authentic marking example is November 2022, Higher Paper 1, Question 5, 2 marks. In a survey, 15 of 80 people selected model B. For a production total of 40,000 cars, Pearson awards M1 for (15/80) × 40,000, or an equivalent method, and A1 cao for 7,500. “cao” means correct answer only. This demonstrates proportion × future total on that specific question; it does not establish a universal allocation for every expected-frequency question. 5 6
Use the memory hook PNT: Probability, Number, Times. Identify the event, find its probability, write the number of future trials and multiply. When the command word is “Explain”, add a reason tied to the context: “The actual number may differ because each outcome is random.” When it is “Work out” or “Calculate”, show the numerical method rather than replacing working with a sentence.
Practise retrieval rather than rereading: cover the formula, reproduce it and explain what each symbol means. Then attempt one theoretical-probability question and one experimental-estimate question without notes. Check your work afterwards. On a later day, retry the questions you got wrong, including the explanation parts. A useful self-test is whether you can explain why dividing by p is wrong when calculating E, yet correct when rearranging for n.
Listen, Pause and Recall
The ten-minute female-tutor podcast moves from definitions to calculations, then exam technique, a short recall quiz and a summary. Try to answer the quiz before hearing the explanations. Afterwards, write the formula and one fairness comparison from memory.
Sources
Visual Resources
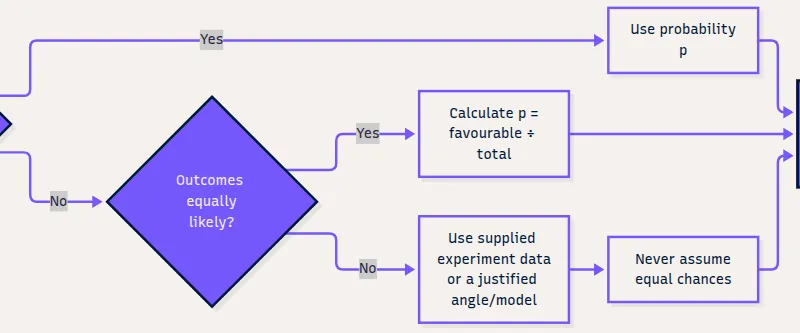
2 diagrams and illustrations
Interactive Diagrams
2 interactive diagrams to visualise key concepts
Worked Examples
3 worked examples — open one to explore the question and available guidance.
Practice Questions
Try the question, then reveal an answer plan or example response
A fair coin is tossed 80 times. Work out the expected number of heads. Explain why the actual number need not equal this value. (3 marks)
Hint: Use the probability of heads on one toss, then distinguish average from actual count.
A bag contains 6 red counters and 14 blue counters. A counter is chosen at random, recorded and replaced before the bag is mixed again. The process is repeated 150 times. Work out the expected number of red selections. (3 marks)
Hint: Find the total number of counters. Replacement keeps the red probability unchanged.
A red sector has angle 72° on a spinner whose pointer is equally likely to stop in any direction. The spinner is spun 75 times. Work out the expected number of red results. (3 marks)
Hint: Compare 72° with a complete turn of 360°.
A bus arrived late on 18 of 60 observed journeys. Use these data to estimate the number of late arrivals in 250 future journeys. State one assumption. (4 marks)
Hint: Estimate the probability using the observed journeys before predicting future journeys.
A spinner has a blue half and two other colours occupying a quarter each. Its pointer is equally likely to stop in any direction. On equal terms, player A wins on blue and player B wins on either other colour. (a) Explain whether the game is fair. (2 marks) (b) For 40 games, calculate the expected number of wins for player A. (2 marks)
Hint: Compare each player's complete winning event, not each individual colour.
An event has an expected frequency of 45 in 180 trials. Assume its probability stays the same. (a) Work out the probability of the event. (2 marks) (b) Work out how many trials would give an expected frequency of 60. (2 marks)
Hint: Rearrange E = np, first for p and then for n.
Synoptic extension: A fair die is rolled twice in each complete experiment. The rolls are independent. There are 180 complete experiments. Work out the expected number of experiments in which both rolls show 6. (3 marks)
Hint: Find the probability of two sixes first. The trial count is the number of complete experiments.
Exam technique
How to turn what you know into marks
How to approach the question
Underline the event and the future number of trials. Decide whether the probability is supplied, theoretically justified by equally likely outcomes or angles, or estimated from observed data. Write that probability, multiply by the future trial total and check 0 ≤ expected count ≤ trials. If explanation is requested, distinguish a prediction from a guarantee.
How to structure your answer
For a short calculation, show probability × trial count = expected frequency. In multi-part questions, label parts and retain intermediate probabilities for later use. For an explanation, make a contextual claim and justify it using 'because'. For fairness, calculate each player's winning probability and compare them under the stated rules. The 3-, 5- and 6-mark examples here have illustrative subpart allocations, not a universal Pearson template.
Timing
Each paper has 80 marks in 90 minutes, giving an overall average of 1.125 minutes per mark, about 1 minute 8 seconds. As a rough planning guide, allow 3–4 minutes for 3 marks and 6–7 minutes for 6 marks, while completing simple calculations more quickly and keeping checking time. This is not a Pearson-prescribed time per question.
Common pitfalls
- Dividing trials by probability when finding expected frequency: multiply instead. Division by probability is appropriate only when rearranging to find the trial total.
- Assuming one over the number of colours gives a spinner probability: check sector angles and the spinner model.
- Treating an expected count as a probability: probabilities are between 0 and 1; counts use context labels such as red results.
- Rounding 7.5 expected outcomes to 8 without instruction: an average may be non-integer.
- Using the future total to calculate the original relative frequency: estimate from the original experimental total first.
- Calling an unequal-sector spinner mechanically biased without evidence: intended unequal probabilities and unintended preference are different.
- Saying a discrepancy proves bias or a coin is due for tails: acknowledge chance variation and, for independent tosses, unchanged next-toss probability.
- Entering 20 rather than 0.20 for a 20% probability: divide a percentage by 100 before using it as p.
What the command words want
- Compare
- Compare the relevant probabilities or proportions explicitly, not raw counts from unequal trial totals.
- Explain
- Give a contextual reason, not just a repeated assertion: 'The count may differ because individual outcomes are random.'
- Describe
- Identify the relevant pattern or property using precise vocabulary, such as fluctuations in relative frequency.
- Evaluate
- If a question requests a judgement, use the supplied evidence and state limitations. This is not a routine command for this short probability calculation topic.
- State/Give
- Provide the requested probability, assumption or fact directly. Use a complete short sentence if the answer is conceptual.
- Write down
- Give the requested result directly. Do not add unnecessary calculations, but ensure the event has been read correctly.
- Work out/Calculate
- Show the probability and the multiplication by the trial count. Label the final expected count with its context.
Watch or listen (optional)
Test your understanding of Probability: apply ideas of randomness, fairness and equally likely events to calculate expected outcomes of multiple future experiments
Active recall beats re-reading. Take an instant quiz now to test what you’ve learned and lock it into long-term memory.
7 days Premium · Then the free plan continues · No card, no charge