Pearson Edexcel · GCSE · Mathematics
Course version: 1MA1 · Version from Mar 2026
Probability: enumerate sets and combinations of sets systematically, using tables, grids, Venn diagrams and tree diagrams
Probability is not about guessing: it is about organising every possible outcome. Master systematic lists, grids, Venn diagrams and trees so you can show complete reasoning, avoid double counting and turn the right outcomes into exam marks.
- 13 min read
- 4 worked examples
- 6 practice questions
- 15 key terms
Try the lesson
The start of the Probability: enumerate sets and combinations of sets systematically, using tables, grids, Venn diagrams and tree diagrams lesson, made from checked teaching notes for this specification point.
Have a go first
A menu has 3 choices of starter and 4 choices of main course. Using a systematic list or grid, how many different combinations of one starter and one main course are possible?
There is more to this lesson
The full lesson goes on to check your understanding and help you earn the marks. Create a free account to carry on, with your progress saved.
7 days Premium · Then the free plan continues · No card, no charge
Check what you remember
Read the wording for your board, then hide it and explain Enumerate in your own words. Rough notes are fine. This is a self-check, with no mark or grade.
Reference: Pearson Edexcel
List every allowed outcome exactly once.
Study Notes

Overview
Probability questions become manageable when every possibility has a clear place. This topic teaches you to enumerate, meaning list completely, the outcomes of choices or events without missing or repeating any. You will use systematic lists, sample-space grids, two-way tables, Venn diagrams and tree diagrams. These are different tools for organising information, not different rules of probability.
In an examination, candidates may be asked to list all possible codes, complete a table of dice outcomes, sort people into overlapping sets, or draw branches for successive events. A correct diagram makes your reasoning visible and provides a reliable starting point for calculating probabilities. The key question is always: have I represented every allowed outcome exactly once?
This work connects to fractions, percentages, counting, algebra and interpreting data. It also prepares you for combined-event and conditional probability questions. Your aim is not merely to remember a picture, but to select the right representation and explain why it is complete. Read the restrictions first, organise the information, and check the total before calculating. That routine prevents many avoidable errors under time pressure.
Specification and tier: Pearson Edexcel GCSE Mathematics 1MA1, primarily probability statement P6, with applications to P7 and P8. The core enumeration skills in this guide are relevant to both Foundation and Higher. P9 conditional probability is Higher-only. 1
Marking note: All worked and practice questions here are original Edexcel-style teaching questions. Their exact allocations are illustrative rubrics, not reproduced Pearson mark schemes. Official marks awarded depend on the published scheme for the particular question.
Key Concepts
Concept 1: A complete, systematic list
An outcome is one possible result. A sample space is the set of all possible outcomes. An event is a selection of outcomes meeting a condition. For a die, the sample space is {1, 2, 3, 4, 5, 6}; the event 'even' is {2, 4, 6}.
To list two choices systematically, hold the first choice fixed while the second cycles through every allowed value. Then change the first choice and repeat. With tops R and B and trousers K, G and W, write RK, RG, RW, BK, BG, BW. The visible pattern helps candidates check completeness.
Why this works: each block exhausts the possibilities associated with one first choice. Different blocks have different first choices, so they cannot duplicate one another. There are 2 × 3 = 6 outfits when every pairing is allowed.
Restrictions change the list. For two-digit codes using 1, 2 and 3 without repetition, the complete list is 12, 13, 21, 23, 31, 32. There are 3 first choices and 2 remaining second choices. Do not include 11, 22 or 33.
Check whether order matters. The code 12 differs from 21 because the positions have different roles. A team consisting of two named students is normally unchanged when their names are reversed. For an unordered team from A, B and C, list AB, AC and BC, not six ordered pairs. You do not need a factorial formula for these small enumeration tasks.
Cover and recall: hide the code list. Rebuild it, then explain why it contains six rather than nine outcomes.
Concept 2: Sample-space grids preserve the pairs
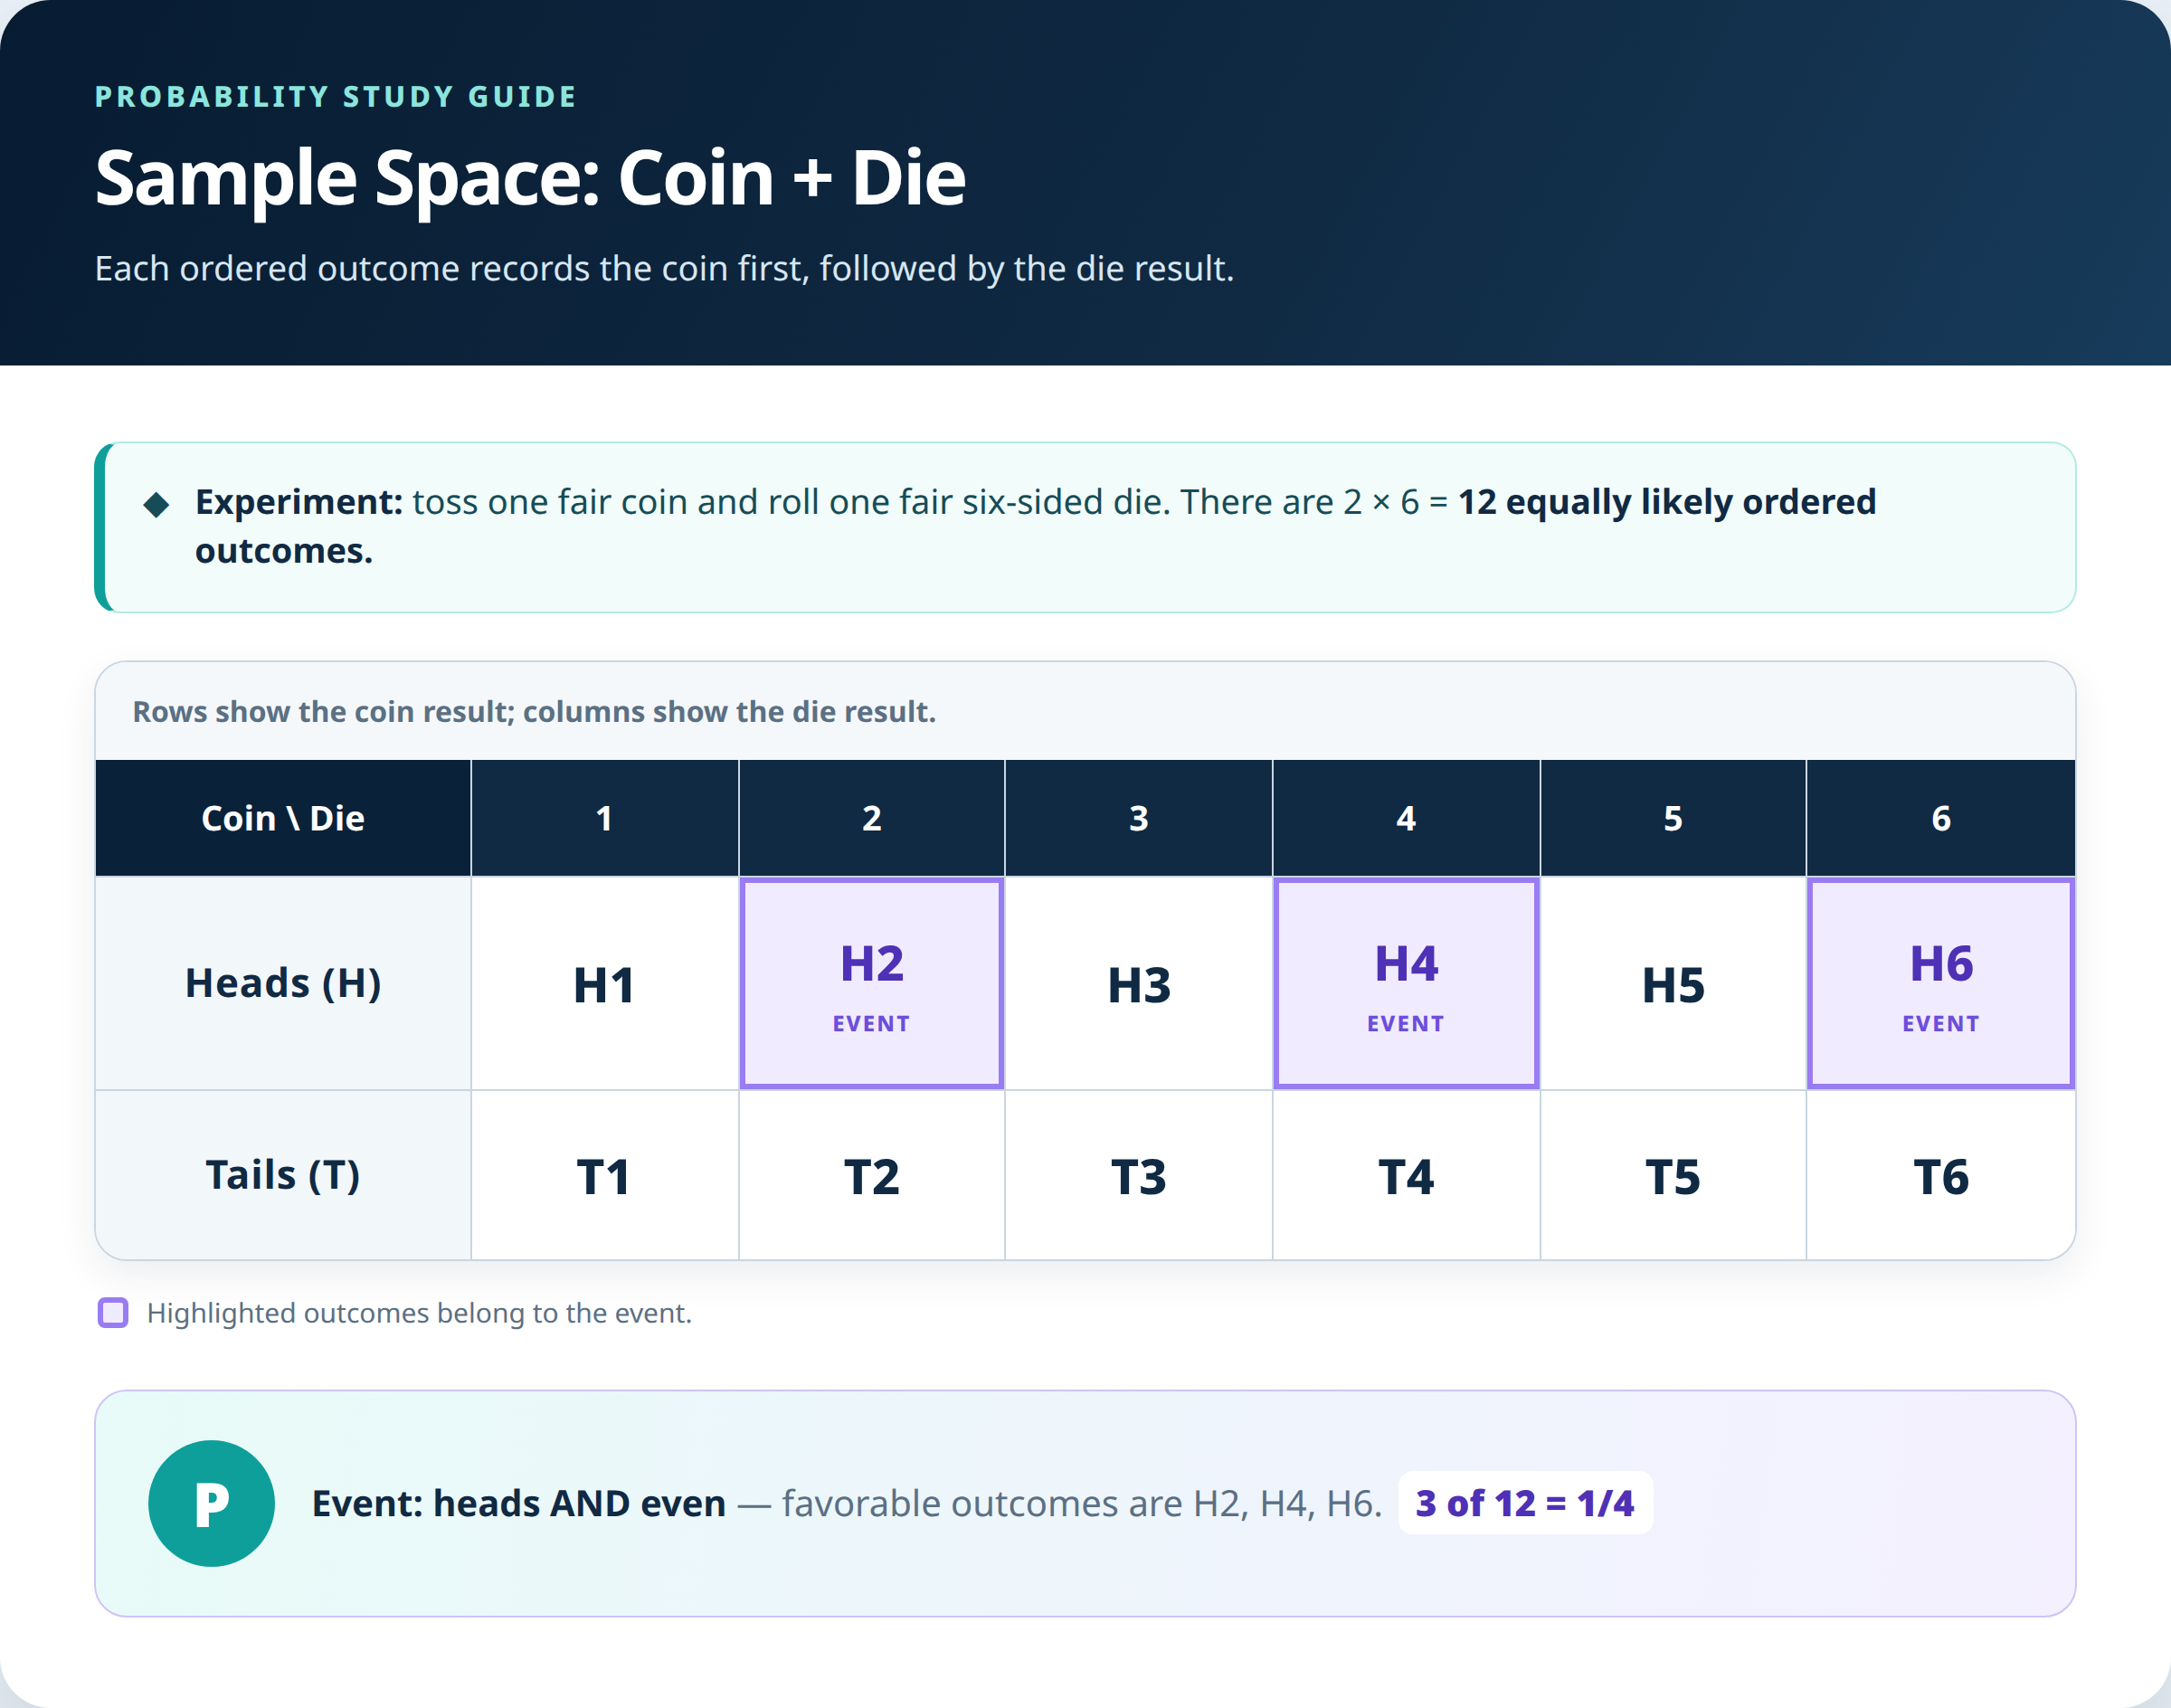
Use a sample-space grid when one outcome from each of two choices is combined. Label the rows with one choice and the columns with the other. Every cell records the outcome determined by its row and column. A coin and a six-sided die produce a 2-by-6 grid.

The twelve outcomes are H1 through H6 and T1 through T6. 'Heads and an even number' selects H2, H4 and H6. For a fair coin and fair die acting independently, all twelve pairs are equally likely, so P(heads and even) = 3/12 = 1/4.
An outcome grid may contain pairs, sums or products according to the question. State what each cell represents. For two distinguishable fair dice, there are 36 ordered pairs. If the cells show sums, several cells contain 7, but only one contains 2. The sums are not equally likely merely because the pairs are.
Examiner focus: candidates who list the eleven totals 2 to 12 and use 11 as the denominator have not represented the equally likely outcomes. The correct denominator is 36. A total of 7 has six successful cells, giving 6/36 = 1/6.
What if? If the coin is biased, the grid still lists possible pairs, but counting successful cells is no longer sufficient unless the pairs have equal probabilities.
Concept 3: Two-way frequency tables count a population
A two-way frequency table classifies people or objects by two properties. Unlike an outcome grid, each cell contains a frequency, not a single trial outcome. Totals at the ends of rows and columns are sums of the relevant cells.
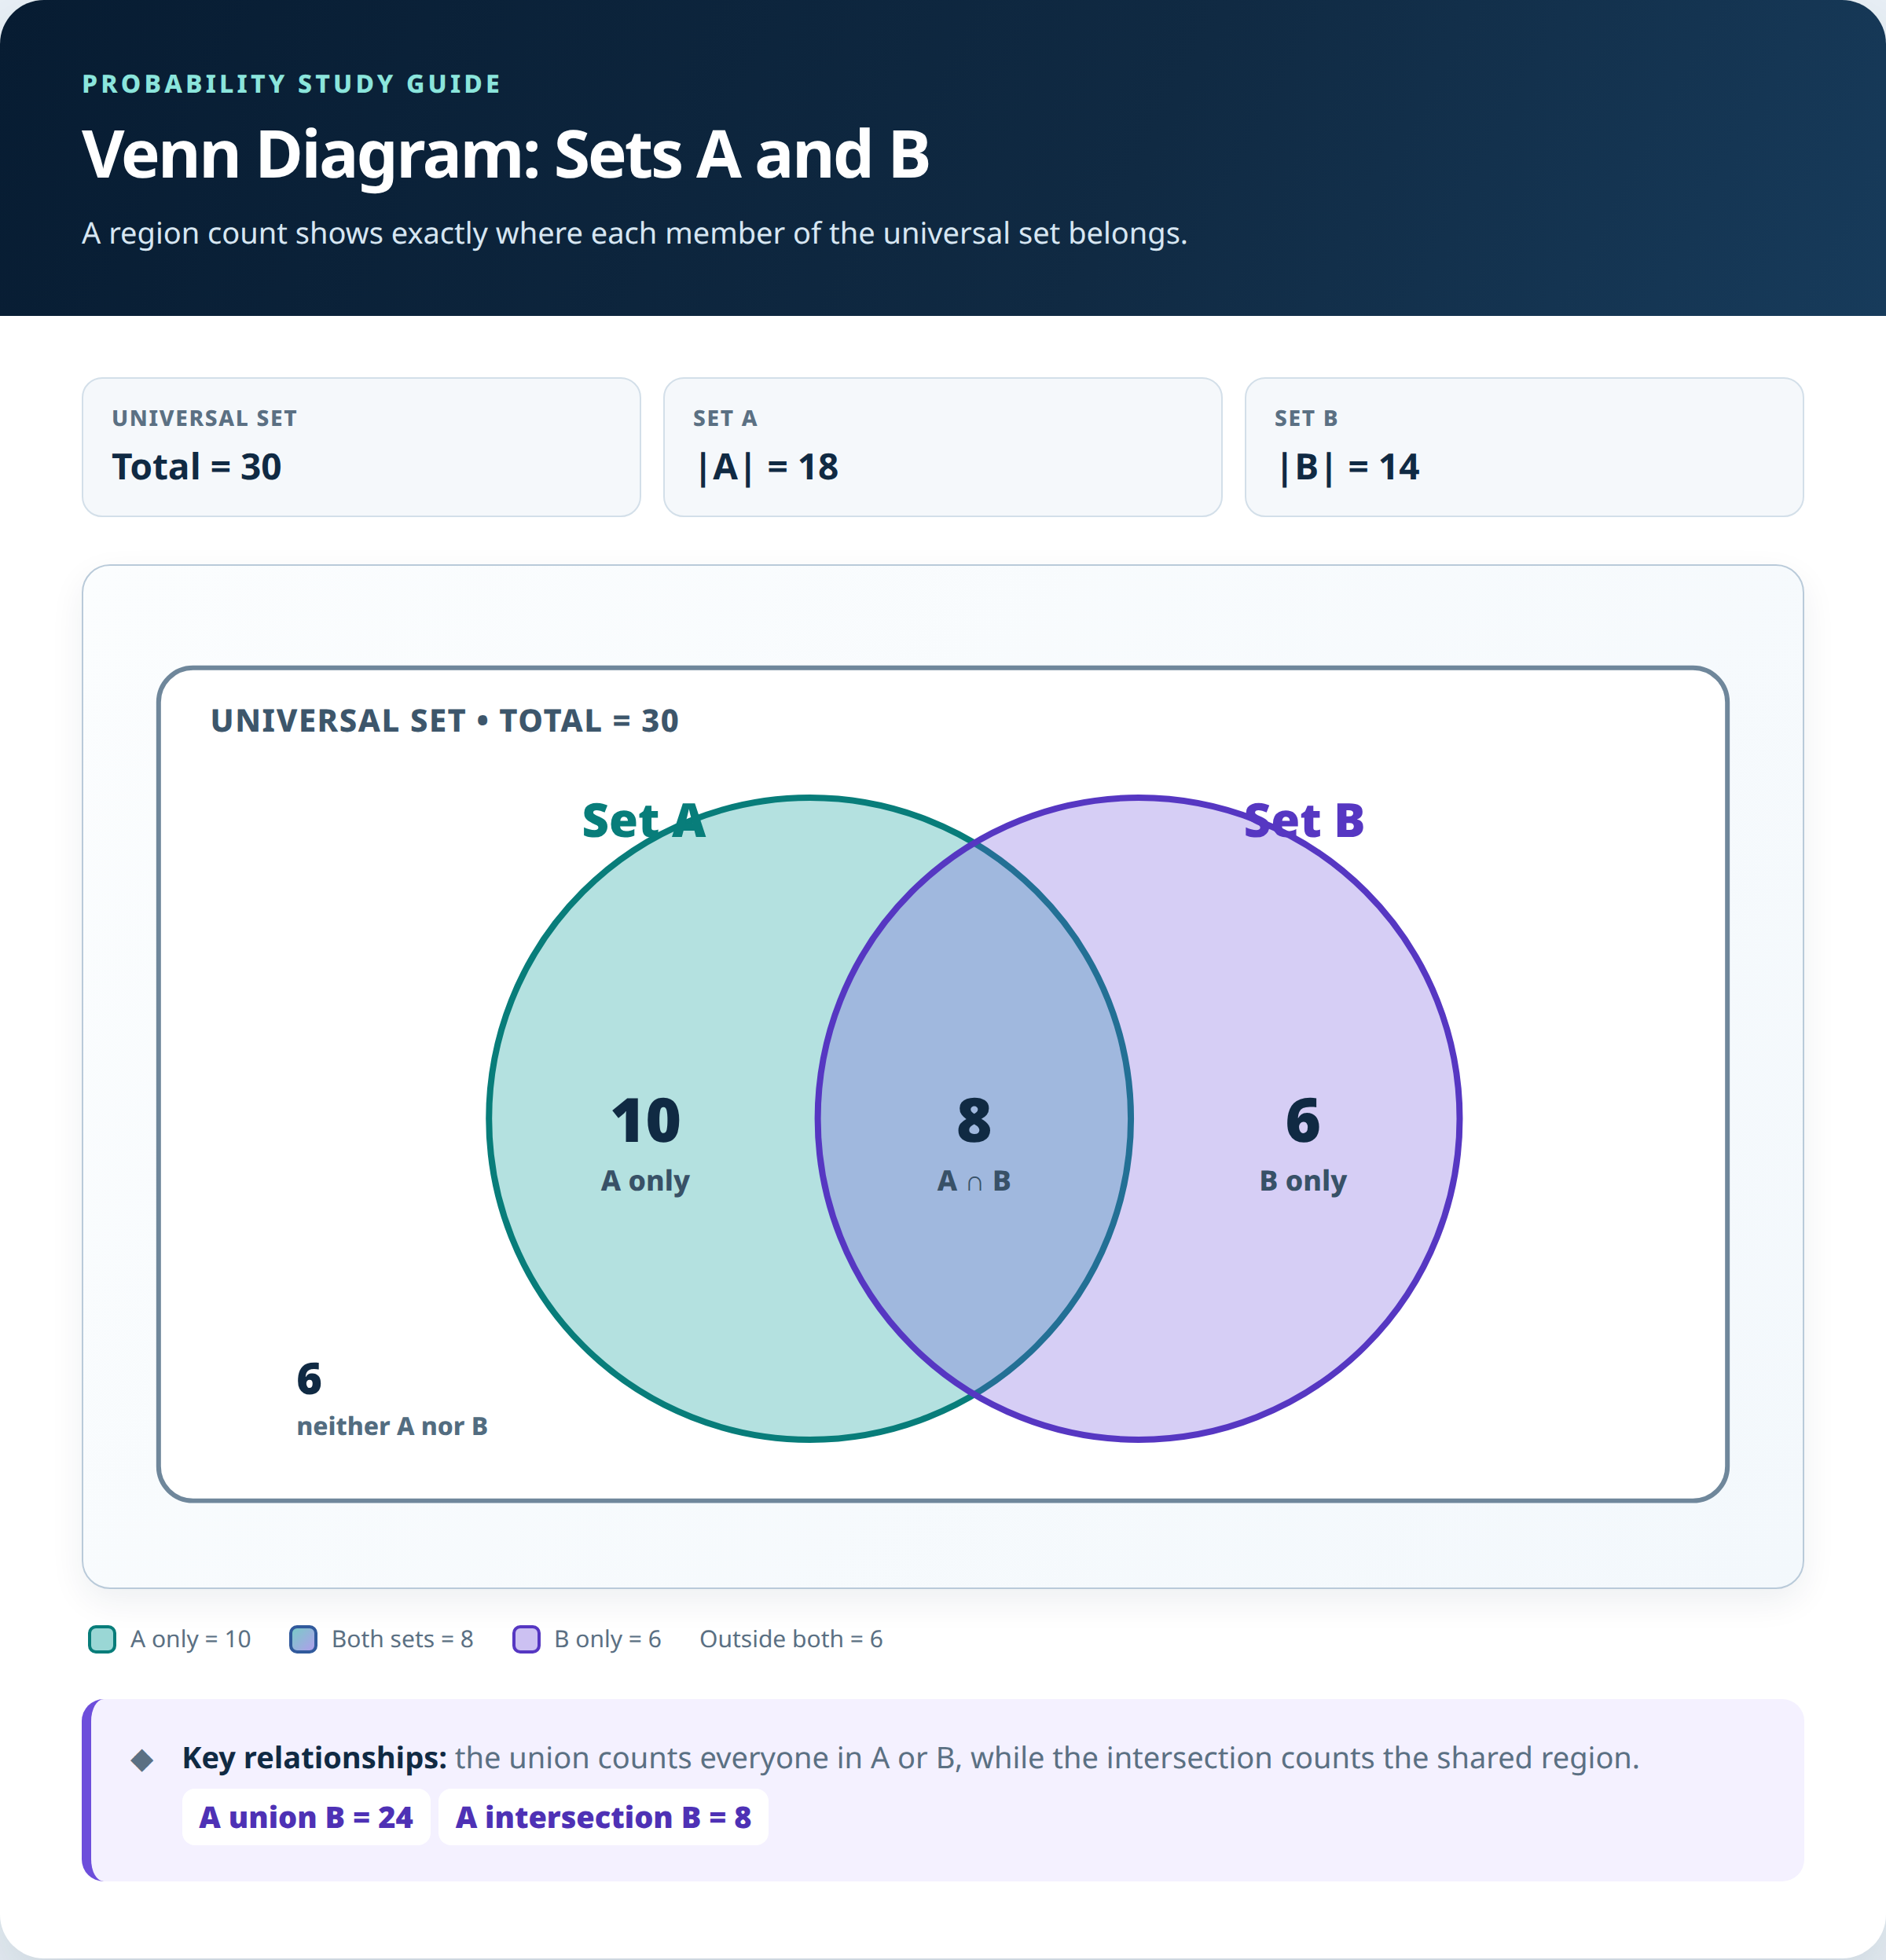
For 30 students, suppose 18 are in A, 14 are in B, and 8 are in both. With columns B, not B and total, the A row is 8, 10, 18. The not-A row is 6, 6, 12. The totals row is 14, 16, 30.
Build the table using subtraction: A but not B is 18 − 8 = 10; B but not A is 14 − 8 = 6. The remaining frequency is 30 − (8 + 10 + 6) = 6. Check both directions. Each row sum must match its row total, each column sum its column total, and the grand total must agree.
When a student is chosen uniformly at random from the whole class, P(A and B) = 8/30. The denominator is the size of the selection pool, not the largest row total. This is the same information you will place in a Venn diagram next.
Concept 4: Venn diagrams separate whole sets from regions
The rectangle represents the universal set, meaning everything under consideration. A circle represents a set of items with a stated property. The overlap is the intersection, written A ∩ B. Each person or item belongs to exactly one disjoint region.

Always fill a two-set count diagram from the middle outwards. Put 8 in the overlap, then 18 − 8 = 10 in A only, and 14 − 8 = 6 in B only. The union contains 10 + 8 + 6 = 24, so neither is 30 − 24 = 6.
A set total is not an 'only' value. Writing 18 in A only would incorrectly imply that A contains 18 + 8 = 26 members. Visible subtractions show the intended method, although the particular examination scheme determines whether method credit is available.
Read the words precisely: A ∪ B means A or B or both; A ∩ B means both. 'Exactly one' includes A only and B only but excludes the overlap. 'At least one' means the union. 'Neither' means outside the union. A′ means not in A, so it includes B only and neither.
For this diagram, n(A ∩ B) = 8, n(A ∪ B) = 24, n(A′) = 12 and the number in exactly one set is 16. A prime means complement, while n means number of elements. A ∩ B′ describes A only.
Some questions require individual elements rather than frequencies. If the universal set is {1, 2, 3, 4, 5, 6}, A is the even numbers and B is numbers greater than 3, put {4, 6} in the overlap, {2} in A only, {5} in B only, and {1, 3} outside. Do not replace elements with their count unless requested.
Why subtract the overlap once? Adding the two whole-set totals counts every overlap member twice. Subtracting one copy leaves each union member counted once.
Concept 5: Trees show complete sequences
Choose a tree when events happen in stages. Draw one first-stage branch for each possible result. From every first-stage endpoint, draw all allowed second-stage branches. Read one complete path from the start to a final endpoint as one combined outcome.

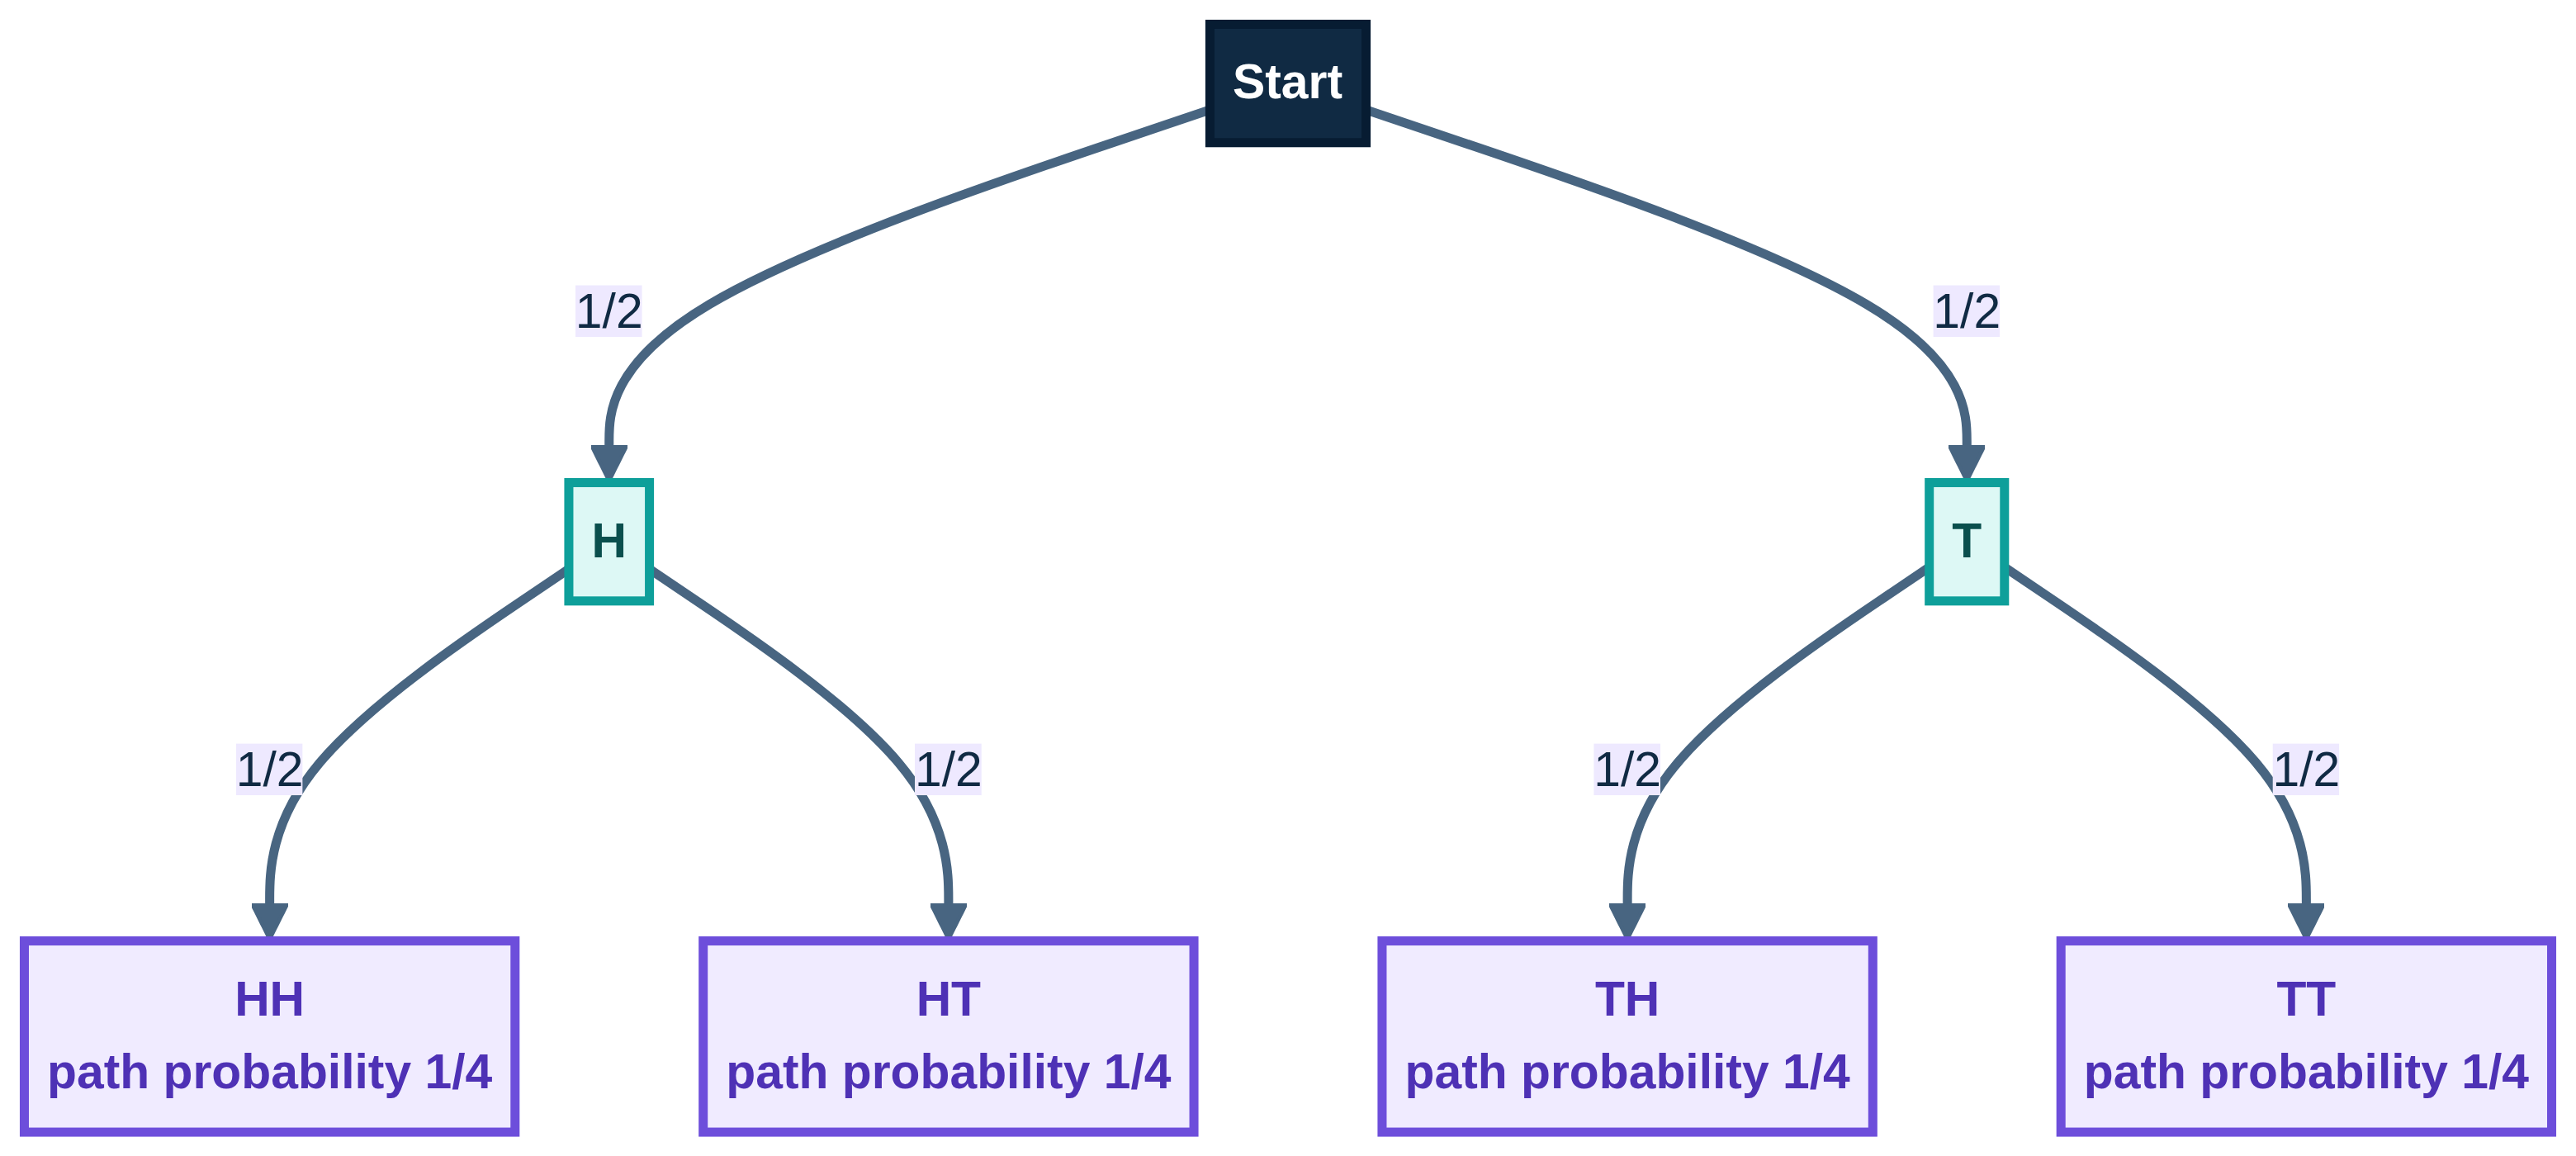
Two coin tosses produce HH, HT, TH and TT. HT and TH remain different sequences, even though both contain exactly one head. Forgetting the second-stage branches after T would miss half the outcomes.
A tree can enumerate outcomes without probabilities. Add branch probabilities when required. For independent fair tosses, each branch is 1/2 and each full path has probability (1/2) × (1/2) = 1/4. Exactly one head uses HT or TH, so add their probabilities: 1/4 + 1/4 = 1/2.
The branching count is a check, not a substitute for drawing the requested tree. With two possible results at each of three unrestricted stages, there are 2 × 2 × 2 = 8 paths. If a rule forbids a continuation, omit that continuation and count the surviving endpoints.
Branch check: probabilities on the alternative branches leaving the same point add to 1. Do not add probabilities from unrelated parts of the tree. Independent events have unchanged later-stage probabilities. Dependent events may have different later-stage probabilities, for example when a counter is removed without replacement. Use the remaining counts, not the original bag total.
Mathematical Relationships
The supplied formulae below refer to Pearson's 2026 exam aids. Check the aid for your own examination series if taking a later exam. Here, N is the universal-set count, n(A) is the number in A, and P(A) is the probability of A. 2 3
Must memorise: multiplication principle. Total complete outcomes = m × k for m first choices and k available second choices for each first choice. For more stages, multiply the successive numbers of choices. If the branch counts vary, count each branch separately and add.
Must memorise: equally likely probability. P(E) = number of outcomes in E / total number of outcomes. Use only when the underlying outcomes are equally likely.
Must memorise: two-set counts. n(A only) = n(A) − n(A ∩ B); n(B only) = n(B) − n(A ∩ B); n(A ∪ B) = n(A) + n(B) − n(A ∩ B); n(neither) = N − n(A ∪ B). Also, n(A′) = N − n(A), and n(exactly one) = n(A) + n(B) − 2n(A ∩ B).
Must memorise: complements and totals. P(A′) = 1 − P(A). Probabilities of a complete set of mutually exclusive outcomes add to 1. Every probability lies between 0 and 1 inclusive.
Must memorise: tree rules. Multiply the stage probabilities along a path. Add probabilities of distinct successful paths. For independent A and B, P(A and B) = P(A)P(B). For disjoint events, P(A or B) = P(A) + P(B).
Given on formula sheet, both tiers, 2026: P(A or B) = P(A) + P(B) − P(A and B). This inclusive-or rule subtracts the overlap once. 2 3
Given on formula sheet, Higher, 2026: P(A and B) = P(A given B)P(B). 3
Must memorise, Higher-only formal extension: P(A | B) = P(A ∩ B)/P(B), provided P(B) > 0. The symbol | means 'given'. In count form this is n(A ∩ B)/n(B). This rearranges the supplied Higher relationship and explains why the denominator changes when selection is restricted to B. It is beyond core P6 enumeration.
Practical Applications and Data Skills
Meal choices, clothing combinations and short access codes make systematic enumeration memorable. Surveys about clubs or subjects use tables and Venn diagrams because a person can have both properties. Successive quality checks or repeated coin tosses are naturally represented by trees. In every case, define the allowed outcomes before counting.
There is no required practical for this GCSE Mathematics topic. You can test the ideas by tossing two coins repeatedly, but observed frequencies are estimates and need not equal theoretical probabilities in a small sample.
No coordinate graph is required. The relevant data skills are reading row and column headings, checking marginal totals, matching regions to wording and tracing tree paths in order. Circle areas and branch lengths do not indicate probability unless the question explicitly says so. Use the written counts or labels.
Probabilities have no units. Keep an exact fraction where possible. To convert a probability to a percentage, multiply by 100: 1/4 = 0.25 = 25%. Never write 0.25% for one quarter. If counts represent people, use whole numbers and check that no region is negative.
Exam Routine and Active Revision
Use read, represent, calculate, check. Read the command word and restrictions. Represent every outcome or disjoint region. Calculate from the correct event and selection pool. Check completeness, totals and whether the answer is plausible.
Each Edexcel paper has 80 marks and lasts 90 minutes. Paper 1 is non-calculator; Papers 2 and 3 allow a calculator. 1 Allow about 1.1 minutes per mark, including checking, as a flexible pacing guide. A six-mark question should normally receive about seven minutes before you decide whether to move on.
Cover and recall: reconstruct the four Venn regions from the totals 30, 18, 14 and 8. Then say which regions form the union, intersection and complement of A. Explain your reason before checking the diagram.
After a short delay, redraw the coin tree without looking and identify the exactly-one-head paths. Revisit missed ideas the next day and again later in the week. Correcting a recalled mistake is more useful than repeatedly reading a solution that already looks familiar.
Ten-Minute Tutor Podcast
Listen once with the diagrams visible, then replay the recall quiz with the guide covered. The episode follows a one-minute introduction, five minutes of core concepts, two minutes of exam tips, a one-minute recall quiz, and a one-minute summary.
Source Notes
In Pearson's June 2023 Foundation Paper 1, Question 24 carries 5 marks: B3 for the fully correct Venn diagram, then M1 and A1 for the probability of B′, with answer 7/10. Question 31 carries 2 marks: M1 for 0.2 × 0.3, then A1 for 0.06. These are verified official allocations, unlike this guide's illustrative rubrics. B denotes independent accuracy credit, M method credit and A accuracy credit dependent on method. 4 5
Visual Resources
3 diagrams and illustrations
](https://xnnrgnazirrqvdgfhvou.supabase.co/storage/v1/render/image/public/study-guide-assets/guide_99715613-acc0-463a-ab3e-3af3d3da14c1/sample_space_grid.png?width=800&format=webp&resize=cover&quality=80)
](https://xnnrgnazirrqvdgfhvou.supabase.co/storage/v1/render/image/public/study-guide-assets/guide_99715613-acc0-463a-ab3e-3af3d3da14c1/venn_regions.png?width=800&format=webp&resize=cover&quality=80)
](https://xnnrgnazirrqvdgfhvou.supabase.co/storage/v1/render/image/public/study-guide-assets/guide_99715613-acc0-463a-ab3e-3af3d3da14c1/coin_tree.png?width=800&format=webp&resize=cover&quality=80)

Interactive Diagrams
2 interactive diagrams to visualise key concepts
Conceptual Flow Outline
Choose the representation by the job it must do, then check completeness before calculating.
Worked Examples
4 worked examples — open one to explore the question and available guidance.
Practice Questions
Try the question, then reveal an answer plan or example response
Choose one drink from C, T, W and one snack from F, N. List all possible drink–snack pairs systematically. State the number of pairs. [3 marks]
Hint: Fix the drink while cycling through both snacks.
A two-digit code is formed from 2, 4 and 6, with no repeated digit. List all codes. One of the valid codes is chosen uniformly at random. Calculate the probability that its numerical value is greater than 40. [4 marks]
Hint: Start with the codes beginning with 2, then 4, then 6.
A group contains 40 people. Set A contains 22 people, set B contains 17 people, and 9 are in both. Complete a two-way frequency table with rows A, not A and total, and columns B, not B and total. Calculate the number who are in neither set. [5 marks]
Hint: Begin with the A-and-B cell, then use row and column totals.
Two distinguishable fair six-sided dice are rolled independently. Use a sample-space grid or a systematic list to calculate the probability that their scores sum to 8. Explain why the possible totals 2 to 12 should not be treated as equally likely. [4 marks]
Hint: List the ordered pairs that sum to 8, not just the total itself.
A spinner lands on R with probability 2/3 and B with probability 1/3. It is spun twice independently. Draw a probability tree, list the four ordered colour outcomes, and calculate the probability that the two colours are different. [5 marks]
Hint: Different colours means RB or BR. The branches are not equally likely.
Higher-only conditional extension, P9. Of 40 students, 24 are in A, 20 are in B, and 12 are in both. Draw and complete a Venn diagram. A student is chosen uniformly at random from the members of set B, including those also in A. Calculate P(A | B), and explain the denominator. [6 marks]
Hint: The selection is restricted to set B, not to the B-only Venn region.
Exam technique
How to turn what you know into marks
How to approach the question
Underline the command word, the allowed choices, whether order matters, and any restriction such as no repetition. Choose a list/grid for combinations, a table/Venn diagram for classifications, or a tree for stages. Identify the requested event before counting or multiplying.
How to structure your answer
For a listing task, show the actual systematic list and any requested count. For a diagram task, label the categories and fill every required cell, region or branch. For a probability task, show the successful outcomes or paths, the correct selection pool, and the calculation. For an explanation, give a reason rather than another number. The marks printed on the question, not a generic template, determine the required scope.
Timing
Each paper is 90 minutes for 80 marks: 1.125 minutes per mark on average. Use about 4–5 minutes for 4 marks and about 7 minutes for 6 marks, including checking. This is flexible pacing, not a fixed rule for every question.
Common pitfalls
- Giving only a total when asked to list all outcomes: show the actual list.
- Counting 12 and 21 as one code when positions matter: retain both ordered outcomes.
- Putting a whole-set total in an only region: subtract the overlap first.
- Forgetting neither: use the universal-set total minus the union.
- Drawing a second-stage split from only one first-stage endpoint: complete every allowed branch.
- Counting outcomes as equally likely without checking: fair dice pairs may be equal, their sums are not.
- Using the whole-population denominator for a restricted selection: identify the actual pool; formal conditional probability is Higher-only.
- Assuming the formula sheet replaces diagram skills: the 2026 aid supplies selected probability formulae, not systematic enumeration methods.
What the command words want
- Draw
- Provide the requested mathematical representation, with clear labels and a complete structure.
- Compare
- Compare the relevant probabilities or methods directly and support the comparison with values or structural reasons. Do not force an unrelated similarities-and-differences essay.
- Explain
- Give a mathematical reason linked with because, such as order matters because the first and second tosses are distinguishable.
- Complete
- Fill all required cells, regions or branches consistently with the labels and given totals.
- Describe
- Identify the pattern or method using correct terms, for example fix the first digit and cycle through the remaining digits.
- Evaluate
- If asked to assess a claim or method, test it against a complete sample space and state a justified judgement. This is not a standard essay-style command for this enumeration topic.
- List all
- Write every allowed outcome, preferably in a visible systematic pattern. A count alone does not answer this command.
- State/Give
- Supply the requested value, set or outcome clearly. A short answer is sufficient only when no working or explanation is requested.
- Calculate/Work out
- Show the arithmetic and the event being counted. Give an exact fraction or an equivalent probability unless a format is specified. Probabilities have no units.
Watch or listen (optional)
Test your understanding of Probability: enumerate sets and combinations of sets systematically, using tables, grids, Venn diagrams and tree diagrams
Active recall beats re-reading. Take an instant quiz now to test what you’ve learned and lock it into long-term memory.
7 days Premium · Then the free plan continues · No card, no charge