Pearson Edexcel · GCSE · Mathematics
Course version: 1MA1 · Version from Mar 2026
Ratio, proportion and rates of change: interpret the gradient at a point on a curve as the instantaneous rate of change; apply the concepts of average and instantaneous rate of change (gradients of chords and tangents) in numerical, algebraic and graphical contexts (this does not include calculus) (Higher tier only)
A curve tells two stories: how much there is and how quickly it is changing. Learn when to use a chord or a tangent, calculate reliable gradients and turn your answer into an exam-ready rate with the correct sign and units.
- 12 min read
- 4 worked examples
- 6 practice questions
- 10 key terms
Try the lesson
The start of the Ratio, proportion and rates of change: interpret the gradient at a point on a curve as the instantaneous rate of change; apply the concepts of average and instantaneous rate of change (gradients of chords and tangents) in numerical, algebraic and graphical contexts (this does not include calculus) (Higher tier only) lesson, made from checked teaching notes for this specification point.
Have a go first
A curve passes through the points A(1, 3) and B(5, 27). Work out the gradient of the chord AB, which gives the average rate of change of y with respect to x between x = 1 and x = 5.
There is more to this lesson
The full lesson goes on to check your understanding and help you earn the marks. Create a free account to carry on, with your progress saved.
A week of Premium from your first lesson · Then the free plan continues · No card, no charge
Check what you remember
Read the wording for your board, then hide it and explain Rate of change in your own words. Rough notes are fine. This is a self-check, with no mark or grade.
Reference: Pearson Edexcel
Change in one quantity per unit change in another quantity.
Study Notes

Overview
A curve can show a cyclist speeding up, a tank emptying or a temperature falling. The height tells you how much of a quantity there is; the gradient tells you how quickly that quantity is changing. This distinction is the heart of Pearson Edexcel GCSE Mathematics Higher-tier specification R15. Candidates must use average and instantaneous rates in numerical, algebraic and graphical contexts, without calculus. 1
An average rate describes an interval and is found from the gradient of a chord joining two curve points. An instantaneous rate describes one moment and is estimated from the gradient of a tangent at the relevant point. Both use vertical change divided by horizontal change, but choosing the correct line is essential.
Questions may ask candidates to calculate an average speed, draw a tangent, estimate a gradient, explain a negative rate or compare rates at different times. The topic links straight-line gradients, substitution into expressions, compound measures and motion graphs. Work through the illustrated examples, then cover the solutions and reproduce the method. Marks are earned through clear constructions, correct calculations and answers that fit the context.
Key Concepts
1. Gradient measures change, not height
For a straight line, gradient is the vertical change divided by the horizontal change. A gradient of 5 means that y increases by 5 units for each increase of 1 unit in x. It does not mean y equals 5. On a curve, steepness varies, so a single gradient cannot describe the entire graph.
Use the changes in coordinate values, not just the number of squares. If one horizontal square represents 2 seconds and one vertical square represents 10 metres, a rise of three squares over two squares means 30 metres divided by 4 seconds, giving 7.5 m/s. Dividing 3 by 2 would ignore the scales.
Cover and recall: explain why a point at height 30 could have a lower rate than a point at height 10. Expected reasoning: height describes the quantity, while the local gradient describes its rate of change.
2. Average rate: the gradient of a chord
An average rate answers a question containing an interval, such as “between 2 and 5 seconds”. Locate both endpoint positions on the curve. Join them with a straight line segment, called a chord, and calculate its gradient. This averages the total change over the whole interval.
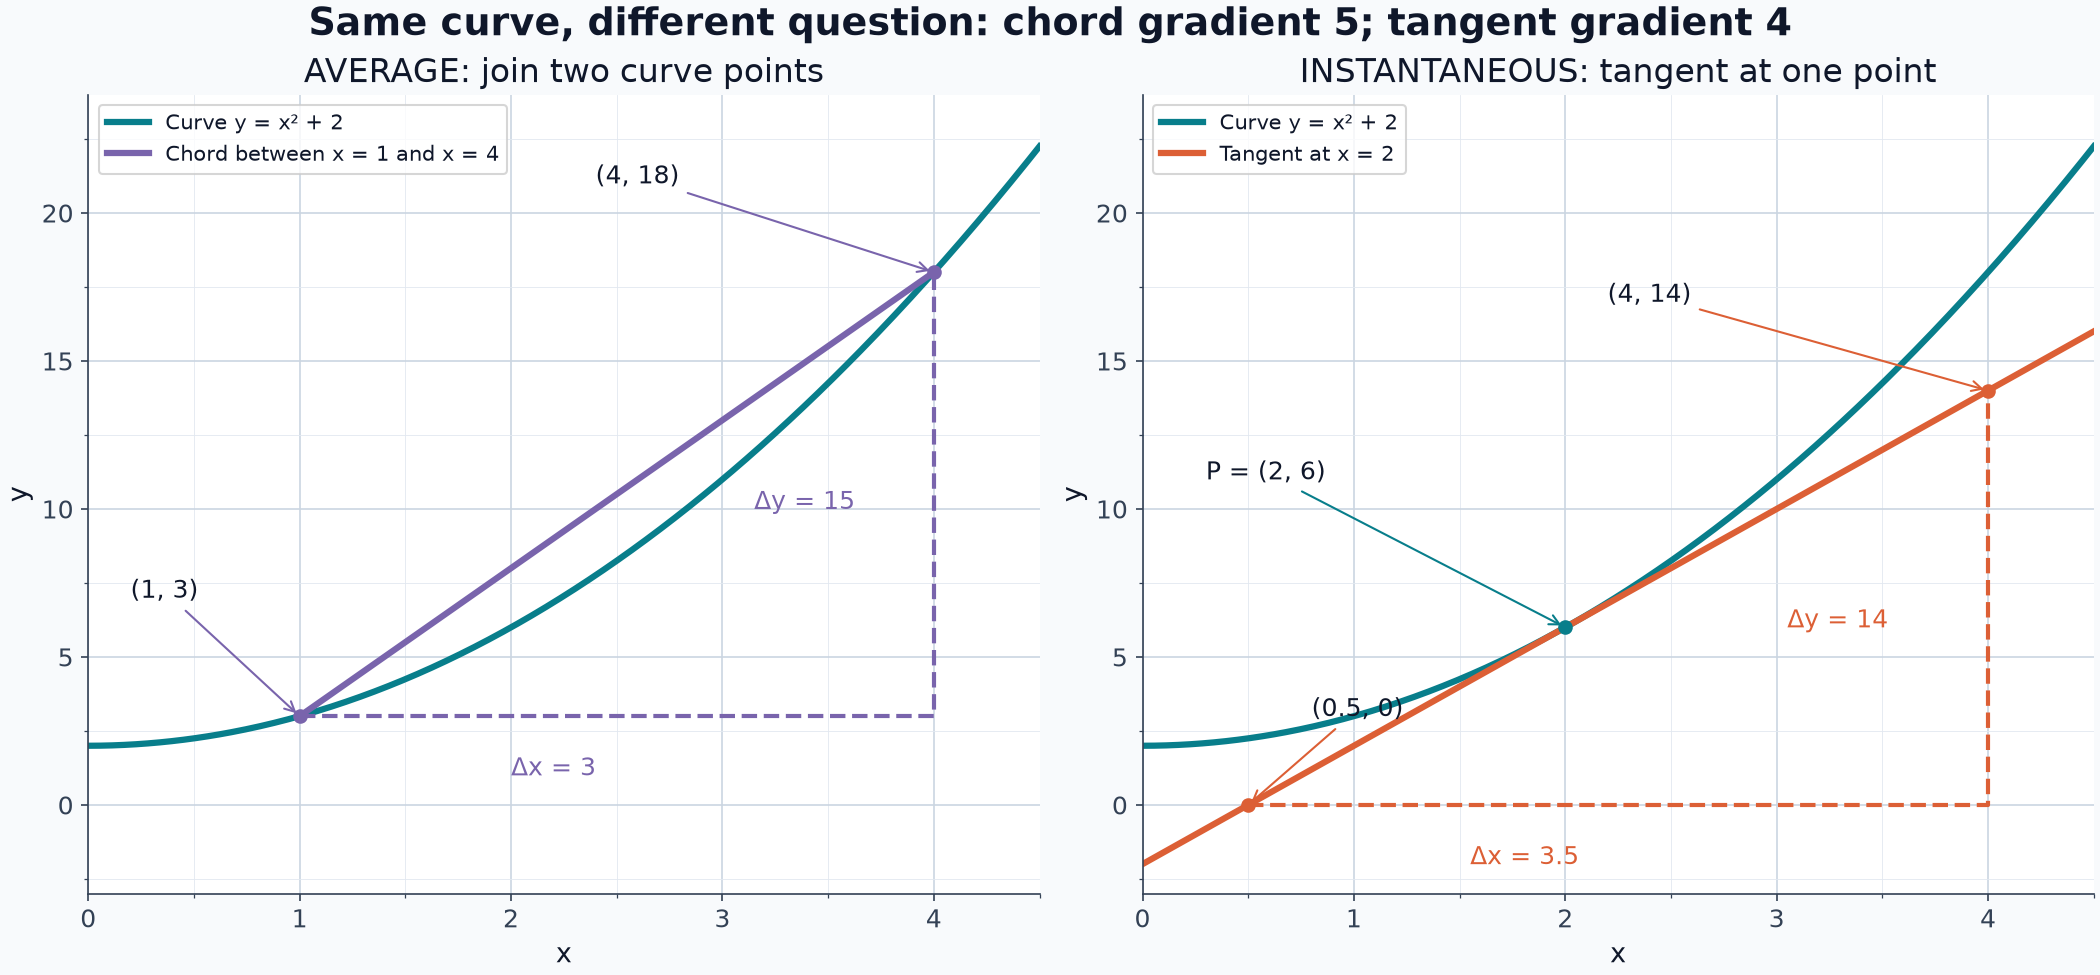
Example: for y = x² + 2, substituting x = 1 gives y = 3, and substituting x = 4 gives y = 18. Therefore the average rate is (18 − 3)/(4 − 1) = 15/3 = 5 y-units per x-unit. The calculation is exact when the endpoint values are exact. Graph readings may make an average-rate answer approximate.

The purple chord joins two curve points. The orange tangent measures the rate at x = 2. Their gradients are different because they answer different questions. A chord describes the constant rate that would produce the same overall change, not a claim that the original process changed steadily.
Why does this work? dividing the total change by the interval distributes that change equally across each unit of x. This is the same reasoning as total distance divided by total time for average speed.
3. Instantaneous rate: the gradient of a tangent
An instantaneous rate answers “how fast is it changing at this point?” Imagine a speedometer reading rather than a whole-journey average. Draw a tangent through the specified curve point, matching the curve’s direction in the immediate neighbourhood of that point. Then calculate the tangent’s gradient.
Do not define a tangent as a line that can only touch a general curve once. A tangent can meet the curve elsewhere, or cross it at an inflection point. For this GCSE method, the important feature is its local direction at the required point. Avoid a line that simply cuts across the nearby curve with the wrong direction.
To construct it, mark the stated x-value, locate the corresponding curve point, place a ruler through it and adjust the ruler until the line follows the nearby curve. Extend the line across a useful part of the grid. A neat tangent and visible gradient working allow examiners to identify your method.
What if you know the curve’s equation? you can calculate endpoint values for an average rate by substitution. That does not automatically give an instantaneous rate. At GCSE, use the supplied graph, numerical information or tangent information. Differentiation is outside this specification point. 1
4. Choose two points on the tangent, not the curve
After drawing the tangent, select two clearly readable points on that straight line. They need not lie on the original curve. Use widely separated points and draw a right-angled triangle with horizontal and vertical sides. The sloping side lies along the tangent.
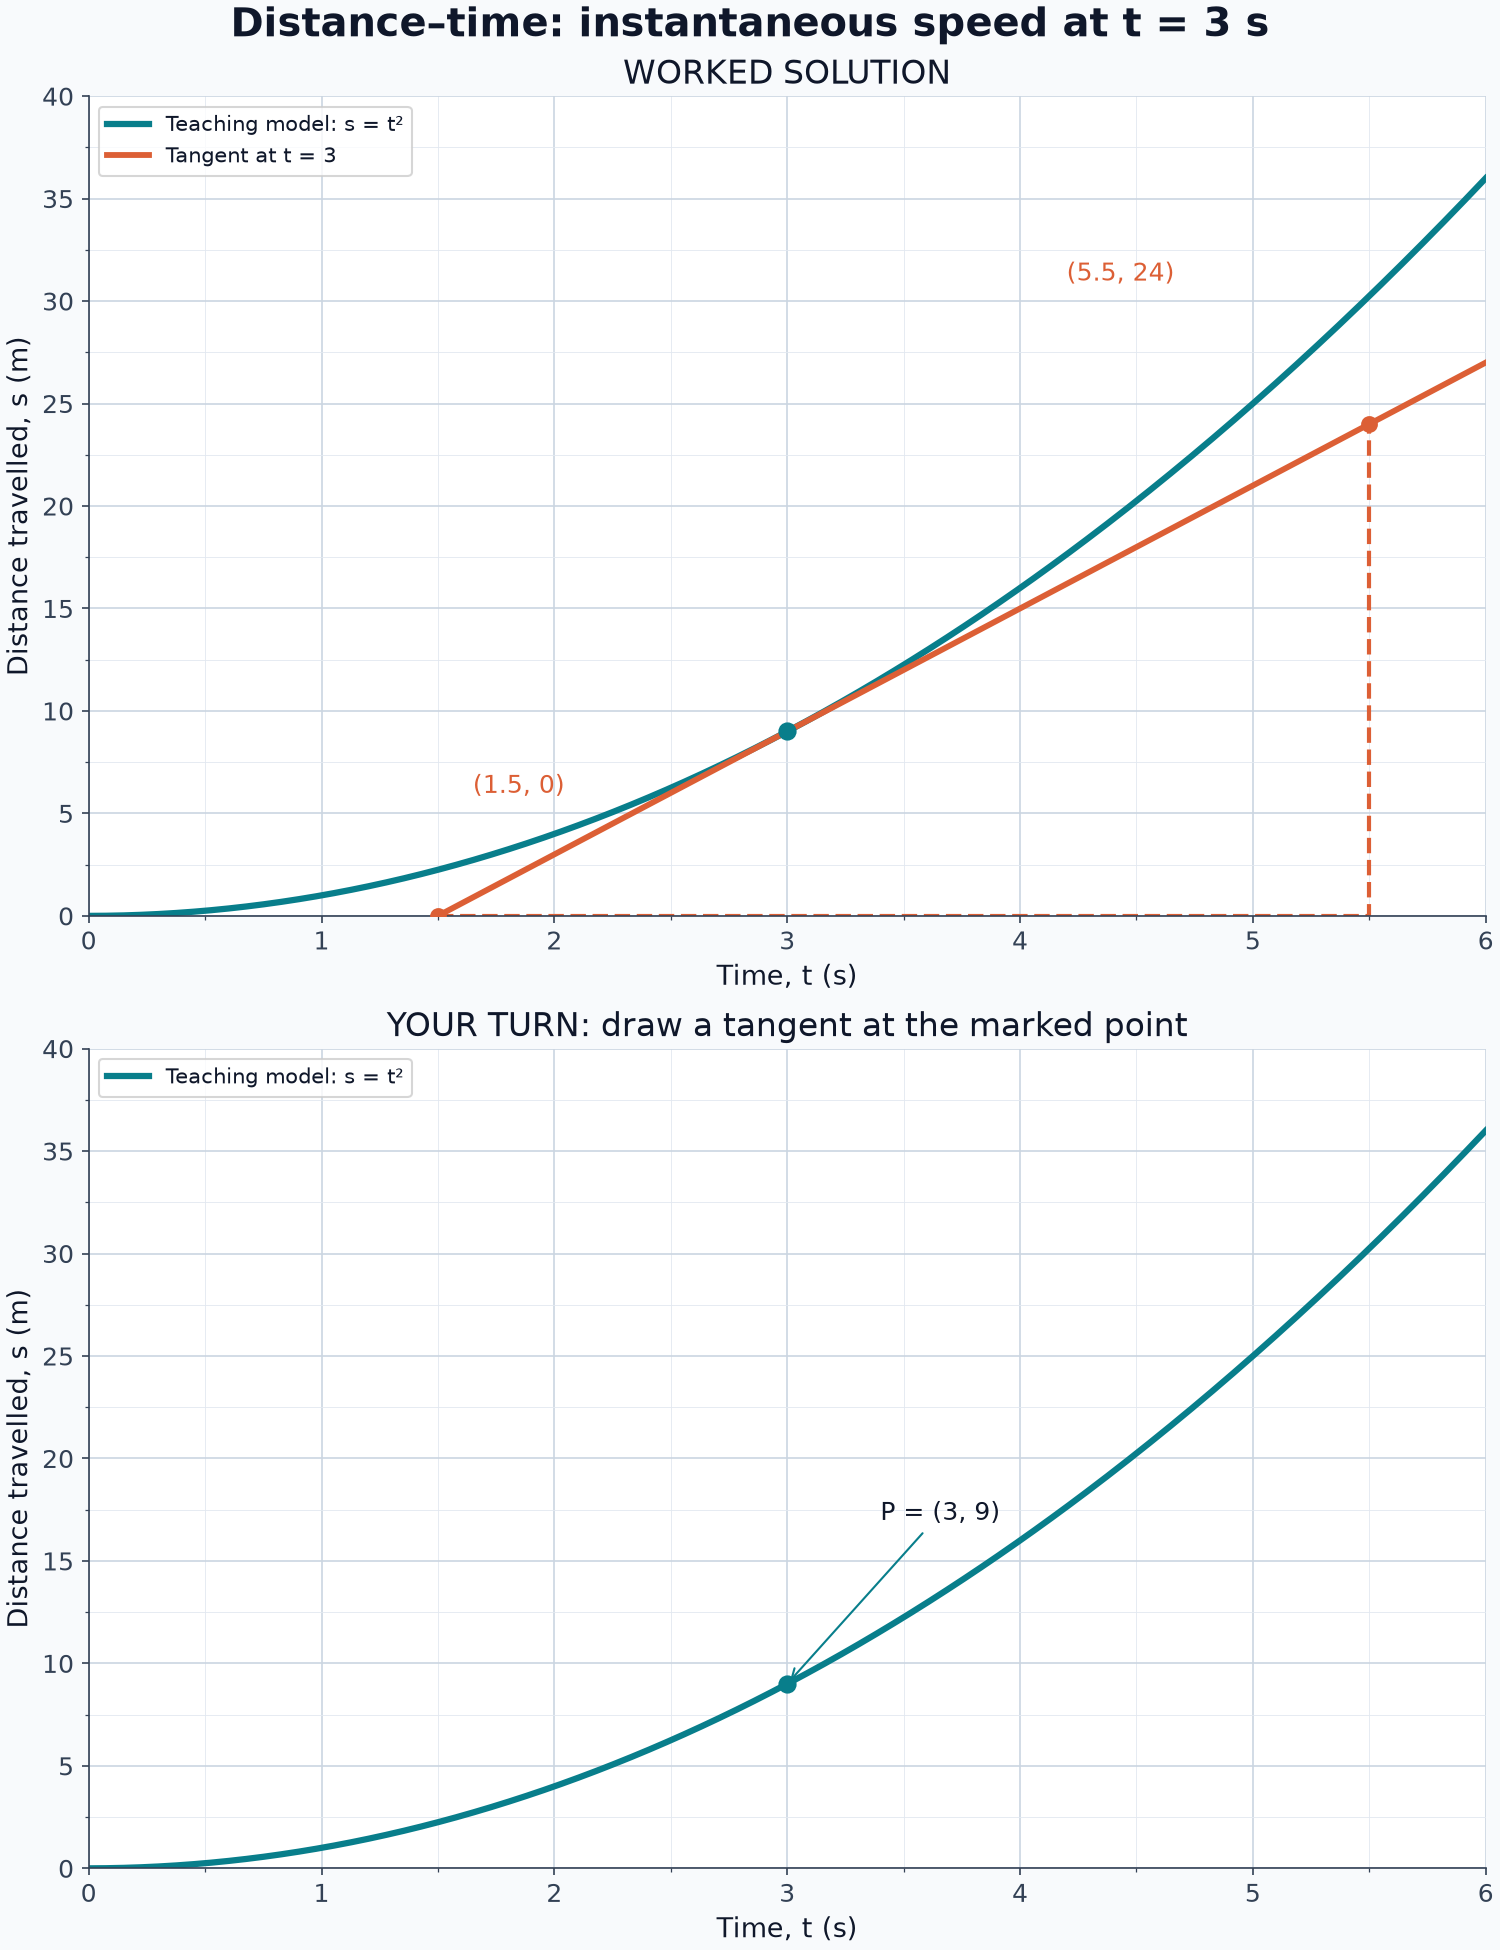
Example: the distance-time tangent below passes through (1.5, 0) and (5.5, 24). Its gradient is (24 − 0)/(5.5 − 1.5) = 24/4 = 6 m/s. The target instant remains t = 3 seconds. The calculation points are simply convenient positions for measuring the same straight tangent.

Cover the upper worked panel and draw your own tangent on the lower panel. Record your chosen coordinates before calculating. A large triangle reduces the relative effect of small reading inaccuracies. This does not mean choosing a longer interval on the curve, which would change the question into an average-rate calculation.
5. Signs and context determine the interpretation
A rising tangent has positive gradient; a falling tangent has negative gradient. A horizontal tangent has gradient zero. Describe both the numerical result and what it means when asked to interpret a rate.
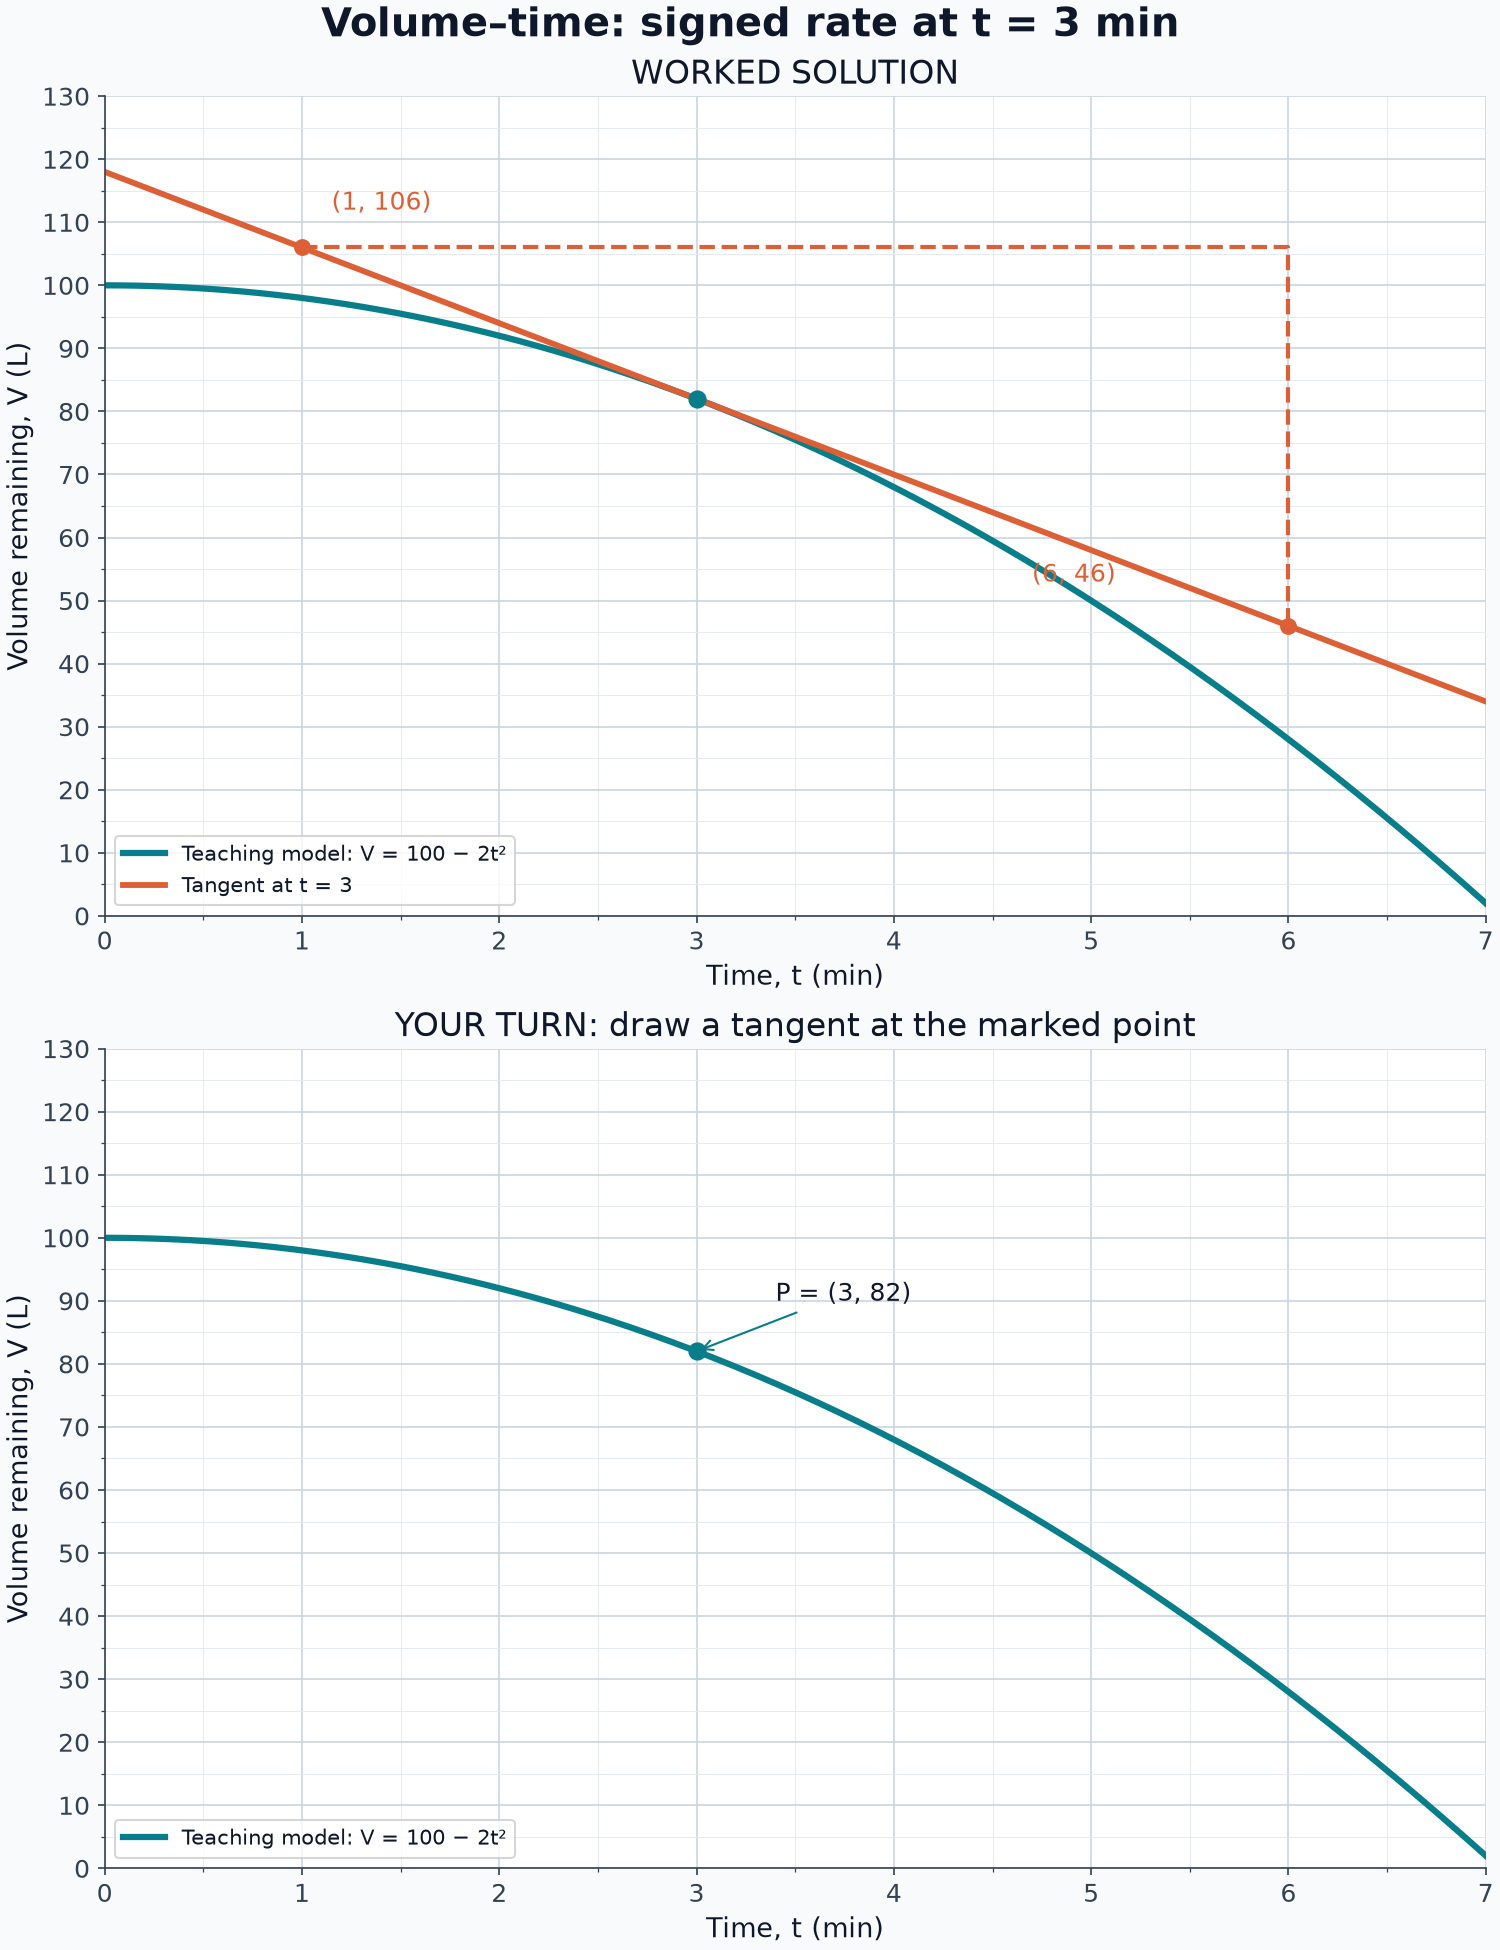
On the volume graph below, a tangent passes through (1, 106) and (6, 46). Its gradient is (46 − 106)/(6 − 1) = −60/5 = −12 L/min. The volume remaining is decreasing at 12 litres per minute at the stated instant. If asked for the magnitude of the outflow, give 12 L/min, rather than a negative magnitude.

For temperature against time, the compound unit might be °C/min. A rate of −2 °C/min means the temperature is falling, not that the temperature itself equals −2 °C. On a speed-time graph, gradient is acceleration; on a distance-travelled-time graph, gradient is speed. On a displacement-time graph, a signed gradient is velocity. Always read the axis labels before naming the result.
6. Numerical estimates from nearby values
When readings are supplied near a target time, a short chord can approximate the tangent gradient. For readings equally spaced around t = 3, with s = 8.41 at t = 2.9 and s = 9.61 at t = 3.1, the estimate is (9.61 − 8.41)/(3.1 − 2.9) = 1.20/0.20 = 6 m/s.
This is still a finite-interval average used as an estimate of the instantaneous rate. Do not claim it must be exact for every curve. With exact smooth data, nearby readings can improve a local estimate; with rounded or noisy measurements, an extremely short interval can make reading errors proportionally larger. Use the information requested in the question and state a relevant limitation when asked.
Cover and recall: distinguish the small interval on the curve used in a numerical estimate from the large triangle on an already-drawn tangent. They solve different accuracy problems.
Mathematical Relationships
The following relationships are Must memorise for this topic: they are not printed on Pearson’s 2026 Higher-tier formula sheet. A particular question may supply information, but the exam aid does not supply these methods. 2
Must memorise: gradientm = Δy/Δx = (y₂ − y₁)/(x₂ − x₁).
Here m is gradient, Δ means “change in”, and the subscripts identify two points on the relevant straight line. Use the same subtraction order above and below. The horizontal change must be non-zero; a vertical line has no finite gradient.
Must memorise: average rate for an algebraic functionAverage rate from x = a to x = b = [f(b) − f(a)]/(b − a), where a ≠ b and y = f(x). The notation f(a) means the value of y when x equals a. Substitution followed by ordinary arithmetic is enough; calculus is not required.
Must memorise: instantaneous-rate estimateInstantaneous rate at a point ≈ gradient of the tangent there = Δy/Δx using two points on that tangent. The approximation sign reflects the graphical estimation process, not a different gradient formula.
Must memorise: contextual rates and unitsAverage speed = distance travelled/time taken. Average acceleration = change in velocity/time taken; for the straight-line, same-direction speed-time situations used here, change in speed/time gives the acceleration. Volume-change rate = change in volume/change in time. Rate units = vertical-axis units divided by horizontal-axis units.
Must memorise: useful straight-line linky = mx + c, where m is gradient and c is the y-intercept. If a tangent equation is supplied, its coefficient of x gives its gradient. If its gradient and a point are supplied, substitution can find c. Do not use this as an unsupported way of finding a tangent from a curve equation.
Graph and Data Skills
Start by reading the labels, units and scale on each axis. Do not assume the graph begins at zero or that the scales are equal. When plotting a curve from values, label the axes, plot accurately and use a smooth curve where the relationship is smooth; do not replace it with a chain of arbitrary straight segments.
For an average rate, show the chord between the two required curve positions. For an instantaneous rate, show the tangent at the specified position. Keep enough of the construction visible to support your numerical method. Choose readable grid positions on your straight line and calculate coordinate differences explicitly.
Compare rates through gradients, not heights. On the same distance-time graph, a steeper rising tangent means greater speed. If the axes or scales differ, calculate the rates before comparing. Retain sensible precision and round only the final answer. Graphical estimates should reflect the quality of the readings, not a calculator’s long decimal display.
Unit Conversions
Must memorise: 1 km = 1000 m; 1 minute = 60 seconds; 1 hour = 3600 seconds; 1 L = 1000 mL. Convert consistently before dividing, or convert the final compound unit correctly.
For example, 0.36 km/min = 360 m/60 s = 6 m/s. To convert m/s to km/h, multiply by 3.6; to convert km/h to m/s, divide by 3.6. A volume rate of −12 L/min equals −12,000 mL/60 s = −200 mL/s. Preserve the negative sign during conversion.
Practical Applications
Journey graphs turn distance readings into average or instantaneous speed. Tank graphs turn changing volume into filling or emptying rates. Cooling graphs turn temperature readings into rates of temperature change. Financial graphs can show change in value per year. Each context uses the same gradient calculation with different axis units.
There is no required practical attached to this GCSE Mathematics specification point. The assessed practical skill is handling numerical data and constructing and interpreting graphs, not recalling a science apparatus list.
Earn the Marks
A real Pearson example is June 2022 Higher Paper 1, question 14(a): M1 for a tangent at t = 2, M1 for a complete gradient method and A1 for an answer between 0.7 and 1.1. These three marks illustrate why construction and working matter. That tolerance applies only to that particular question, not to this guide’s graphs. 3
All worked and practice questions in this guide are original Edexcel-style material. Their allocations are illustrative, not official Pearson mark schemes. An interpretation or unit may be part of the required final answer; it does not automatically carry its own separate mark in every examination question.
Each paper lasts 90 minutes for 80 marks, giving 1.125 minutes per mark overall. 1 Use about 3–4 minutes for 3 marks, 4–5 minutes for 4 marks and 6–7 minutes for 6 marks as flexible pacing targets. Show the correct line, coordinate changes, division and contextual conclusion without unnecessary prose.
Listen, Pause and Recall
Listen with a pencil ready. The ten-minute episode contains an introduction, core explanations, examiner tips, a recall quiz and a summary. During the quiz, answer before the tutor does. Afterwards, close the guide and redraw the chord-versus-tangent decision from memory. Return tomorrow and attempt one question of each type in mixed order.
References
Visual Resources
3 diagrams and illustrations
](https://xnnrgnazirrqvdgfhvou.supabase.co/storage/v1/render/image/public/study-guide-assets/guide_e15083c3-51bf-4a47-aacf-262b7bf30b7a/chord_tangent_comparison.png?width=800&format=webp&resize=cover&quality=80)
](https://xnnrgnazirrqvdgfhvou.supabase.co/storage/v1/render/image/public/study-guide-assets/guide_e15083c3-51bf-4a47-aacf-262b7bf30b7a/instantaneous_speed_graph.png?width=800&format=webp&resize=cover&quality=80)
](https://xnnrgnazirrqvdgfhvou.supabase.co/storage/v1/render/image/public/study-guide-assets/guide_e15083c3-51bf-4a47-aacf-262b7bf30b7a/volume_rate_graph.png?width=800&format=webp&resize=cover&quality=80)

Interactive Diagrams
2 interactive diagrams to visualise key concepts
Conceptual Flow Outline
Choose the correct line before calculating: chord for an interval, tangent for an instant.
Conceptual Flow Outline
The same gradient method produces different rates because the vertical quantity and units differ.
Worked Examples
4 worked examples — open one to explore the question and available guidance.
Practice Questions
Try the question, then reveal an answer plan or example response
Original Edexcel-style practice (3 marks; illustrative allocation). A cyclist’s distance travelled is 16 m at 2 s and 40 m at 5 s. Calculate the cyclist’s average speed between 2 s and 5 s.
Hint: Find the change in distance and divide by the change in time. This is prerequisite practice within a Higher-tier guide.
Original Edexcel-style practice (3 marks; illustrative allocation). A straight line on a speed-time graph passes through (0, 4) and (5, 14), where time is in seconds and speed is in m/s. Calculate the acceleration.
Hint: The gradient of a speed-time graph is acceleration, not speed.
Original Edexcel-style practice (3 marks; illustrative allocation). For the curve y = x² + 1, calculate the average rate of change of y with respect to x from x = 2 to x = 5.
Hint: Calculate y at both x-values before using change in y divided by change in x.
Original Edexcel-style practice (4 marks; illustrative allocation). Use only the lower, curve-only panel of {{asset:instantaneous_speed_graph.png}}. Draw a tangent to the curve at t = 3. Choose two well-separated points on your tangent and use them to estimate the instantaneous speed. Cover the upper worked-solution panel before starting.
Hint: The tangent passes through the curve point at t = 3 and matches the local direction there.
Original Edexcel-style practice (5 marks; illustrative allocation). Use only the lower, curve-only panel of {{asset:volume_rate_graph.png}}. Draw a tangent at t = 3 and estimate (i) the signed rate of change of volume and (ii) the magnitude of the outflow rate. Cover the upper worked-solution panel before starting.
Hint: A negative gradient shows that the volume remaining is decreasing; an outflow magnitude is positive.
Original Edexcel-style practice (5 marks; illustrative allocation). Teaching-model values for a vehicle’s distance are: at t = 3.9 s, s = 7.605 m; at t = 4.0 s, s = 8.000 m; at t = 4.1 s, s = 8.405 m. The vehicle was at s = 0 when t = 0. (a) Use a symmetric nearby chord to estimate its instantaneous speed at t = 4. (b) Calculate its average speed from 0 to 4 seconds. (c) Compare the results and explain why part (a) gives only an estimate.
Hint: Use the measurements on either side of 4 seconds for part (a), not the whole-journey endpoints.
Exam technique
How to turn what you know into marks
How to approach the question
Underline the interval or specified instant. Read the axes and scales. Choose a chord for an average, or a tangent for an instant. Draw the line when required, identify readable coordinates, show vertical change divided by horizontal change, then answer in context with sensible precision.
How to structure your answer
For an average-rate calculation, show endpoint substitution or readings, a difference quotient and the result. For a drawn-tangent estimate, show a plausible tangent at the correct point, two points on that line, the gradient calculation and a contextual conclusion if asked. For a comparison or explanation, name both rates and give a mathematical reason. The actual allocation varies by question. June 2022 Paper 1H Q14(a) awarded M1 for the tangent, M1 for the complete gradient method and A1 for the specified accepted range.
Timing
Pearson papers contain 80 marks in 90 minutes, giving 1.125 minutes per mark overall. Flexible targets: 3 marks in about 3–4 minutes, 4 marks in 4–5 minutes and 6 marks in 6–7 minutes. This is pacing advice, not an official per-question time limit.
Common pitfalls
- Using a chord for an instantaneous rate: identify whether the question specifies one point or an interval before drawing.
- Reading the calculation points from the curve: after drawing a tangent, use points on that tangent instead.
- Using a tiny tangent triangle: select well-separated readable points to reduce relative reading error.
- Reporting the y-coordinate as the rate: calculate a gradient, not a height.
- Counting squares without the scales: convert both changes into coordinate values before dividing.
- Reversing just one subtraction: keep coordinate order consistent in numerator and denominator.
- Confusing speed with acceleration: distance-time gradient gives speed; speed-time gradient gives acceleration.
- Removing a negative sign automatically: retain it for a signed rate; give a positive number when a magnitude is requested.
- Assuming every graph accepts the same tolerance: the accepted range belongs to the particular official mark scheme.
- Treating every tangent as a line that never crosses the curve: it must match the local direction at the specified point.
What the command words want
- Draw
- Make the requested construction visible and accurate. A numerical answer alone does not replace a required tangent.
- Compare
- Compare the same quantities with numerical rates where possible. Say which is greater and support the comparison with gradients, not graph heights.
- Explain
- Give a mathematical reason. For example: speed increases because the distance-time tangent gradient increases. A repeated observation without a reason may not gain the explanation credit.
- Describe
- Identify the trend using the correct quantity, such as the volume decreases or the distance-time gradient becomes steeper.
- Estimate
- Use the specified graph or numerical method and show working. Approximate does not mean guess; quote precision justified by the data.
- Evaluate
- In mathematics, evaluate an expression means calculate its numerical value. It does not mean write a discussion of both sides.
- State/Give
- Provide the requested fact, value, unit or interpretation concisely. Do not calculate something different from what is requested.
- Calculate/Work out
- Show the relevant values, substitution, subtraction and division. Include the correct unit and sign where applicable.
Watch or listen (optional)
Test your understanding of Ratio, proportion and rates of change: interpret the gradient at a point on a curve as the instantaneous rate of change; apply the concepts of average and instantaneous rate of change (gradients of chords and tangents) in numerical, algebraic and graphical contexts (this does not include calculus) (Higher tier only)
Active recall beats re-reading. Take an instant quiz now to test what you’ve learned and lock it into long-term memory.
A week of Premium from your first lesson · Then the free plan continues · No card, no charge