Pearson Edexcel · GCSE · Mathematics
Course version: 1MA1 · Version from Mar 2026
Ratio, proportion and rates of change: interpret the gradient of a straight line graph as a rate of change; recognise and interpret graphs that illustrate direct and inverse proportion
A graph is more than a picture: its gradient can reveal a cyclist's speed, a tank's emptying rate or a price per kilogram. Learn to calculate and interpret rates with the correct units, then distinguish direct proportion from inverse proportion using the origin, constant quotients and constant products. [Download the complete JSON study guide](/home/ubuntu/study_guide/gradient_proportion_study_guide.json).
- 14 min read
- 4 worked examples
- 7 practice questions
- 11 key terms
Try the lesson
The start of the Ratio, proportion and rates of change: interpret the gradient of a straight line graph as a rate of change; recognise and interpret graphs that illustrate direct and inverse proportion lesson, made from checked teaching notes for this specification point.
Have a go first
A straight line graph passes through the points (0, 0) and (4, 20). What is the gradient of the line?
There is more to this lesson
The full lesson goes on to check your understanding and help you earn the marks. Create a free account to carry on, with your progress saved.
7 days Premium · Then the free plan continues · No card, no charge
Check what you remember
Read the wording for your board, then hide it and explain Gradient in your own words. Rough notes are fine. This is a self-check, with no mark or grade.
Reference: Pearson Edexcel
The ratio of vertical change to the matching horizontal change between two points on a straight line: Δy/Δx.
Study Notes

Overview
A graph can tell you how quickly a cyclist travels, how much a taxi charges per kilometre, or how adding workers changes the time needed for a job. This topic teaches you to translate those pictures into rates, equations and explanations that earn marks. A straight line has a constant gradient: its vertical change divided by the matching horizontal change. The axis labels turn that number into a meaningful rate, such as kilometres per hour or pounds per kilogram.
Pearson Edexcel GCSE Mathematics specification 1MA1, R14 requires candidates to interpret straight-line gradients as rates of change and recognise and interpret direct and inverse proportion graphs. These skills connect with straight-line equations, ratio, compound measures and unit conversions. Questions may ask you to work out a gradient, explain what it represents, compare journey sections, or justify whether two quantities are proportional. Some combine a calculation with a short written explanation, so a correct number is not always a complete answer.
Learn to check the axes, select exact points, calculate changes and interpret your result. Then practise explaining why a straight line through the origin represents direct proportion, while a positive inverse-proportion relationship has a constant product. 1
Key Concepts
1. Gradient: matching change up to change across
The gradient measures the change in the vertical quantity for each one-unit increase in the horizontal quantity. If a line passes through two points, subtract their vertical coordinates and divide by the difference between their horizontal coordinates. Use the same point order in both subtractions. The points need not be the endpoints or include the origin.
Choose two clear points far apart on the line. A large right-angled gradient triangle reduces the effect of small reading errors. Read the values on the axes, not merely the number of squares. Four vertical squares might represent 120 kilometres while four horizontal squares represent two hours. Dividing four by four would ignore the scales.

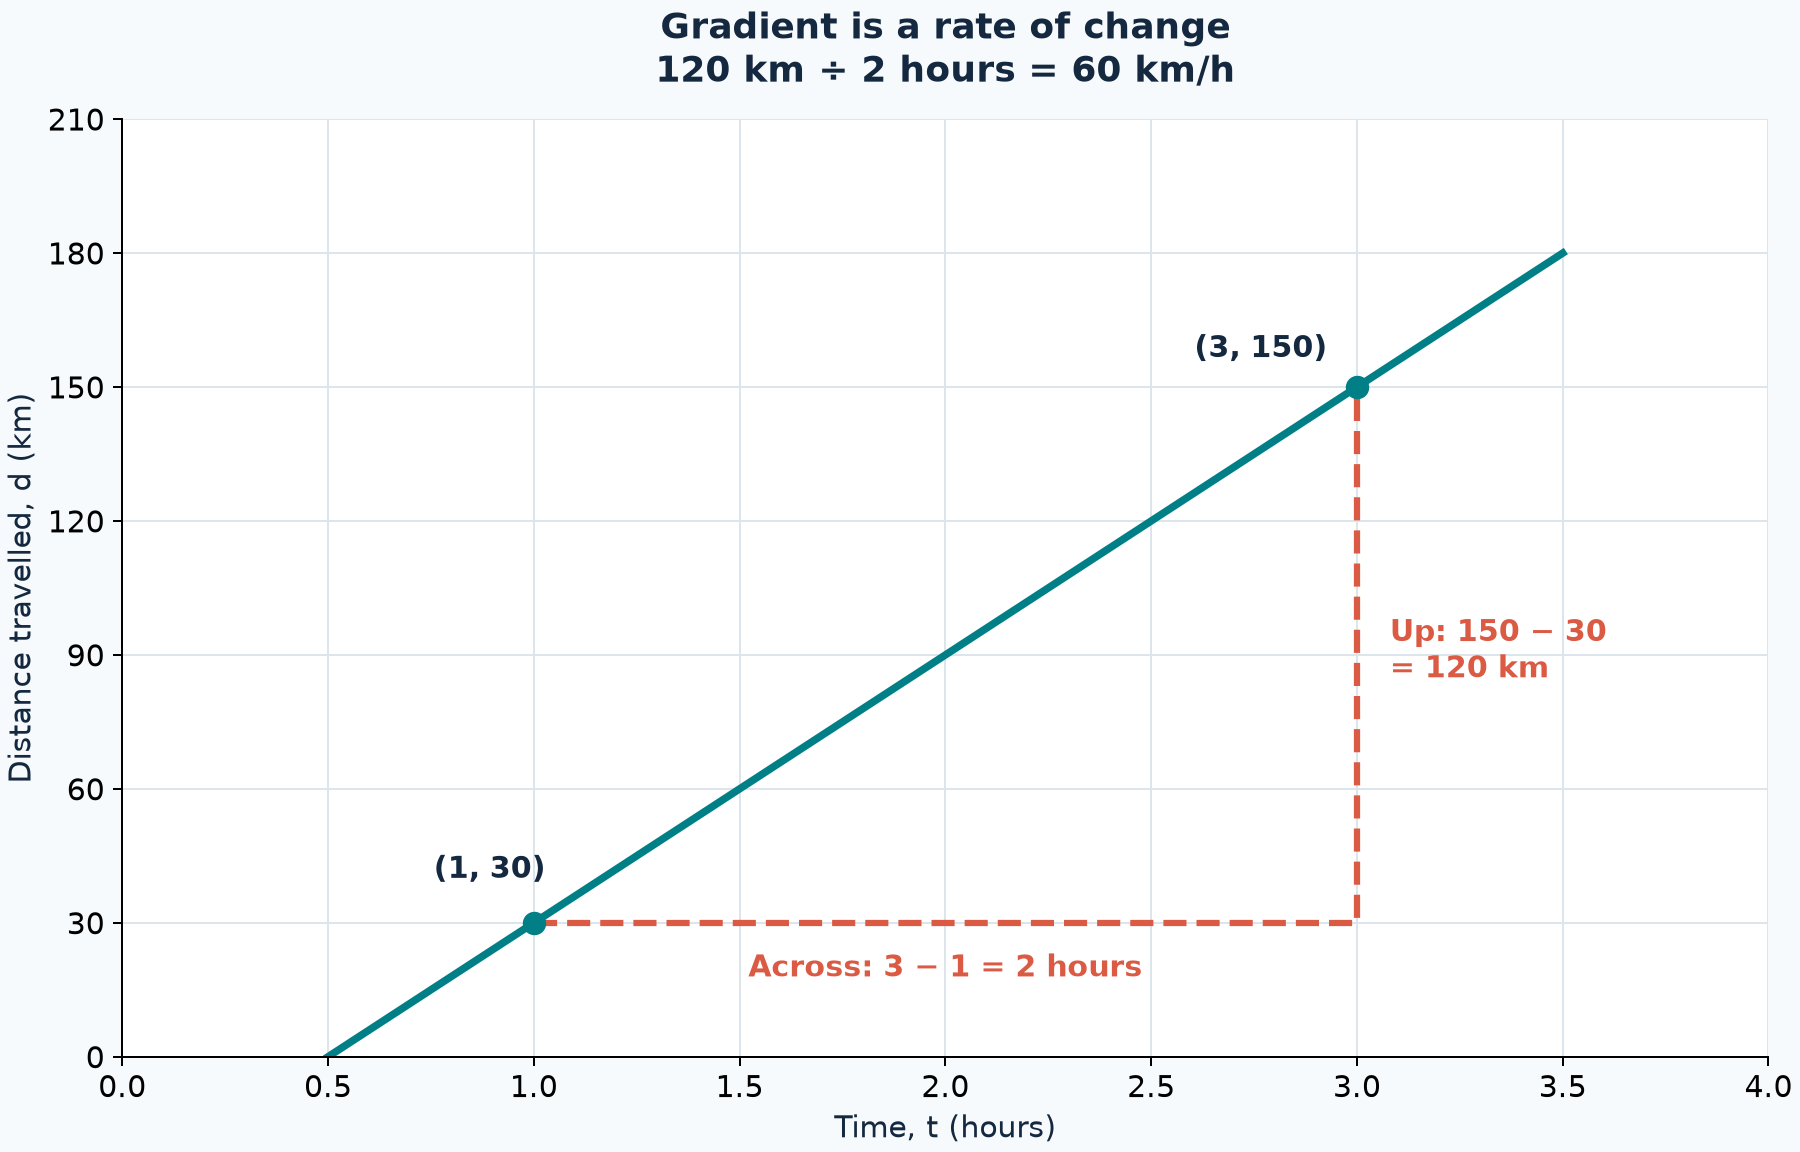
Example: at 1 hour the distance is 30 km; at 3 hours it is 150 km. The vertical change is 150 − 30 = 120 km. The horizontal change is 3 − 1 = 2 hours. Gradient = 120 ÷ 2 = 60 km/h. It describes the rate during this section, not automatically the whole journey.
Why does this work? Every triangle drawn between two points on the same straight line has the same ratio of vertical to horizontal change. Doubling the interval doubles both changes, so their quotient stays constant. Do not use 150 ÷ 3 here: that divides coordinates rather than matched changes and incorrectly assumes the segment starts at the origin.
Cover and recall: without looking at the diagram, state the two subtractions and the division that give 60.
2. Interpret the rate using both axes
A bare gradient of 60 is incomplete when the question asks what it represents. Read the vertical axis first, then the horizontal axis: distance in kilometres per time in hours means kilometres per hour. Cost in pounds against mass in kilograms gives pounds per kilogram. Volume in litres against time in minutes gives litres per minute.
For an increasing distance-travelled graph, a gradient of 60 km/h means the object travels 60 kilometres each hour at that constant speed. For a tank graph, −25 L/min means the amount of water decreases by 25 litres each minute. The negative sign describes the direction of change; the emptying-rate magnitude is 25 L/min.
A horizontal line has zero gradient because the vertical quantity does not change. A vertical line has undefined gradient because its horizontal change is zero, so the calculation would require division by zero. In ordinary time-based models, a vertical segment is not a finite rate of change.
Examiner wording: candidates should name the changing quantity and use the correct unit. An answer such as 'the tank loses 25 litres each minute' links sign, quantity and rate. Credit for a numerical gradient and credit for interpretation are separate in questions that ask both; follow the particular mark scheme rather than assuming a universal tariff.
3. Distance-time graphs: steepness, stops and averages
On a distance-time graph, a straight rising section represents constant speed. A steeper rising section represents a greater speed when the axes and scales are the same. A flat section represents a stop, not slow movement. Do not confuse a higher point with a greater speed: height shows distance, whereas gradient shows rate.

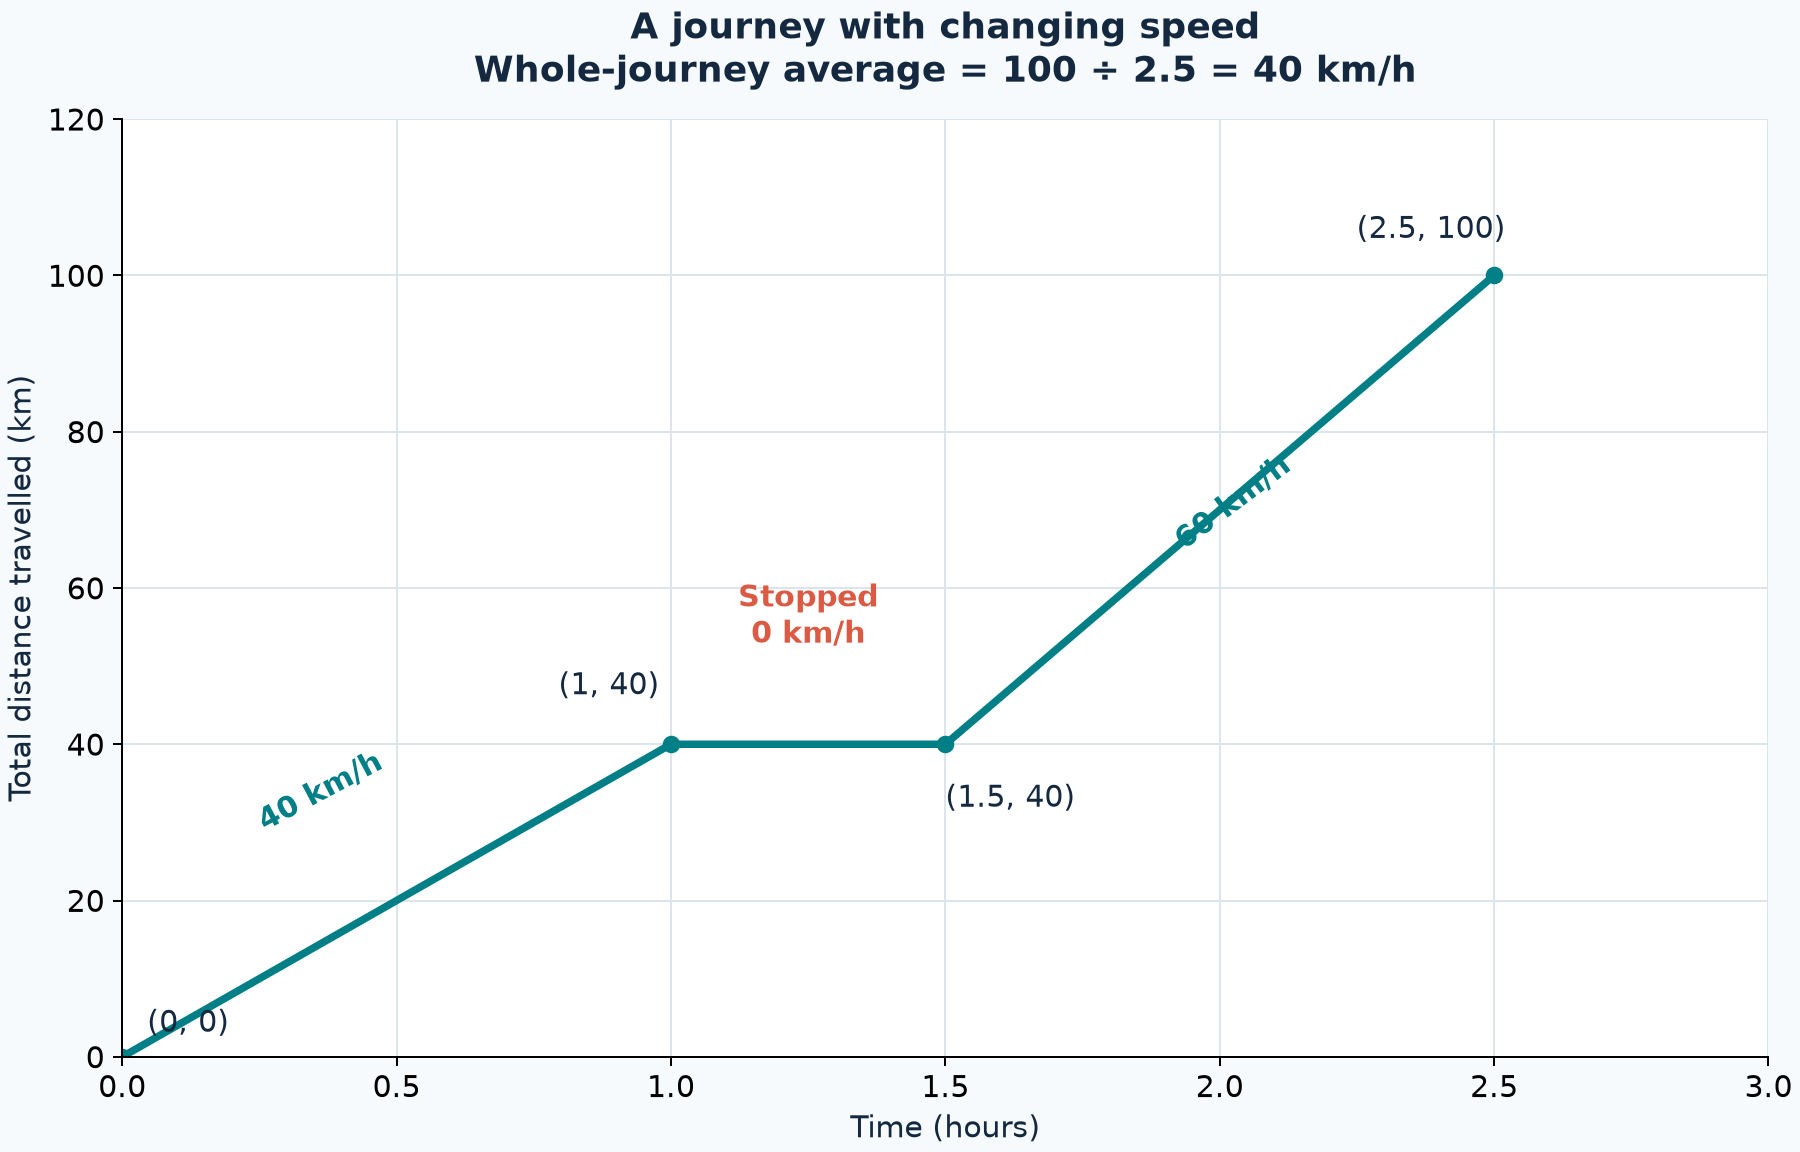
In this journey, the first section rises 40 km in 1 hour, giving 40 km/h. From 1 to 1.5 hours the distance stays at 40 km, so the traveller stops for 0.5 hours. The last section rises from 40 to 100 km in 1 hour, giving 60 km/h. The final section is faster even though the whole-journey average is only 100 ÷ 2.5 = 40 km/h. Include the stop in total elapsed time.
Never take the simple mean of section speeds unless the time spent at each speed is equal and any stopping time is correctly accounted for. Calculate total distance divided by total elapsed time instead.
Check what 'distance' means. Total distance travelled cannot decrease. Distance from a starting point can decrease on a return journey; a downward straight section then means the traveller approaches that point at a constant speed equal to the magnitude of its gradient. Displacement-time graphs have signed velocity rather than unsigned speed. Read the question before interpreting the sign.
What if? If the same journey included a longer stop, total distance would stay unchanged but average speed would decrease.
4. Direct proportion: straight and through the origin
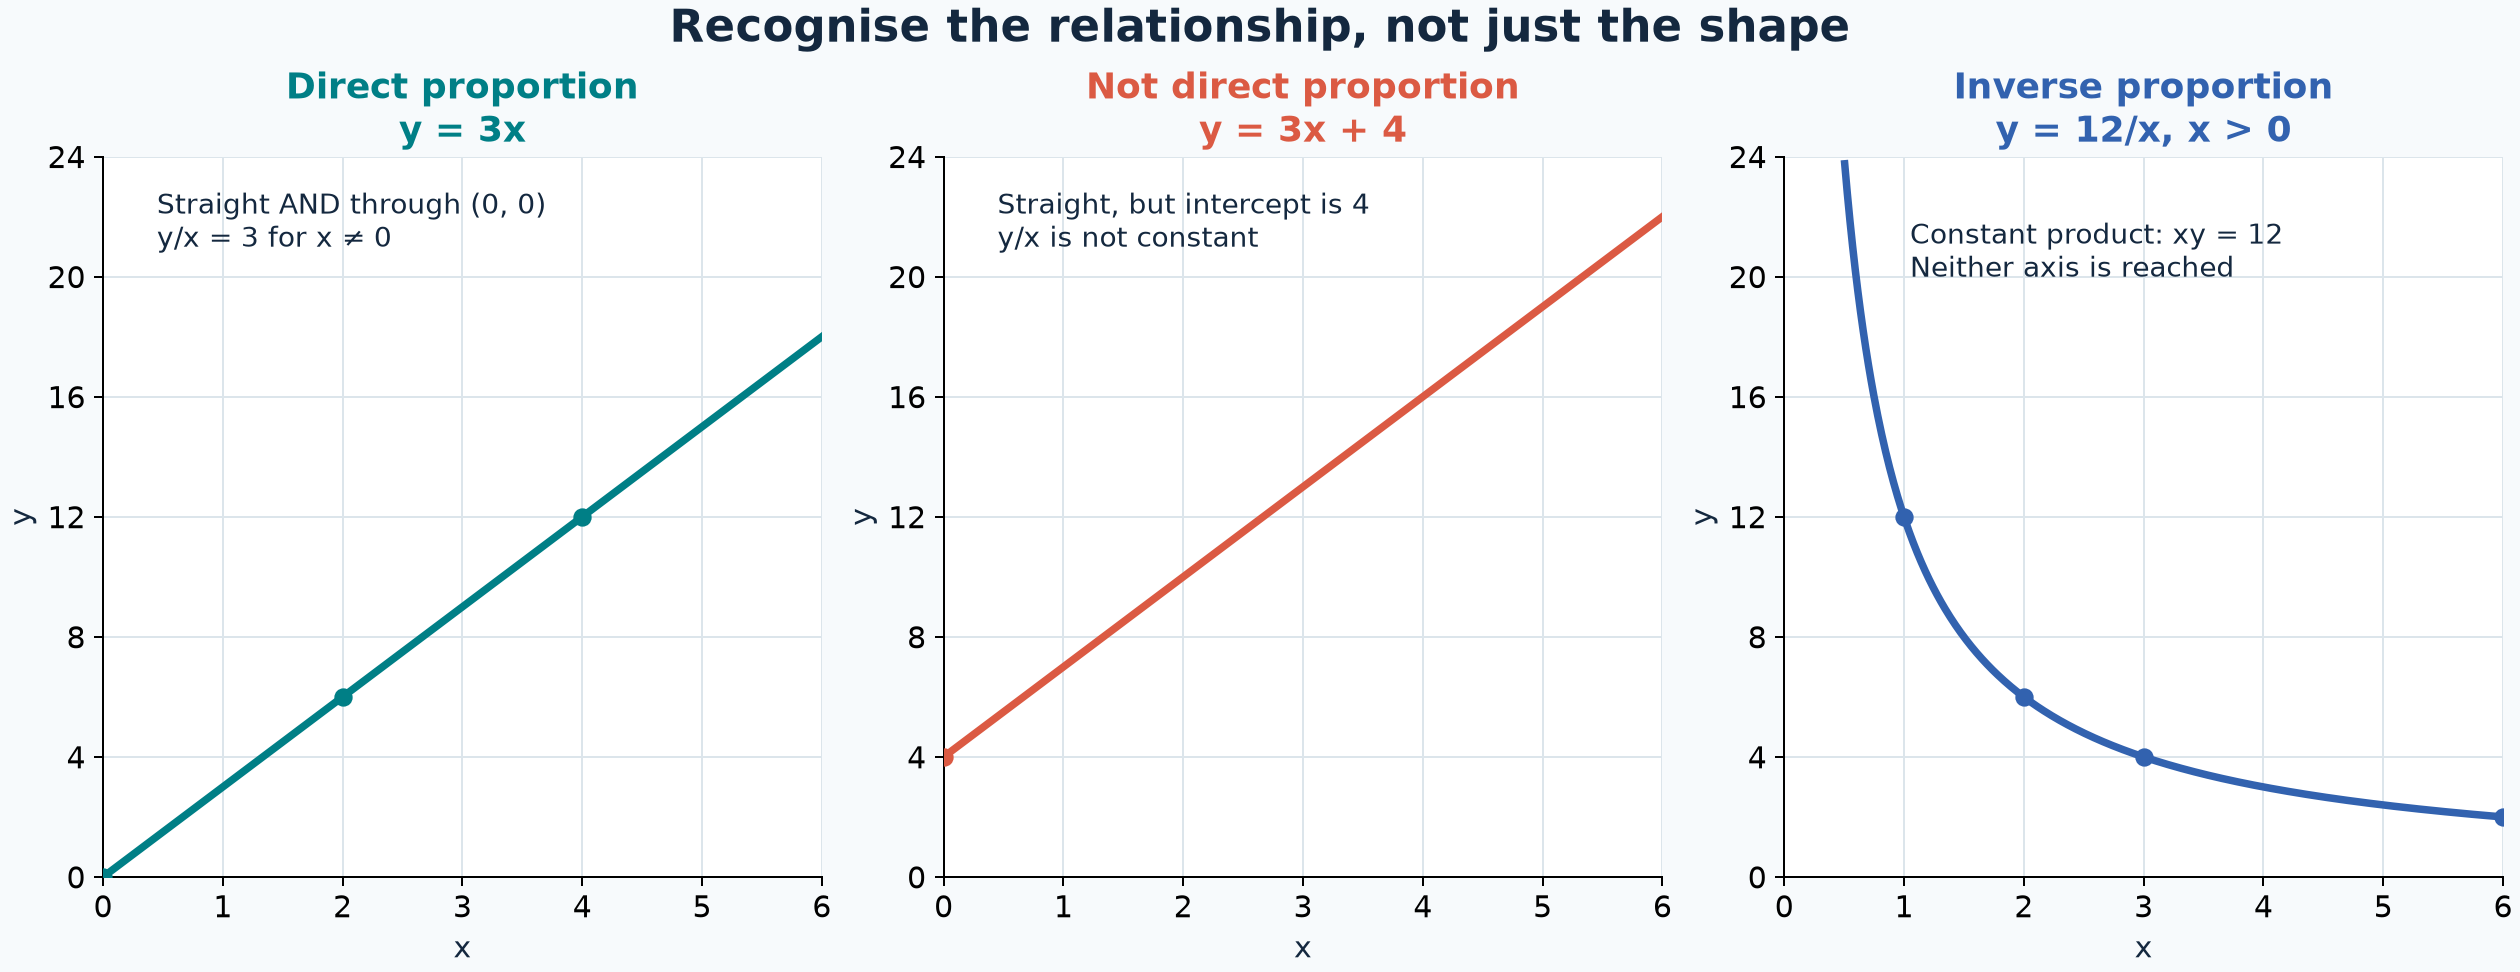
Two quantities are directly proportional when one is a constant multiple of the other: y = kx. For non-zero x, the ratio y/x is constant. If x doubles, y doubles; if x is multiplied by five, y is multiplied by five. The graph is a straight line through the origin, (0, 0). Both features matter.
Example: apples cost £3 per kilogram with no fixed charge. Their cost C is C = 3m, where m is mass in kilograms. The gradient is £3/kg. Two kilograms cost £6 and four kilograms cost £12. At zero mass, the cost is zero, so the graph passes through the origin.
A taxi charging £4 before adding £3 per kilometre has C = 3d + 4. Its graph is straight and its gradient is still £3/km, but the £4 intercept means cost is not directly proportional to distance. Doubling distance from 2 km to 4 km changes cost from £10 to £16, not £20.

To justify direct proportion, write 'It is a straight line through the origin', not simply 'It goes up'. A curve through the origin is not enough either. For a table, compare y/x values at non-zero x, remembering that a limited set of matching values supports a model but does not prove how every unobserved value behaves.
5. Inverse proportion: the product stays constant
For the basic inverse-proportion relationship, y = k/x, with x ≠ 0. Multiplying both sides by x gives xy = k. The product is constant, unlike direct proportion where the quotient is constant. If x doubles, y halves; if x triples, y becomes one third as large.
For positive x and positive k, the curve decreases steeply at first and then flattens. It approaches both axes without reaching them. The graph cannot include x = 0 because division by zero is undefined. It cannot have y = 0 because a positive constant divided by a finite positive number is still positive.
Example: a fixed task needs 48 worker-hours. If identical workers contribute at the same constant rate without interfering with one another, six workers take 8 hours and twelve workers take 4 hours. In each case workers × hours = 48. The model depends on those assumptions: real projects may not speed up perfectly when more people join.
Do not classify every decreasing curve as inverse proportion. Check the relationship y = k/x or the constant-product test. A straight decreasing line such as y = 12 − x has a negative gradient but is not inverse proportion. Here 'one increases while the other decreases' is necessary for the positive inverse model, but insufficient evidence on its own.
Why? Explain to a partner why a fixed product forces one quantity to shrink when the other grows.
Mathematical Relationships
Formula-sheet status and symbols
The topic formulas below are Must memorise: they are not printed on Pearson's published 2026 Foundation or Higher supplementary formulae sheets. That includes the speed formula. A particular question may supply a relationship, but candidates must not rely on this. Check the official sheet for your own examination series. 3 4
- Must memorise: gradient m = Δy/Δx = (y₂ − y₁)/(x₂ − x₁), where Δ means 'change in' and x₂ ≠ x₁. Gradient units = vertical-axis units per horizontal-axis unit.
- Must memorise: y = mx + c, where m is gradient and c is the y-intercept. For a constant-rate context, vertical quantity = rate × horizontal quantity + initial value, while the model remains valid.
- Must memorise: direct proportion y = kx and k = y/x for x ≠ 0. Here k is the constant of proportionality and the gradient.
- Must memorise: inverse proportion y = k/x and k = xy, with x ≠ 0. In this guide's positive contexts, k > 0 and x > 0. Unlike direct proportion, k is not the curve's gradient.
- Must memorise: average speed v = total distance d / total elapsed time t; rearrangements d = vt and t = d/v apply with consistent units. On an individual straight distance-time section, speed = Δd/Δt.
- Must memorise: hours = minutes/60; minutes = seconds/60; metres = kilometres × 1000; m/s = km/h ÷ 3.6; km/h = m/s × 3.6.
None of these listed relationships is labelled 'Given on formula sheet', because neither verified supplementary sheet contains them. Other supplied formulas, such as Pythagoras' theorem, are not needed for this topic.
Conversions that protect marks
One hour 30 minutes is 1 + 30/60 = 1.5 hours, not 1.30 hours. For a 90 km journey, 90 ÷ 1.5 = 60 km/h. If axes use minutes, a numerical gradient may initially be in km/min; multiply by 60 to express that rate in km/h.
To convert 72 km/h to m/s, use 72 × 1000 ÷ 3600 = 20 m/s. The factor 3.6 comes from 3600 seconds per hour divided by 1000 metres per kilometre. Explain the direction if unsure: the numerical value in metres per second is smaller than in kilometres per hour.
Graph and Data Skills
When plotting, put the independent quantity, usually time, on the horizontal axis. Label both axes with quantities and units, use consistent numerical intervals, and plot coordinates in the order (horizontal, vertical). Use a ruler for a straight-line model. For y = k/x, plot several non-zero x values and draw a smooth curve, not straight chords, unless instructed otherwise. Do not invent a point at x = 0.
When reading a graph, project to the labelled scales. Distinguish an exact plotted point from an estimate; use graph-reading tolerances only where the examination allows them. When comparing different graphs, calculate the rates rather than judging the apparent angles, since scale changes can alter visual steepness without changing the underlying relationship.
Exam Focus and Tier Boundaries
R14 is assessed at both Foundation and Higher tiers. Recognition of direct and inverse graphs, straight-line gradients, and interpreting supplied basic relationships belong in this shared topic. Pearson teaching guidance allows Foundation interpretation of proportion to x or 1/x. Constructing direct- or inverse-proportion equations is a Higher-only extension under R13; interpreting or using a supplied equation is not automatically Higher-only. Tangent gradients and instantaneous rates are Higher-only R15 and are outside this guide's main scope. 1 2
Pearson papers each last 90 minutes and carry 80 marks, giving a paper-wide average of 1.125 minutes per mark. As a practical target, allow about 3–4 minutes for 3 marks and 6–7 minutes for 6 marks, while reserving checking time. This is pacing advice, not a rule imposed by the examiner. Paper 1 is non-calculator; Papers 2 and 3 allow calculators. 1
An official example of method credit is June 2024 Paper 1F Question 25(a): its 3-mark line-equation scheme includes a method route using (6 − 3)/(2 − 0), followed by equation construction and accuracy credit. This does not mean every gradient question is worth 3 marks. June 2023 Paper 3H Question 17(b) awards C1 for interpreting a gradient as speed or velocity; part (a) is a Higher tangent question, not a technique required here. All worked and practice questions in this resource are original Edexcel-style questions with clearly identified indicative teaching mark allocations. 5 6
Practical Applications and Active Revision
Use distance-time graphs to compare travel speeds, cost-mass graphs to compare unit prices, and volume-time graphs to describe filling or emptying rates. Use inverse proportion for fixed-distance travel time versus speed, or fixed work versus the number of equally productive workers. State assumptions before extending a model: a tariff may change, a tank may empty non-linearly, or workers may obstruct one another.
There is no required practical attached to this GCSE Mathematics topic. An optional learning activity is to record distances for a constant-speed toy vehicle, plot distance against time, and explain its gradient. Measurement scatter does not change the mathematical definition; use the stated model or suitable line when asked.
Before revealing solutions, attempt the practice questions and explain one answer aloud. Revisit a missed question tomorrow and again after a few days, solving it from memory rather than rereading its solution. Use the diagrams to support recall, then cover them and sketch the relationships yourself.
Ten-minute tutor podcast
Listen actively: calculate the examples mentally, answer the quick-fire questions before the tutor does, and pause playback whenever you need more thinking time. The episode follows introduction 0:00–1:00, core concepts 1:00–6:00, exam technique 6:00–8:00, recall quiz 8:00–9:00 and summary 9:00–10:00.
References
Visual Resources
3 diagrams and illustrations
](https://xnnrgnazirrqvdgfhvou.supabase.co/storage/v1/render/image/public/study-guide-assets/guide_8a09a24b-6a00-42f0-b450-3518dc666848/gradient_rate_diagram.png?width=800&format=webp&resize=cover&quality=80)
](https://xnnrgnazirrqvdgfhvou.supabase.co/storage/v1/render/image/public/study-guide-assets/guide_8a09a24b-6a00-42f0-b450-3518dc666848/proportion_graphs.png?width=800&format=webp&resize=cover&quality=80)
](https://xnnrgnazirrqvdgfhvou.supabase.co/storage/v1/render/image/public/study-guide-assets/guide_8a09a24b-6a00-42f0-b450-3518dc666848/distance_time_journey.png?width=800&format=webp&resize=cover&quality=80)

Interactive Diagrams
2 interactive diagrams to visualise key concepts
Conceptual Flow Outline
The complete gradient-to-context method. The same two points and subtraction order must be used for both changes.
Conceptual Flow Outline
Recognising direct and basic positive inverse proportion. Confirm the relationship rather than relying on a graph merely rising or falling.
Worked Examples
4 worked examples — open one to explore the question and available guidance.
Practice Questions
Try the question, then reveal an answer plan or example response
Is y = 5x a direct proportion? Give one reason.
Hint: Direct proportion has the form y = kx.
A cyclist travels 90 km in 1 hour 30 minutes at a constant speed. Calculate the speed in km/h.
Hint: Convert 30 minutes to a fraction of an hour before dividing distance by time.
The graph of y = 3x + 4 is a straight line. Explain why it is not a direct proportion graph. State its y-intercept and state what would need to change for the equation to represent direct proportion.
Hint: A direct proportion graph must pass through (0,0).
y is directly proportional to x. When x = 4, y = 14. (a) Find the constant of proportionality. (b) Higher extension: write an equation connecting y and x. (c) Find y when x = 12. (d) Find x when y = 28.
Hint: Use y = kx and the known pair of values first.
Original Edexcel-style question [5 marks]. The supplied inverse relationship is xy = 40, with positive x and y. (a) Find y when x = 5. (b) Find y when x = 16. (c) Calculate y when x = 10 and explain its change relative to part (a). (d) Describe the graph and state whether it meets either axis. This uses a supplied basic relationship and is not automatically Higher-only.
Hint: Use y = 40/x. Doubling x halves y.
Original Edexcel-style question [6 marks]. For a fixed job, the supplied relationship is wh = 48, where w is the number of workers and h is the time in hours. (a) Explain why this is inverse proportion. (b) Rearrange the supplied equation to make h the subject. (c) Find the time for 6 workers. (d) Find the time for 12 workers. (e) State two assumptions needed for the worker model. Rearranging this supplied equation is not the same as constructing a proportion equation from a verbal statement.
Hint: A fixed product means more workers need less time. Think about productivity and interference.
Original Edexcel-style question [5 marks]. A distance-time graph joins (0 h, 0 km), (1 h, 40 km), (1.5 h, 40 km) and (2.5 h, 100 km) with straight sections. (a) Calculate the speed during the first section. (b) State how long the stop lasts. (c) Calculate the speed during the final section. (d) Calculate the whole-journey average speed.
Hint: Use matching changes for each moving section and total elapsed time for the average.
Exam technique
How to turn what you know into marks
How to approach the question
Read the command word and mark allocation. Identify the two axis quantities and units. Select clear, well-separated points on the stated straight line, work out matching changes, divide vertical by horizontal, then answer the requested interpretation. For proportion, test straight-plus-origin or constant quotient for direct proportion; test a constant product or y = k/x for basic inverse proportion. Do not infer a relationship from a vague shape description alone.
How to structure your answer
For a 1-mark identification, give the requested relationship or reason precisely. For a 2- or 3-mark calculation, show the selected changes, division and result; add units as requested. For a combined 4- to 6-mark question, separate each part, show each calculation, and include the contextual explanation or modelling assumption requested. Marks depend on the actual scheme. All examples and practice questions below are original Edexcel-style material with author-created indicative allocations, not reproduced official Pearson tariffs. M denotes method, A accuracy, B an independent mark and C communication or reasoning in Pearson schemes.
Timing
Pearson 1MA1 papers have 80 marks in 90 minutes: a paper-wide average of 1.125 minutes per mark. Aim for about 3–4 minutes for 3 marks and 6–7 minutes for 6 marks, allowing checking time. This is revision pacing advice, not an official time allocation for individual questions.
Common pitfalls
- Counting squares without reading the scales. Write the two changes using axis values before dividing.
- Calculating across/up instead of up/across. Write Δy/Δx first to prevent the reciprocal error.
- Subtracting coordinates in opposite orders. Use the same point order for numerator and denominator.
- Using y/x on a line that does not pass through the origin. General gradient uses differences between two points.
- Calling every straight line direct proportion. Check that its y-intercept is zero.
- Calling every decreasing curve inverse proportion. Verify xy is constant or the supplied equation is y = k/x.
- Giving only a number when asked to interpret. Name the quantity and unit, including whether it increases or decreases.
- Treating 1 hour 30 minutes as 1.30 hours. Convert the minutes using division by 60.
- Averaging section speeds rather than total distance/total elapsed time. Include stopping time.
- Describing a negative gradient as negative speed without checking the axis label. Distance from a point can decrease, while total distance travelled cannot.
What the command words want
- Compare
- Use a direct comparison and evidence: the final section is faster because its gradient is 60 km/h rather than 40 km/h. Do not merely list two disconnected values.
- Explain
- Give a mathematical reason using 'because': it is not direct proportion because its straight line does not pass through the origin. Do not rely on 'it goes up' or 'it goes down'.
- Describe
- Say how the plotted quantity changes: for example, distance is constant between 1 and 1.5 hours, so the traveller is stationary.
- Evaluate
- In GCSE Maths, 'evaluate' normally means find the numerical value of an expression. It does not normally require an essay weighing both sides.
- Interpret
- Translate the mathematical result into the situation: −25 L/min means the volume decreases by 25 litres each minute.
- Show that
- Provide a logical sequence of working that reaches the stated result. Repeating the given answer is insufficient.
- State/Give
- Provide the requested value, relationship or concise factual statement. Include a unit when the requested answer is a contextual rate.
- Sketch/Draw
- Sketch the correct overall shape and essential features; for an accurate drawn graph use the stated scale and plot points carefully. Direct proportion must pass through the origin; the positive inverse curve must not cross either axis.
- Calculate/Work out
- Show the relevant substitution or matching changes, perform the calculation, and state the result with appropriate units and sign.
Watch or listen (optional)
Test your understanding of Ratio, proportion and rates of change: interpret the gradient of a straight line graph as a rate of change; recognise and interpret graphs that illustrate direct and inverse proportion
Active recall beats re-reading. Take an instant quiz now to test what you’ve learned and lock it into long-term memory.
7 days Premium · Then the free plan continues · No card, no charge