Subject: Mathematics | Level: GCSE | Exam Board: Pearson
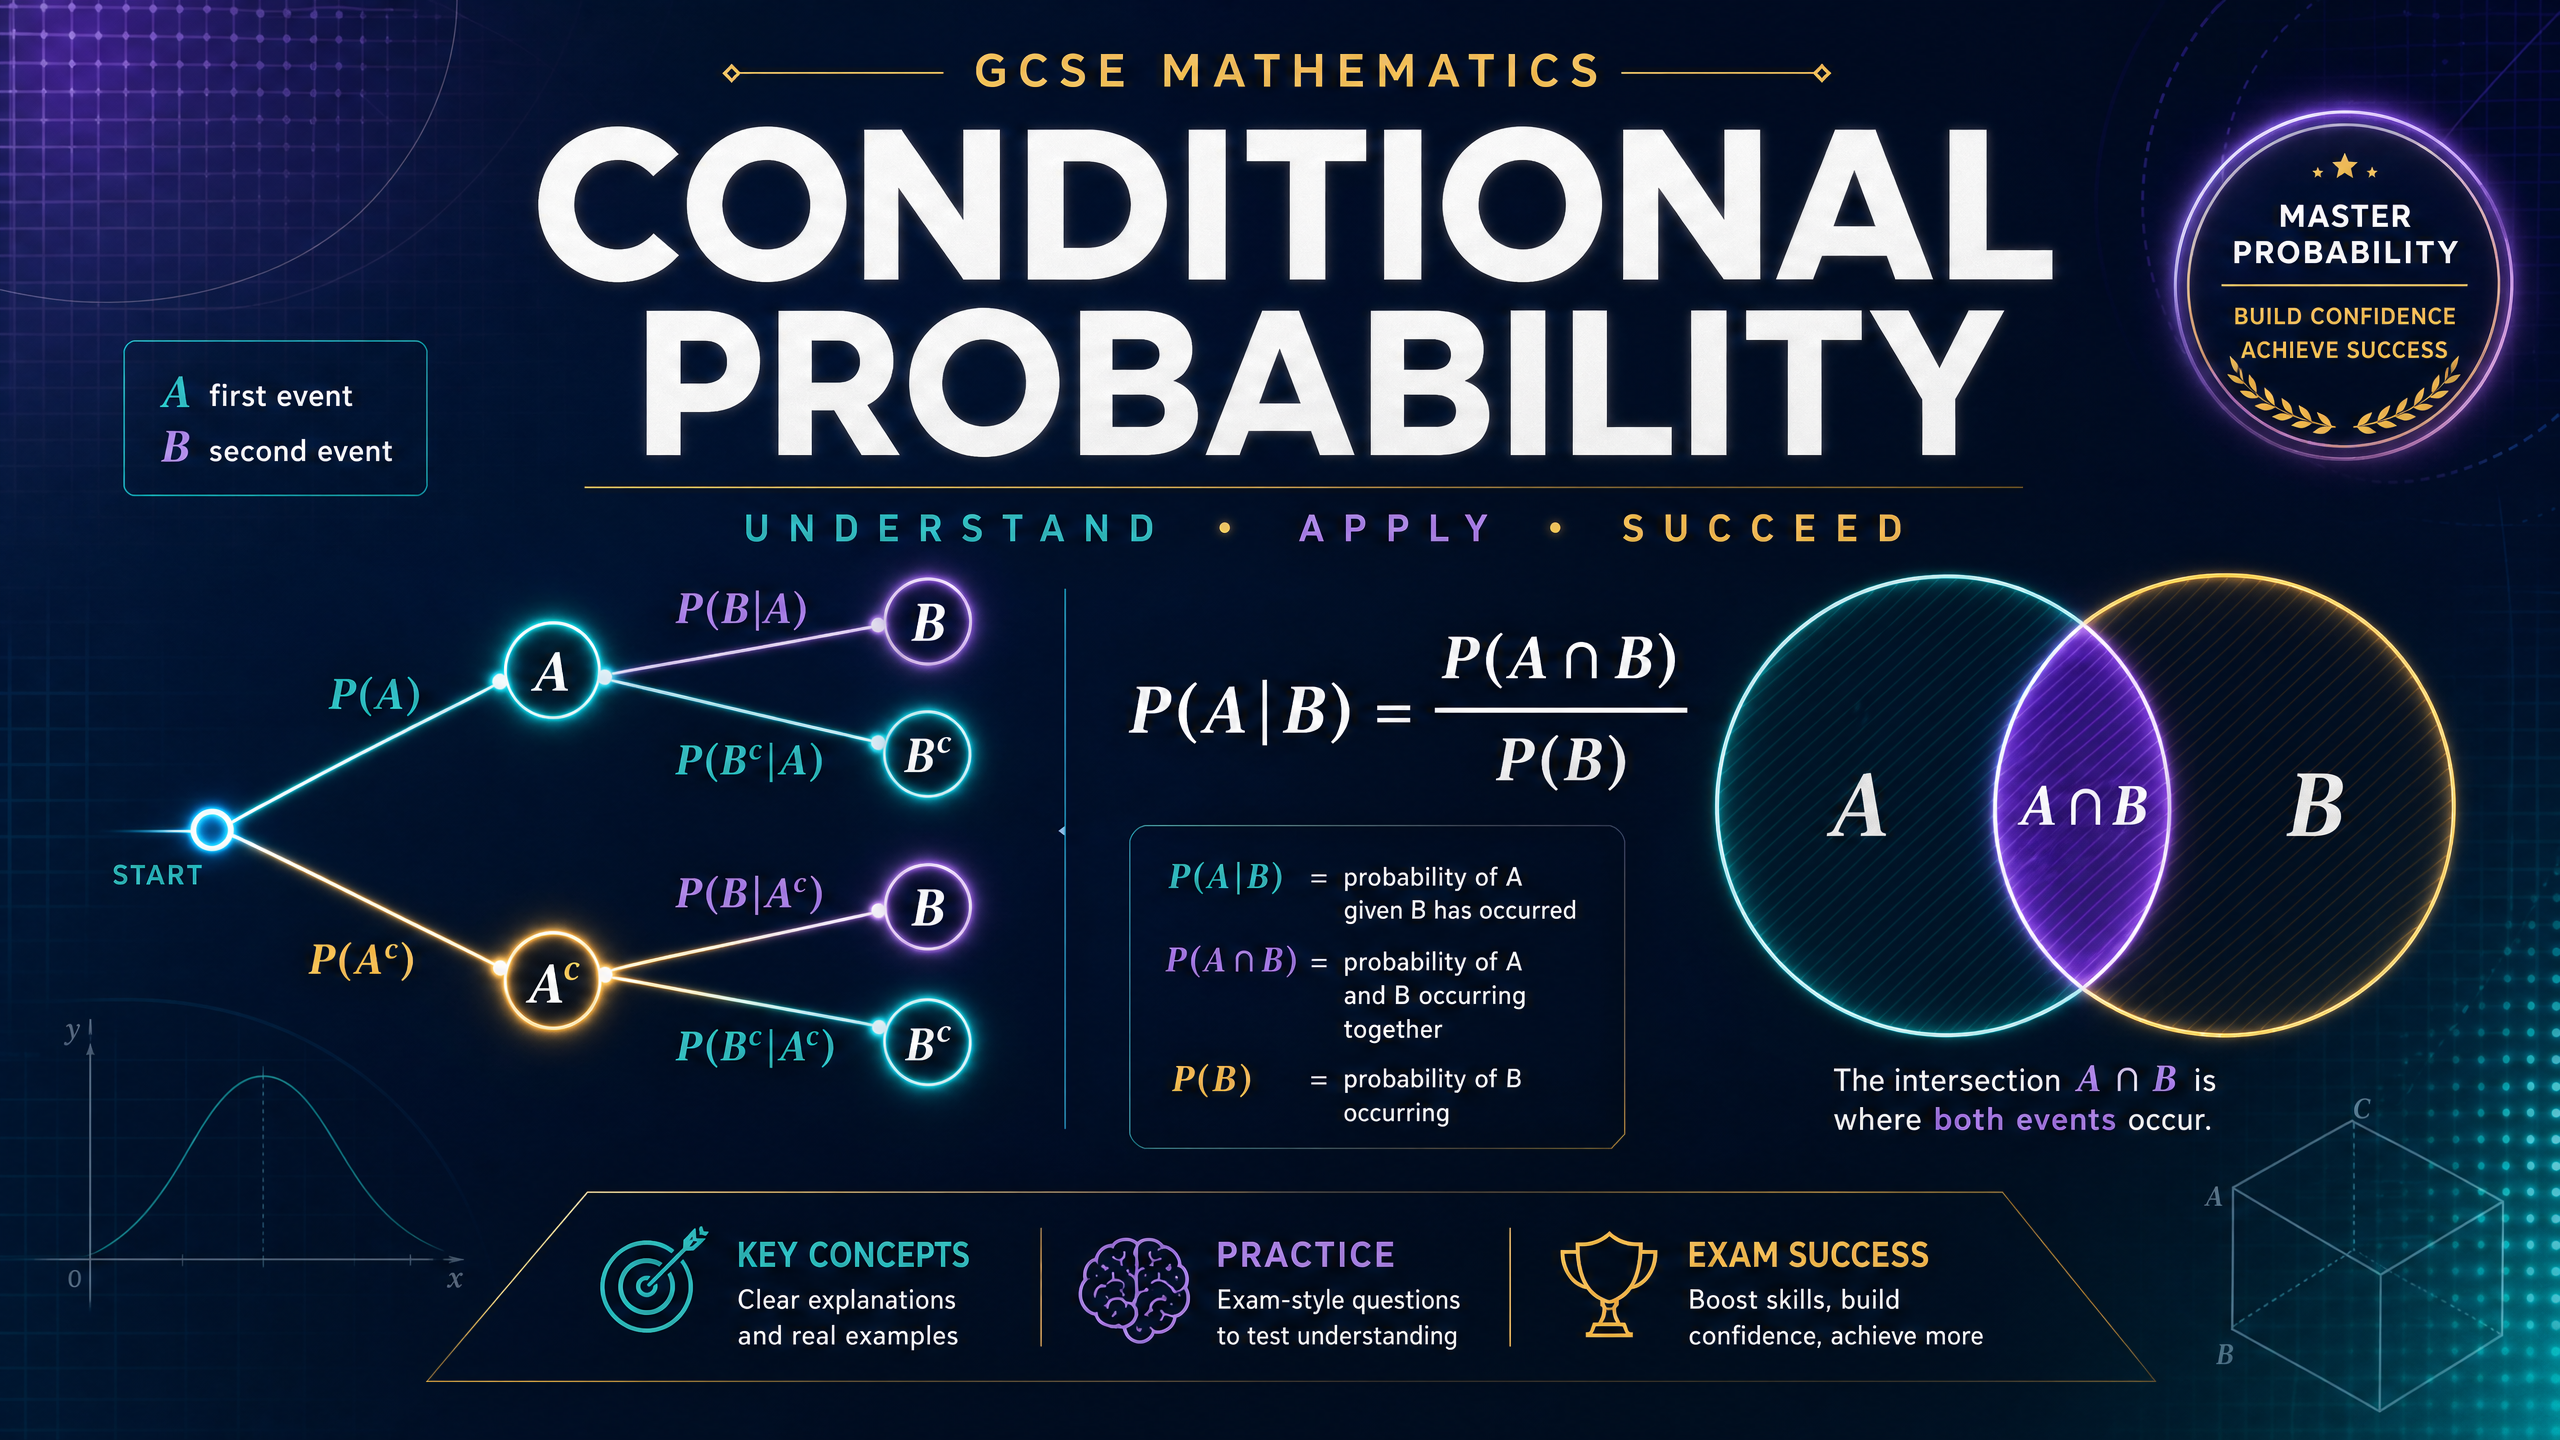
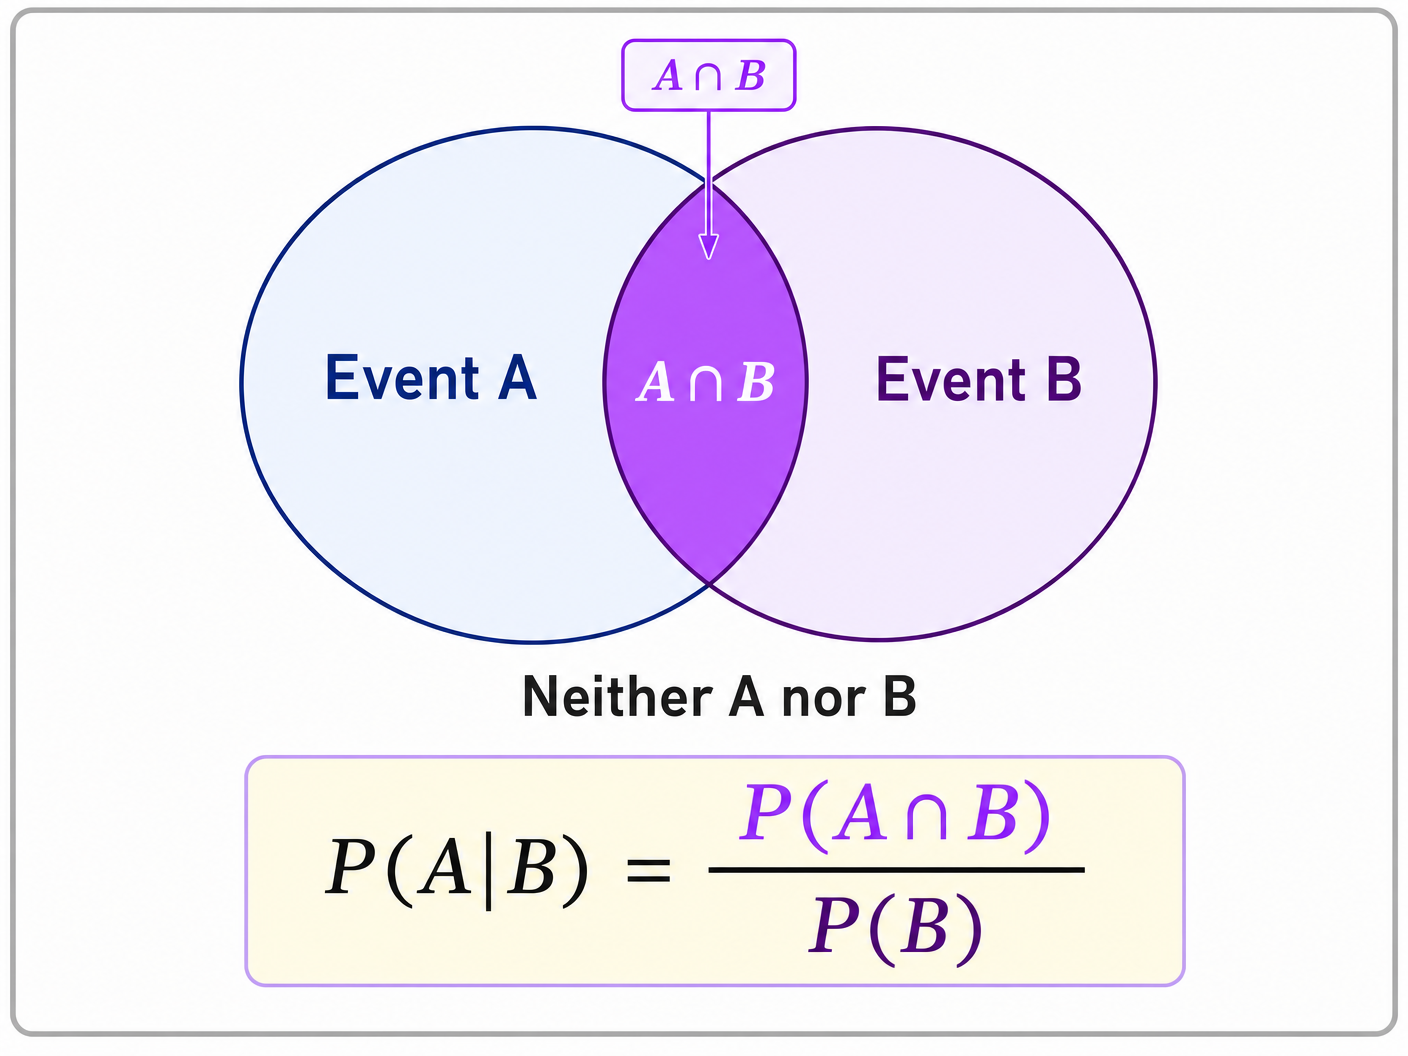
Conditional Probability asks 'what is the chance of this happening, given that something else already has?' It's a high-value topic that separates top-tier candidates, requiring you to master tree diagrams, Venn diagrams, and the crucial formula P(A|B) = P(A∩B)/P(B).
Revision Notes & Key Concepts
Revision Podcast Transcript
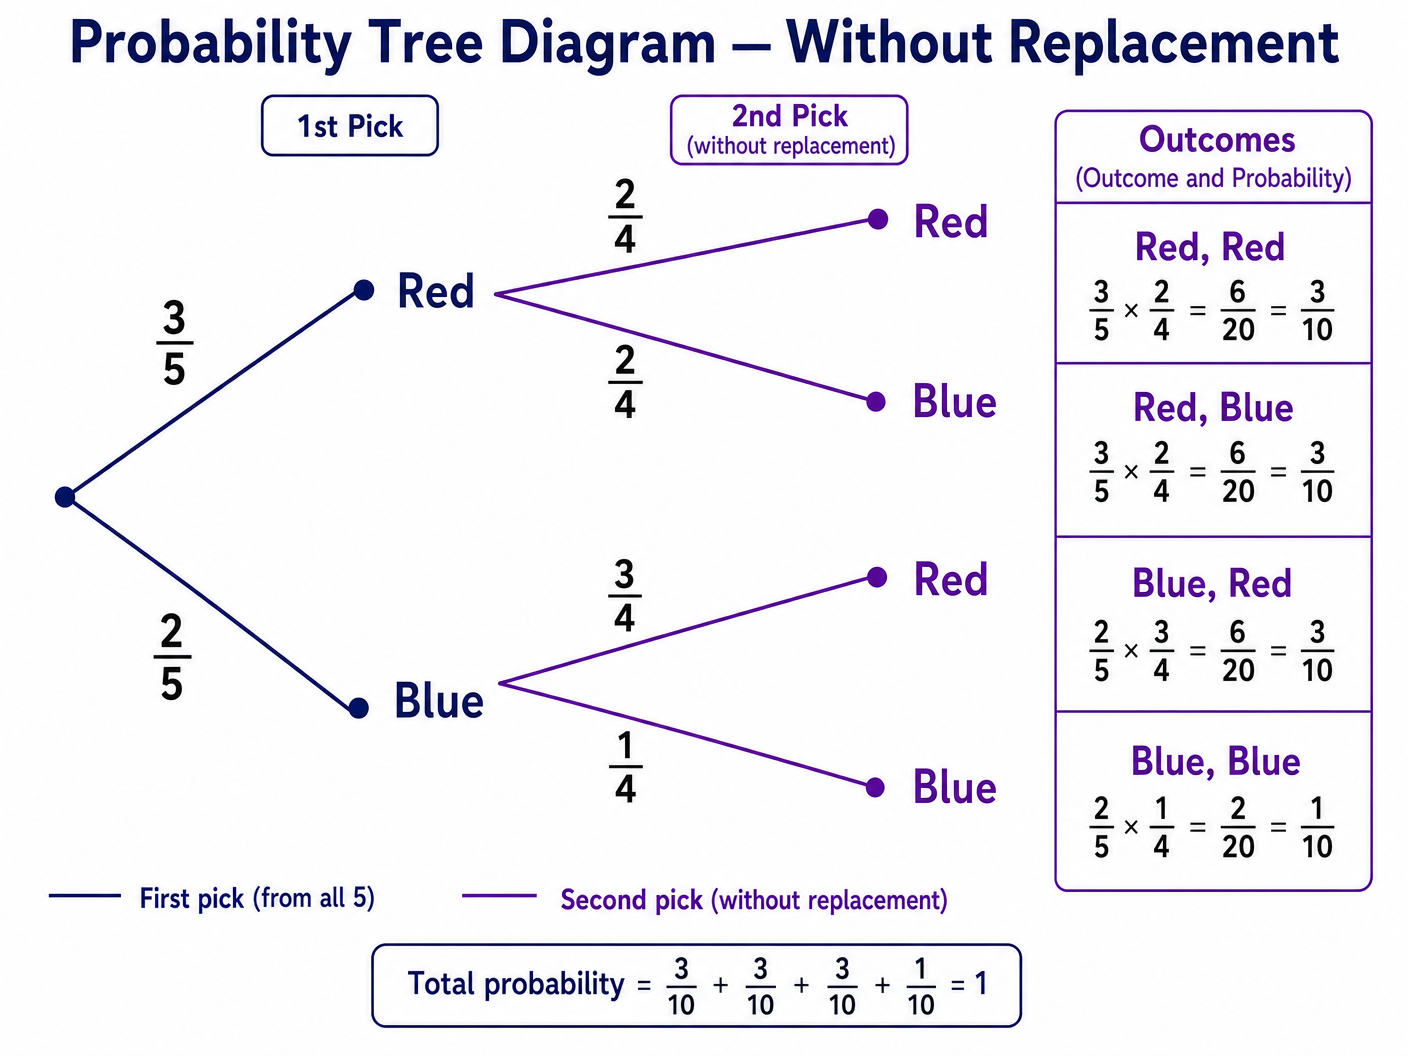
Welcome to your GCSE Maths revision podcast. I'm your tutor, and today we're diving deep into one of the most interesting — and most frequently examined — topics in the probability unit: Conditional Probability. Whether you're sitting AQA, Edexcel, or OCR, this topic appears in the Higher tier papers and is absolutely worth mastering. So grab a pen and paper, because we're going to work through this together. Let's start with the big question: what actually is conditional probability? Imagine you're picking a card from a deck. The probability of getting an Ace is 4 out of 52 — straightforward. But now imagine I've already told you that the card is a red card. Suddenly, your sample space has changed. You're no longer thinking about all 52 cards — you're only thinking about the 26 red ones. The probability of getting an Ace, given that it's red, is now 2 out of 26, which simplifies to 1 over 13. That word "given" is the key. Conditional probability is the probability of one event happening, given that another event has already occurred. The condition changes the sample space, and that changes the probability. Once you understand that idea, everything else falls into place. Now let's look at the notation. In mathematics, we write conditional probability as P of A given B, using a vertical bar to mean "given". So P open bracket A vertical bar B close bracket means "the probability of A, given that B has occurred." The formula that connects this to other probabilities is: P of A given B equals P of A intersection B, divided by P of B. Let's unpack that. P of A intersection B — that's the probability that both A and B happen. And P of B is just the probability that B happens. So you're essentially asking: out of all the times B happens, how often does A also happen? This formula is Higher tier content, and examiners will absolutely test whether you can apply it correctly. Write it down now: P of A given B equals P of A intersection B divided by P of B. Right, let's move on to the three main tools you'll use to solve conditional probability problems: tree diagrams, Venn diagrams, and two-way tables. Starting with tree diagrams. A probability tree is a branching diagram where each branch represents a possible outcome, and the probability is written along the branch. The key rule is: probabilities on branches coming from the same point must add up to 1. Here's where conditional probability comes in. In a "without replacement" problem — for example, picking two counters from a bag without putting the first one back — the second set of branches changes depending on what happened on the first branch. Those second-branch probabilities are conditional probabilities. They are the probability of the second event, given what happened first. Let's work through an example. A bag contains 3 red counters and 2 blue counters. Two counters are picked without replacement. What is the probability that both counters are red? On the first pick, there are 5 counters total. So P of red equals 3 over 5, and P of blue equals 2 over 5. Now, if the first counter was red, there are now 4 counters left — 2 red and 2 blue. So on the second branch from "red first", P of red given red first equals 2 over 4, which is 1 over 2. And P of blue given red first equals 2 over 4, also 1 over 2. If the first counter was blue, there are 4 counters left — 3 red and 1 blue. So P of red given blue first equals 3 over 4. And P of blue given blue first equals 1 over 4. To find the probability of both counters being red, we multiply along the branches: 3 over 5 times 2 over 4, which gives 6 over 20, simplifying to 3 over 10. Always multiply along branches, and add across branches when you want the probability of different routes to the same outcome. Now let's talk about Venn diagrams. A Venn diagram shows two or more overlapping circles inside a rectangle. The rectangle represents the entire sample space — everything that can happen. Each circle represents an event. The overlapping region — the intersection — represents outcomes where both events occur. When you're using a Venn diagram for conditional probability, the key insight is this: when you're told that event B has occurred, you restrict your attention to the circle for B. You ignore everything outside that circle. Then you ask: within B, what proportion also falls in A? That proportion is P of A given B. For example, suppose 30 students were surveyed about whether they study French or Spanish. 18 study French, 15 study Spanish, and 8 study both. How many study neither? Total in circles: 18 plus 15 minus 8 equals 25. So 30 minus 25 equals 5 students study neither. Now, if a student is chosen at random from those who study Spanish, what is the probability they also study French? We're restricting to the 15 who study Spanish. Of those, 8 also study French. So P of French given Spanish equals 8 over 15. See how the condition — "given they study Spanish" — restricts the sample space to just those 15 students? That's the core idea. Two-way tables work in a very similar way. A two-way table organises data into rows and columns, with totals along the edges. When you're given a condition, you find the relevant row or column total and use that as your new denominator. For example, a table shows 200 people surveyed about exercise habits and diet. The row for "exercises regularly" has a total of 80. Within that row, 60 also "eat healthily". So P of eats healthily given exercises regularly equals 60 over 80, which simplifies to 3 over 4. The pattern is always the same: the condition tells you which row or column to focus on, and the total for that row or column becomes your new denominator. Now let's spend some time on exam tips and the most common mistakes candidates make. Mistake number one: confusing P of A given B with P of B given A. These are not the same thing. P of A given B asks "given B happened, what's the chance of A?" P of B given A asks the reverse. In the formula, the event after the vertical bar — the condition — always goes on the bottom of the fraction. So P of A given B has P of B on the bottom. P of B given A has P of A on the bottom. Get this the wrong way round and you'll lose marks even if your arithmetic is perfect. Mistake number two: forgetting to adjust the denominator in without-replacement problems. When you draw a tree diagram for picking without replacement, the total number of items decreases after the first pick. If you keep using the original total on the second set of branches, you'll get the wrong probabilities. Always check: has the total changed? Has the number of the specific item changed? Mistake number three: misreading Venn diagram regions. The intersection — the overlap — is counted in both circles. If you're asked for P of A only, that's the part of circle A that does not overlap with B. If you're asked for P of A intersection B, that's just the overlap. If you're asked for P of A union B, that's everything in either circle — but don't double-count the intersection. Mistake number four: not checking that probabilities sum to 1. On a tree diagram, branches from any single point must sum to 1. If they don't, you've made an error. This is a quick self-check that can save you marks. Exam tip number one: always draw a diagram. Even if the question doesn't ask for one, sketching a tree diagram or Venn diagram helps you organise the information and spot the conditional relationships. Examiners often award method marks for a correct diagram even if the final answer is wrong. Exam tip number two: look for the command word. "Calculate" means show your working and give a numerical answer. "Show that" means you must demonstrate the result step by step — don't just state it. "Hence" means use your previous answer in the next part. Exam tip number three: when using the formula P of A given B equals P of A intersection B divided by P of B, make sure you've identified both values correctly before substituting. Write the formula first, then substitute — this earns method marks even if you make an arithmetic error. Now let's do a quick-fire recall quiz. I'll ask a question, pause briefly, then give the answer. Try to answer before I do. Question one: What does P of A given B mean in words? ... It means the probability of A occurring, given that B has already occurred. Question two: Write the formula for conditional probability. ... P of A given B equals P of A intersection B divided by P of B. Question three: In a tree diagram for picking without replacement, what changes on the second set of branches? ... Both the total number of items and possibly the number of the specific item decrease by one. Question four: In a Venn diagram, what region represents A intersection B? ... The overlapping region — the part that is inside both circles. Question five: If P of A intersection B equals 0.12 and P of B equals 0.4, what is P of A given B? ... 0.12 divided by 0.4 equals 0.3. How did you do? If any of those caught you out, go back and review that section. Let's wrap up with a quick summary of everything we've covered today. Conditional probability is the probability of one event occurring, given that another has already occurred. The condition restricts the sample space. The key formula is P of A given B equals P of A intersection B divided by P of B. The condition — B — always goes on the denominator. The three main tools are: tree diagrams, where you multiply along branches and add across branches; Venn diagrams, where the condition restricts you to one circle; and two-way tables, where the condition restricts you to one row or column. The most common mistakes are: swapping A and B in the formula; forgetting to adjust for without-replacement; and misreading Venn diagram regions. Always draw a diagram, check your probabilities sum to 1, and show your working clearly. This is a topic that rewards practice. The more questions you work through, the more confident you'll become at spotting which tool to use and how to set up the calculation. Past paper questions on conditional probability are excellent practice — work through them systematically, check your answers against the mark scheme, and learn from any mistakes. You've got this. Good luck in your exams, and keep revising!
Key Terms & Definitions
- Conditional Probability
- The probability of an event occurring given that another event has already occurred.
- Sample Space
- The set of all possible outcomes of an experiment.
- Independent Events
- Events where the outcome of one does not affect the outcome of the other. P(A|B) = P(A).
- Dependent Events
- Events where the outcome of one DOES affect the outcome of the other.
- Intersection (A ∩ B)
- The event that both A and B occur simultaneously.
- Mutually Exclusive
- Events that cannot happen at the same time. P(A ∩ B) = 0.
Worked Examples
Worked Example
Question: There are 7 red counters and 3 blue counters in a bag. Sarah takes a counter at random from the bag and does not replace it. She then takes a second counter. Calculate the probability that Sarah takes two counters of the same colour. (4 marks)
Solution: Step 1: Identify the combinations that give 'same colour'. This means either (Red AND Red) OR (Blue AND Blue). Step 2: Calculate P(Red AND Red). P(1st is Red) = 7/10 P(2nd is Red | 1st was Red) = 6/9 (one red removed, total reduced by one) P(Red, Red) = (7/10) × (6/9) = 42/90 Step 3: Calculate P(Blue AND Blue). P(1st is Blue) = 3/10 P(2nd is Blue | 1st was Blue) = 2/9 (one blue removed, total reduced by one) P(Blue, Blue) = (3/10) × (2/9) = 6/90 Step 4: Add the probabilities of these mutually exclusive outcomes. P(Same colour) = 42/90 + 6/90 = 48/90 Final answer: 48/90 (which simplifies to 8/15, though unsimplified fractions are usually accepted).
Worked Example
Question: A group of 80 students were asked if they study Geography or History. 35 study Geography. 42 study History. 15 study both. A student is chosen at random. Given that the student studies History, find the probability that they also study Geography. (3 marks)
Solution: Step 1: Identify the condition. The condition is 'Given that the student studies History'. Step 2: Find the denominator (the total for the condition). The total number of students who study History is 42. This is our new denominator. Step 3: Find the numerator. Out of those 42 History students, how many also study Geography? The question states that 15 study both. Step 4: Form the fraction. P(Geography | History) = 15 / 42 Final answer: 15/42 (simplifies to 5/14).
Worked Example
Question: The probability that it rains on any given day is 0.4. If it rains, the probability that a football match is cancelled is 0.8. If it does not rain, the probability the match is cancelled is 0.1. Calculate the probability that the match is cancelled. (3 marks)
Solution: Step 1: Set up the pathways that lead to cancellation. Pathway 1: Rains AND Cancelled Pathway 2: Does not rain AND Cancelled Step 2: Calculate Pathway 1. P(Rains) = 0.4 P(Cancelled | Rains) = 0.8 P(Rains AND Cancelled) = 0.4 × 0.8 = 0.32 Step 3: Calculate Pathway 2. P(Does not rain) = 1 - 0.4 = 0.6 P(Cancelled | Does not rain) = 0.1 P(Does not rain AND Cancelled) = 0.6 × 0.1 = 0.06 Step 4: Add the probabilities. P(Cancelled) = 0.32 + 0.06 = 0.38 Final answer: 0.38
Practice Questions
Question: A bag contains 5 red balls and 4 green balls. Two balls are drawn at random without replacement. Calculate the probability that the second ball is green, given that the first ball was red.
Answer:
Question: In a sixth form of 150 students, 85 study Maths, 60 study Physics, and 40 study both. A student is chosen at random. Given that the student studies Physics, find the probability that they do not study Maths.
Answer:
Question: A box contains 10 chocolates. 6 are milk chocolate and 4 are dark chocolate. Three chocolates are chosen at random and eaten. Calculate the probability that exactly two of the chocolates eaten are dark chocolate.
Answer:
Question: Events A and B are such that P(A) = 0.5, P(B) = 0.6 and P(A ∪ B) = 0.8. Find P(A|B).
Answer:
Question: A diagnostic test for a virus is 95% accurate (if you have the virus, it tests positive 95% of the time; if you don't, it tests negative 95% of the time). 2% of the population actually has the virus. A person is chosen at random and tests positive. Calculate the probability they actually have the virus.
Answer: