AQA · A-Level · Physics
Course version: 7408 · Version from Sept 2016
Detection of exoplanets (A-level only): Typical light curve.
A typical exoplanet transit light curve is a graph of relative stellar flux or apparent brightness against time.
Checked against the AQA 7408 specification (opens in a new tab) on .
- Point 3 of 3
- 4 key terms
Study notes
From the checked teaching notes for this specification point.
The idea
A typical exoplanet transit light curve is a graph of relative stellar flux or apparent brightness against time. It shows a flat baseline, a gradual ingress as the planet's disc begins to cross the star, a flat-bottomed dip while the planet is fully in front of the star, a gradual egress as it leaves, and a return to baseline. The depth of the dip indicates how much of the star's light is blocked and therefore relates to the ratio of planet radius to star radius. The time between successive dips is the orbital period, while the width of the dip depends on orbital speed and the chord crossed. Real curves include noise and small variations, so astronomers look for a repeating, consistent shape rather than a single dip.
What earns the marks
- The vertical axis represents relative flux or apparent brightness, often normalised to 1.0 outside transit, and the horizontal axis represents time.
- The baseline is the unobscured stellar flux, and a transit appears as a temporary decrease below this baseline.
- Ingress and egress are the sloping parts of the curve where the planet's disc partially overlaps the star's disc.
- The flat bottom occurs while the planet is fully within the stellar disc, and its depth gives the fraction of starlight blocked.
- The depth is approximately equal to the square of the ratio of planet radius to star radius, so a larger or deeper transit indicates a larger planet relative to its star.
- The interval between repeated dips is the orbital period, and the width of the dip depends on the orbital speed and the path the planet takes across the stellar disc.
- A real light curve contains noise and may show slight variations, so a planet detection requires a periodic, repeatable signal rather than one isolated dip.
Common mistakes and how to put them right
Reading the depth as the planet's diameter rather than a ratio of areas.
Put it right by relating depth to the square of the radius ratio.
Assuming the dip is perfectly rectangular.
Put it right by including gradual ingress and egress as the planet's disc partially overlaps the star.
Treating a single dip as conclusive.
Put it right by requiring a regular, repeating pattern consistent with an orbiting planet.
Confusing the time between dips with the duration of one dip.
Put it right by distinguishing orbital period from transit duration.
Exam tips
- Label the axes, baseline, ingress, flat bottom, egress and period when sketching a typical light curve.
- Use the depth to compare planet sizes only when comparing transits of the same star, and explain that depth is a ratio of areas.
- Explain that repeated dips at regular intervals provide stronger evidence than a single dip because they confirm a periodic orbit.
- Keep descriptions of the curve consistent with the physics: the planet blocks a fraction of the star's light, so the flux falls and then recovers.
Try the lesson
The start of the Detection of exoplanets (A-level only): Typical light curve. lesson, made from checked teaching notes for this specification point.
Have a go first
What feature of a typical exoplanet transit light curve shows that a planet has passed in front of its star?
Listen
A typical exoplanet transit light curve is a graph of relative stellar flux or apparent brightness against time. It shows a flat baseline, a gradual ingress as the planet's disc begins to cross the star, a flat-bottomed dip while the planet is fully in front of the star, a gradual egress as it leaves, and a return to baseline. The depth of the dip indicates how much of the star's light is blocked and therefore relates to the ratio of planet radius to star radius. The time between successive dips is the orbital period, while the width of the dip depends on orbital speed and the chord crossed. Real curves include noise and small variations, so astronomers look for a repeating, consistent shape rather than a single dip. A strong answer earns marks for these points. The vertical axis represents relative flux or apparent brightness, often normalised to 1.0 outside transit, and the horizontal axis represents time. The baseline is the unobscured stellar flux, and a transit appears as a temporary decrease below this baseline. Ingress and egress are the sloping parts of the curve where the planet's disc partially overlaps the star's disc. The flat bottom occurs while the planet is fully within the stellar disc, and its depth gives the fraction of starlight blocked. A common slip: Reading the depth as the planet's diameter rather than a ratio of areas. Instead, relating depth to the square of the radius ratio. Exam tip: Label the axes, baseline, ingress, flat bottom, egress and period when sketching a typical light curve.
See it
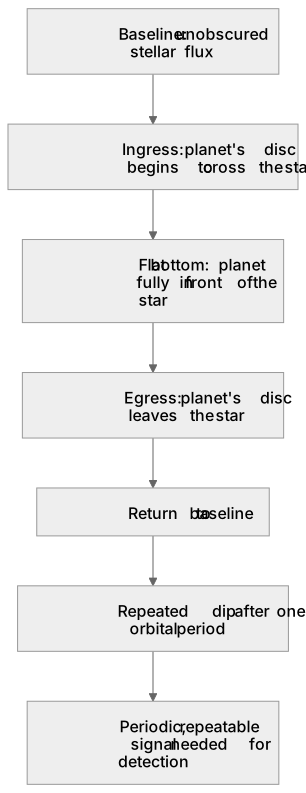
Put it in order
Put these steps in the order they happen.
- 1. Periodic, repeatable signal needed for detection
- 2. Repeated dip after one orbital period
- 3. Flat bottom: planet fully in front of the star
- 4. Return to baseline
- 5. Baseline: unobscured stellar flux
- 6. Ingress: planet's disc begins to cross the star
- 7. Egress: planet's disc leaves the star
Key words
Say what each word means before you turn the card.
Baseline
Try answering aloud or in your head before turning the card.
Ingress and egress
Try answering aloud or in your head before turning the card.
Depth
Try answering aloud or in your head before turning the card.
Orbital period
Try answering aloud or in your head before turning the card.
See every definition
- Baseline
- The unobscured stellar flux, from which a transit appears as a temporary decrease below it.
- Ingress and egress
- The sloping parts of the curve where the planet's disc partially overlaps the star's disc.
- Depth
- The fraction of starlight blocked, approximately equal to the square of the ratio of planet radius to star radius.
- Orbital period
- The interval between repeated dips, distinguished from the duration of one dip.
Label the diagram
Some boxes have lost their names. Pick the right name for each number.
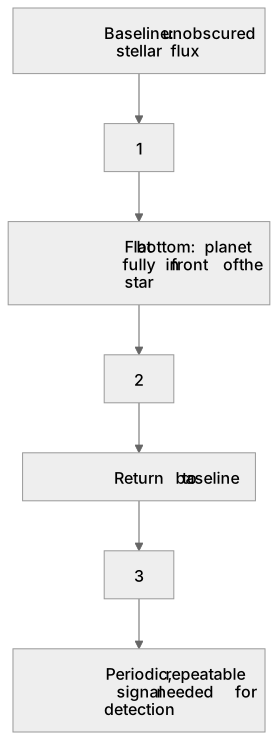
1Box 1
2Box 2
3Box 3
There is more to this lesson
The full lesson goes on to check your understanding and help you earn the marks. Create a free account to carry on, with your progress saved.
A week of Premium from your first lesson · Then the free plan continues · No card, no charge
Test your understanding of Detection of exoplanets (A-level only): Typical light curve.
Active recall beats re-reading. Take an instant quiz now to test what you’ve learned and lock it into long-term memory.
A week of Premium from your first lesson · Then the free plan continues · No card, no charge