AQA · A-Level · Physics
Course version: 7408 · Version from Sept 2016
Individual points on the graph may or may not have associated error bars.
Full specification wording
Limitation of physical measurements: Individual points on the graph may or may not have associated error bars.
When plotting experimental data, each point represents a measured value.
Checked against the AQA 7408 specification (opens in a new tab) on .
- Point 7 of 7
- 4 key terms
Study notes
From the checked teaching notes for this specification point.
The idea
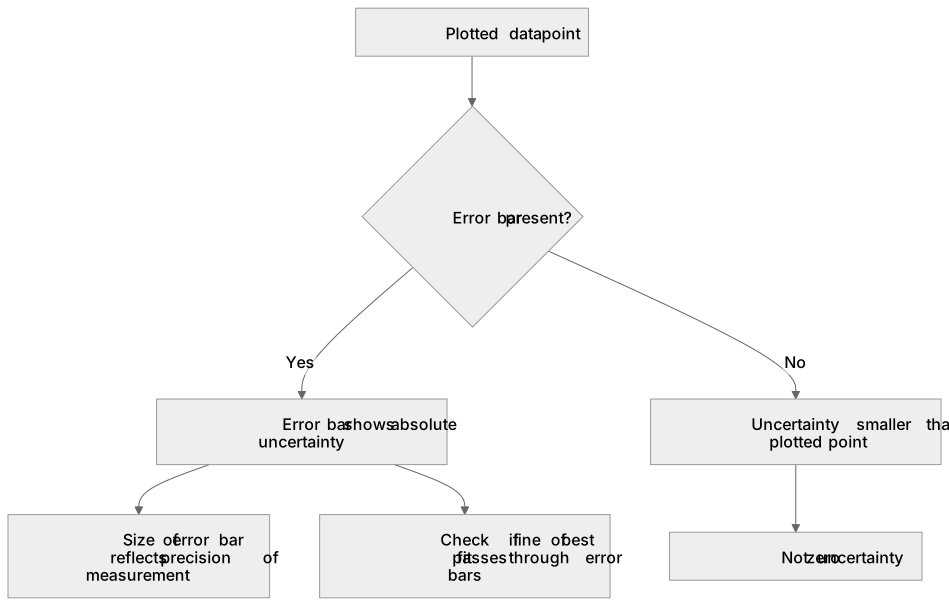
When plotting experimental data, each point represents a measured value. An error bar is drawn through the point to show the absolute uncertainty. Individual points on a graph may or may not have associated error bars. Crucially, if a point lacks an error bar, it is typically because the absolute uncertainty is smaller than the size of the plotted point itself, not because uncertainty is zero. For example, a highly precise digital measurement might yield an uncertainty too small to draw. When evaluating a line of best fit, you must check if it passes through the drawn error bars. The size of the error bar directly reflects the precision of the measurement technique used for that specific data point.
What earns the marks
- State that an error bar represents the absolute uncertainty associated with a plotted measurement.
- Recognise that error bars may be present on some points and absent on others within the same graph.
- Explain that a missing error bar indicates the absolute uncertainty is smaller than the plotted point, not that uncertainty is zero.
- Use error bars to judge whether a straight line of best fit is consistent with the data.
- Describe how the size of an error bar reflects the precision of the measuring instrument or technique.
Common mistakes and how to put them right
Assuming every point must have an error bar.
Put it right: Error bars are omitted if the uncertainty is smaller than the plotted point.
Treating a point without an error bar as exact.
Put it right: Absence of an error bar does not imply zero uncertainty, only that it is too small to display.
Drawing error bars of equal length on all points regardless of the measurement method.
Put it right: Error bar size should reflect the actual uncertainty of each measurement.
Exam tips
- When asked to comment on a graph, explicitly state whether error bars are present and what that means for judging the fit.
- If a point lacks an error bar, explicitly state that the uncertainty is smaller than the plotted point to secure marks.
Try the lesson
The start of the Limitation of physical measurements: Individual points on the graph may or may not have associated error bars. lesson, made from checked teaching notes for this specification point.
Have a go first
A student plots a graph of extension against force. The absolute uncertainty in the extension measurements varies for different data points. Some plotted points have vertical error bars and others do not. What is the most likely reason for a plotted point not having a vertical error bar?
Listen
When plotting experimental data, each point represents a measured value. An error bar is drawn through the point to show the absolute uncertainty. Individual points on a graph may or may not have associated error bars. Crucially, if a point lacks an error bar, it is typically because the absolute uncertainty is smaller than the size of the plotted point itself, not because uncertainty is zero. For example, a highly precise digital measurement might yield an uncertainty too small to draw. When evaluating a line of best fit, you must check if it passes through the drawn error bars. The size of the error bar directly reflects the precision of the measurement technique used for that specific data point. A strong answer earns marks for these points. State that an error bar represents the absolute uncertainty associated with a plotted measurement. Recognise that error bars may be present on some points and absent on others within the same graph. Explain that a missing error bar indicates the absolute uncertainty is smaller than the plotted point, not that uncertainty is zero. Use error bars to judge whether a straight line of best fit is consistent with the data. A common slip: Assuming every point must have an error bar. Instead, error bars are omitted if the uncertainty is smaller than the plotted point. Exam tip: When asked to comment on a graph, explicitly state whether error bars are present and what that means for judging the fit.
See it
Key words
Say what each word means before you turn the card.
Error bar
Try answering aloud or in your head before turning the card.
Line of best fit
Try answering aloud or in your head before turning the card.
Experimental precision
Try answering aloud or in your head before turning the card.
Measurement uncertainty
Try answering aloud or in your head before turning the card.
See every definition
- Error bar
- Drawn through a point to show the absolute uncertainty associated with a plotted measurement.
- Line of best fit
- A straight line that must be checked to see if it passes through the drawn error bars.
- Experimental precision
- Reflected directly by the size of the error bar for that specific data point.
- Measurement uncertainty
- May be smaller than the size of the plotted point itself, so no error bar is drawn.
There is more to this lesson
The full lesson goes on to check your understanding and help you earn the marks. Create a free account to carry on, with your progress saved.
A week of Premium from your first lesson · Then the free plan continues · No card, no charge
Test your understanding of Limitation of physical measurements: Individual points on the graph may or may not have associated error bars.
Active recall beats re-reading. Take an instant quiz now to test what you’ve learned and lock it into long-term memory.
A week of Premium from your first lesson · Then the free plan continues · No card, no charge