AQA · A-Level · Physics
Course version: 7408 · Version from Sept 2016
Axis scales range from –10 to +15 (absolute magnitude) and 50 000 K to 2…
Full specification wording
The Hertzsprung-Russell (HR) diagram (A-level only): Axis scales range from –10 to +15 (absolute magnitude) and 50 000 K to 2 500 K (temperature) or OBAFGKM (spectral class).
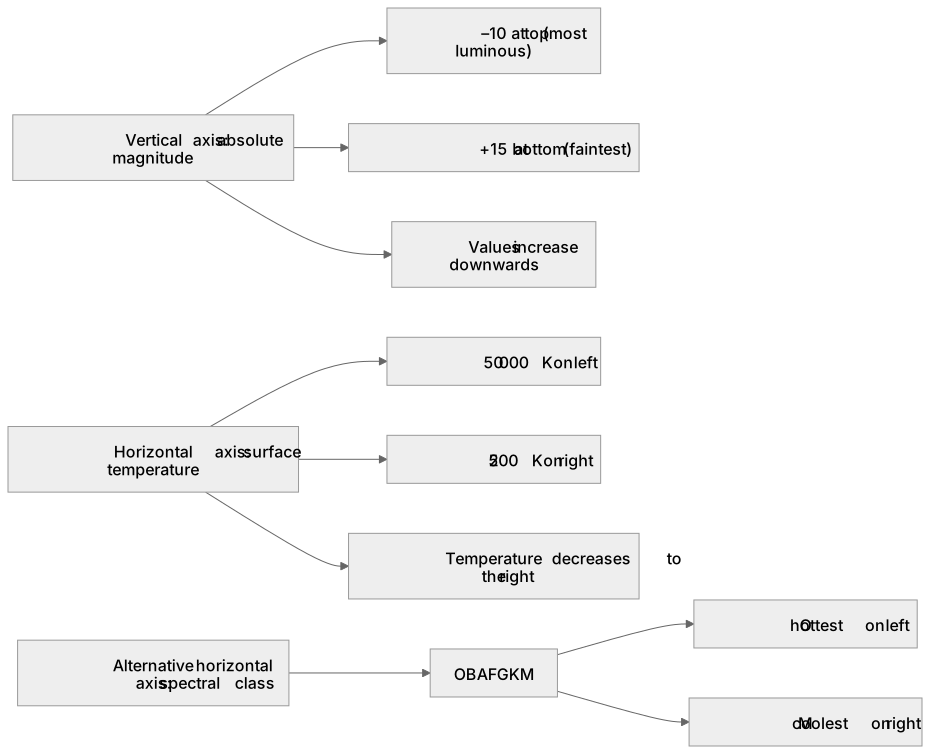
A standard HR diagram uses absolute magnitude on the vertical axis, running from about –10 at the top (most luminous) to about +15 at the bottom (faintest).
Checked against the AQA 7408 specification (opens in a new tab) on .
- Point 2 of 4
- 4 key terms
Study notes
From the checked teaching notes for this specification point.
The idea
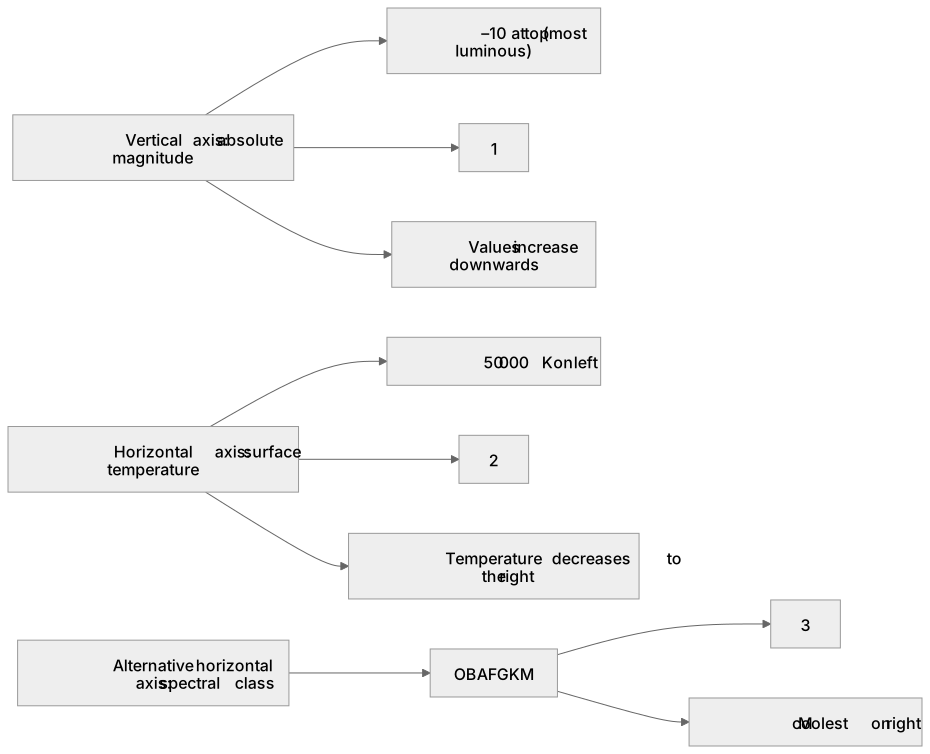
A standard HR diagram uses absolute magnitude on the vertical axis, running from about –10 at the top (most luminous) to about +15 at the bottom (faintest). The horizontal axis shows surface temperature from about 50 000 K on the left down to about 2 500 K on the right, so the scale is reversed compared with a normal graph. Alternatively the horizontal axis can be labelled with spectral classes OBAFGKM, where O is hottest and M is coolest. Note that absolute magnitude increases downwards, so a smaller or more negative number means a brighter star.
What earns the marks
- The vertical axis is absolute magnitude, typically spanning roughly –10 (brightest) to +15 (faintest), with values increasing downwards.
- The horizontal axis is surface temperature, typically spanning roughly 50 000 K (left) to 2 500 K (right), so it decreases to the right.
- Spectral class sequence OBAFGKM runs from hottest (O) on the left to coolest (M) on the right, matching the temperature axis.
- Absolute magnitude is a logarithmic measure of luminosity, so equal vertical steps represent equal ratios of luminosity rather than equal differences.
- A star with absolute magnitude –5 is more luminous than one with absolute magnitude +5, because lower and more negative values are brighter.
- The reversed temperature axis is a deliberate convention that places hot blue stars on the left and cool red stars on the right.
Common mistakes and how to put them right
Reading the temperature axis left to right as increasing.
Put it right: It decreases to the right, from 50 000 K to 2 500 K.
Treating absolute magnitude as increasing upwards.
Put it right: It increases downwards, so +15 is at the bottom.
Assuming a larger positive absolute magnitude means a brighter star.
Put it right: Brighter stars have smaller or negative values.
Mixing up spectral class order.
Put it right: The sequence is OBAFGKM, not alphabetical, and O is hottest.
Exam tips
- Always label both axes with quantity, scale direction and units before plotting or reading values.
- State explicitly that temperature decreases to the right to show you understand the reversed convention.
- When comparing stars, convert absolute magnitude differences into a statement about relative luminosity rather than treating the numbers as linear.
Try the lesson
The start of the The Hertzsprung-Russell (HR) diagram (A-level only): Axis scales range from –10 to +15 (absolute magnitude) and 50 000 K to 2 500 K (temperature) or OBAFGKM (spectral class). lesson, made from checked teaching notes for this specification point.
Have a go first
On a standard Hertzsprung-Russell diagram, what is the range of the absolute magnitude scale shown on the vertical axis?
Listen
A standard HR diagram uses absolute magnitude on the vertical axis, running from about –10 at the top (most luminous) to about +15 at the bottom (faintest). The horizontal axis shows surface temperature from about 50 000 K on the left down to about 2 500 K on the right, so the scale is reversed compared with a normal graph. Alternatively the horizontal axis can be labelled with spectral classes OBAFGKM, where O is hottest and M is coolest. Note that absolute magnitude increases downwards, so a smaller or more negative number means a brighter star. A strong answer earns marks for these points. The vertical axis is absolute magnitude, typically spanning roughly –10 (brightest) to +15 (faintest), with values increasing downwards. The horizontal axis is surface temperature, typically spanning roughly 50 000 K (left) to 2 500 K (right), so it decreases to the right. Spectral class sequence OBAFGKM runs from hottest (O) on the left to coolest (M) on the right, matching the temperature axis. Absolute magnitude is a logarithmic measure of luminosity, so equal vertical steps represent equal ratios of luminosity rather than equal differences. Exam tip: Always label both axes with quantity, scale direction and units before plotting or reading values.
See it
Key words
Say what each word means before you turn the card.
Absolute magnitude
Try answering aloud or in your head before turning the card.
Surface temperature axis
Try answering aloud or in your head before turning the card.
Spectral class
Try answering aloud or in your head before turning the card.
Reversed temperature axis
Try answering aloud or in your head before turning the card.
See every definition
- Absolute magnitude
- A logarithmic measure of luminosity shown on the vertical axis, typically spanning roughly –10 at the top to +15 at the bottom, with values increasing downwards.
- Surface temperature axis
- The horizontal axis spanning roughly 50 000 K on the left down to about 2 500 K on the right, so the scale is reversed compared with a normal graph.
- Spectral class
- A labelling of the horizontal axis as OBAFGKM, where O is hottest on the left and M is coolest on the right, matching the temperature axis.
- Reversed temperature axis
- A deliberate convention that places hot blue stars on the left and cool red stars on the right, with temperature decreasing to the right.
Label the diagram
Some boxes have lost their names. Pick the right name for each number.
1Box 1
2Box 2
3Box 3
There is more to this lesson
The full lesson goes on to check your understanding and help you earn the marks. Create a free account to carry on, with your progress saved.
A week of Premium from your first lesson · Then the free plan continues · No card, no charge
Test your understanding of The Hertzsprung-Russell (HR) diagram (A-level only): Axis scales range from –10 to +15 (absolute magnitude) and 50 000 K to 2 500 K (temperature) or OBAFGKM (spectral class).
Active recall beats re-reading. Take an instant quiz now to test what you’ve learned and lock it into long-term memory.
A week of Premium from your first lesson · Then the free plan continues · No card, no charge